This web page was produced as an assignment for an undergraduate course at Davidson College.
Expression of SGS1 and YMR187C in Yeast
Overview:
Protein expression patterns can provide much insight into the biological roles of a gene. The genes SGS1 and YMR187C are both located on Saccharomyces Cerevisiae (yeast) chromosome XIII. Information about their sequences and functions can be viewed by clicking here. SGS1 is involved in ATP-dependent DNA helicase activity, meaning that it aids in unwinding the double helix so that processes like DNA replication and mRNA synthesis can occur. SGS1 also plays a role in maintaining genomic stability, chromosome organization and biogenesis, meiotic chromosome segregation, and mitotic sister chromatid segregation. Researchers predict that a mutation in SGS1 might lead to rapid aging in yeast, which could perhaps lead to further our knowledge of longevity and aging.
YMR187C is a non-annotated gene, so its biological function is unknown. Analysis of protein expression patterns could help to solve this mystery. I previously predicted that YMR187C is a transmembrane protein and either could be a transcription factor affecting SGS1, could act similarly to the monkey histocompatibility complex, or could play some role in an important DNA process like mitosis, meiosis, replication, or transcription. If not, this open reading frame (ORF) could be a non-coding portion of DNA. These hypotheses will be examined further through the use of protein expression data.
DNA microarray technology makes it possible to simultaneously examine transcription patterns in all the genes of a genome. All 6,200 yeast genes are amplified by PCR, then the DNA for each gene is "spotted" onto a glass microscope slide, bound to it with a covalent bond. cDNA (coding DNA) probes are created from the mRNA expressed in two different experimental conditions, and they are marked with either red or green fluorescent probes. The two sets of cDNA are then allowed to hybridize with the slide, and it is rinsed. The chip is then sent through a scanner, which uses light and sensors to detect the dyes and their relative locations and intensities. Finally a computer analyzes the two color images, and forms a hybrid image with varying shades of green, red, and yellow spots, according to protein expression. See Dr. Campbell's animation of DNA microarray technology here.
These colorful data are often converted into a different color scale (see Fig. 1 below) in which gene induction is red, gene repression is green, and a 1:1 ratio of red to green is not yellow, but is black. This scale is at times confusion, but allows for better visual comprehension. (Campbell and Heyer, 2003)
![]()
Figure 1: Color scale of gene repression and induction. Green indicates a reduction of gene expression, while red indicates an increase of gene expression. These ratios are expressed in "folds," so the brightest colors of green and red above indicate greater than 2.8-fold repression or induction, respectively. (Expression Connection, 2004)
Note: Unless otherwise noted, the microarrays below will be analyzed following the convention that green dye indicates the control, and red dye indicates the experimental condition. As such, an induction (red bar) is an increase of expression as a result of the experimental condition, and a repression (green bar) represents a decrease of expression.
SGS1 Expression:
Function Junction and Expression Connection are branches of the SGD (Saccharomyces Genome Database) website where microarray data is made publicly available for interpretation.
Function Junction (2004) shows that SGS1 does not have any known interactions with other genes or proteins. Homologs of this helicase exist in worm species, as evidenced by the SGD Worm-Yeast Protein Comparison.
The Yeast Microarray Global Viewer provides some interesting microarray data. First of importance is Duvel's inactivation of TAP42, which is a gene involved in protein binding, signal transduction, and cell growth and maintenance (SGD 2004). It physically associates with protein phosphatases. Inactivation of TAP42 typically lengthens the environmental stress response. SGS1 is induced with the inactivation of TAP42, so its role as a regulator of genomic stability is evident (see Figure 2).
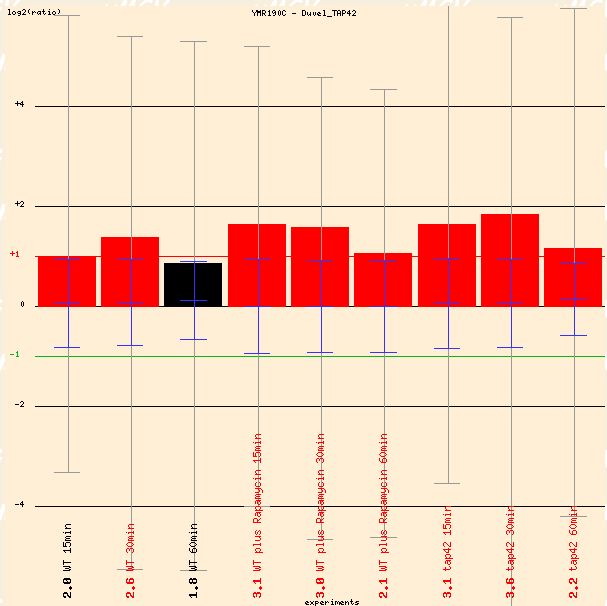
Figure 2: Graphical depiction of average gene induction of SGS1 when TAP42 is inactivated. (Function Junction 2004)
Savoie's study of griseofulvin on S. cerevisiae also shows a repression of SGS1. Griseofulvin, is a widely-prescribed antifungal agent which disrupts the mitotic spindle structure in fungi, leading to metaphase arrest. Although Figure 3 below appears to represent an induction of SGS1, the controls were labeled with red dye and the experimental condition was labeled with green. This is opposite the typical convention, so the data must be interpreted carefully.
Figure 3: Repression of SGS1 in the presence of griseofulvin, an antifungal agent. Red bars must be interpreted as repression because the dyes were applied differently than the convention mentioned above. (Function Junction 2004)
SGS1 transcription is changed in periods of peroxisome activity as well, according to microarray data by Smith et al (2002). Although it is difficult to interpret the data because the conditions are "not annotated yet," it is clear that SGS1 expression is altered in this experimental condition (see Figure 4 below).
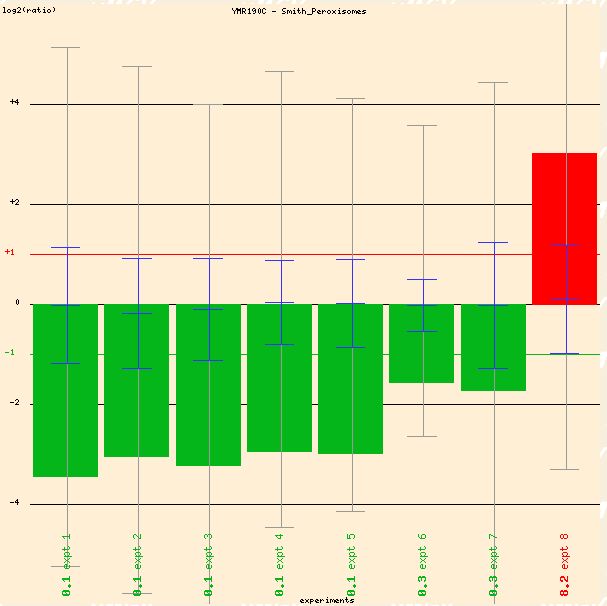
Figure 4: Expression of SGS1 during peroxisome activity. (Function Junction 2004)
Expression Connection (2004) provides information about gene expression in response to certain experimental conditions. First, DeRisi's 1997 study of the diauxic shift shows repression of SGS1. Genes with similar expression patterns seem to be involved with transcription or organizational processes in the genome (see Figure 5), as would be expected.
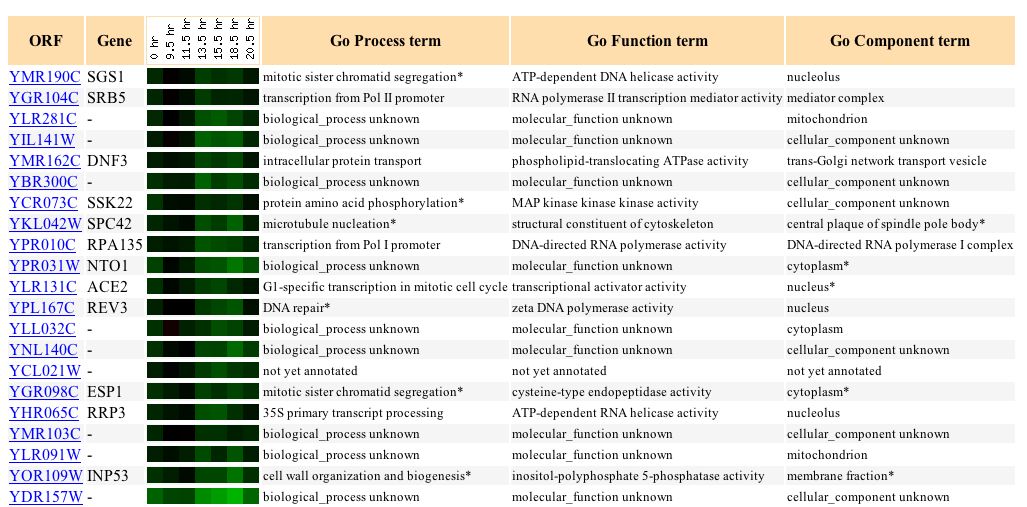
Figure 5: Expression pattern of SGS1 and genes with similar responses to the diauxic shift. (Expression Connection 2004)
A study of expression during the unfolded protein response by Travers et al. (2000) indicates a response ranging from 1.9-fold induction to 1.6-fold repression (see Figure 6). The unfolded protein response regulates gene expression with regards to stress in the endoplasmic reticulum (ER). It is logical that a protein involved with genomic stability has the ability to respond differentially to protein folding tests.
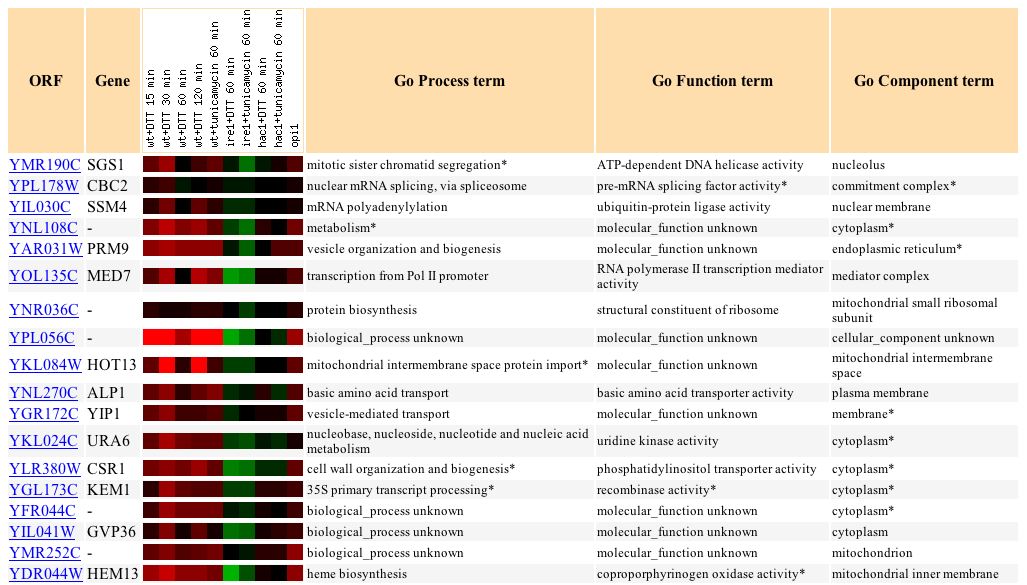
Figure 6: Gene expression of SGS1 and similar genes with respect to the unfolded protein response. (Expression Connection 2004)
Wyrick et al. (1999) examine the gene expression as a result of histone depletion, and in SGS1, it ranged from a 3.2-fold induction to a 1.7-fold repression (see Figure 7). SGS1 is expected to respond to histone depletion, since it plays many roles in DNA processes, as well as organizational processes.
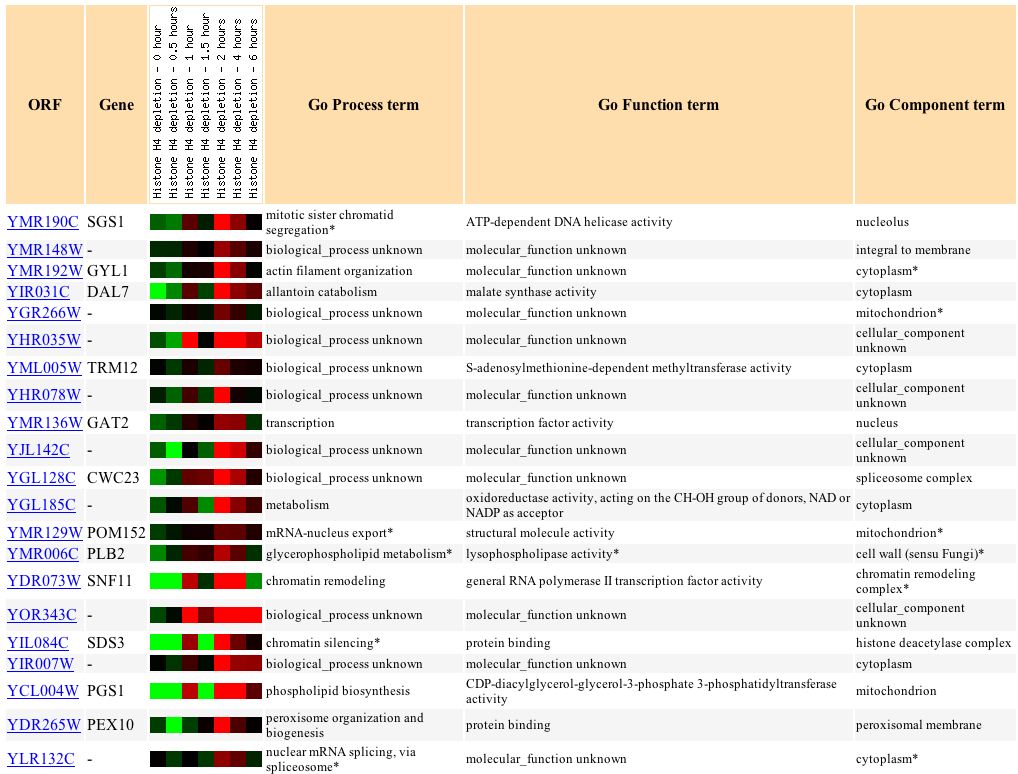
Figure 7: SGS1's response to histone depletion. (Expression Connection 2004)
Perhaps the most interesting expression pattern is that of SGS1 in response to ploidy regulation of gene expression. It is responded in a range of 3.4-fold induction to 5.4-fold repression (see Figure 8). Clearly, this is an indication of SGS1's role in mitotic sister chromatid segregation. Galitski et al. (1999) examined the protein response to varying ploidy conditions, from haploid to tetraploid.
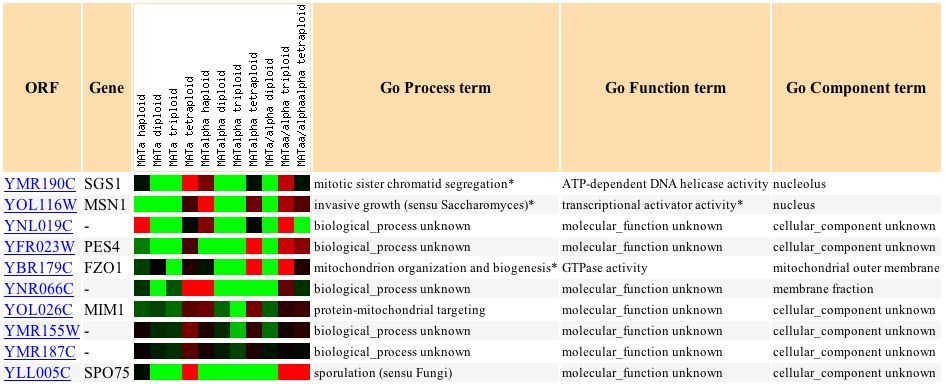
Figure 8: Expression pattern of SGS1 and similar responses to ploidy regulation of gene expression. (Expression Connection 2004)
YMR187C has a similar expression pattern to that of SGS1 with respect to ploidy regulation of gene expression. The Pearson correlation is greater than 0.8 (see Figure 9 below).
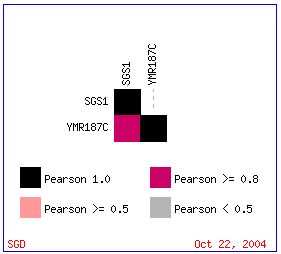
Figure 9: Pearson Correlation >= 0.8 for expression patterns in SGS1 and YMR187C with respect to ploidy regulation of gene expression. (Expression Connection 2004)
Microarray data can be used to confirm our understanding of the functions of SGS1, and perhaps might lead to further discoveries or revised hypotheses about its role in the life of S. cerevisiae.
YMR187C Expression:
According to Function Junction, YMR187C has no known interactions with other genes or proteins. Additionally, "YMR 187C has no significant homologies to any yeast or worm proteins..." (Function Junction 2004).
Function Junction's Yeast Microarray Global Viewer, however, provides some interesting data, some of which are detailed below.
First, Alexandre's microarray study of ethanol stress response of YMR187C shows more than a two-fold induction of YMR187C (see red bar in Figure 10 below). For the red bar in the figure below, the green dye marked the wild-type cells, and the red was the group treated with ethanol 7% (v/v) for 30 minutes. For the two green bars, the dyes were reversed. Essentially, the three bars represent a one- to two-fold increase of transcription in YMR187C when treated with ethanol 7%. The separate methods for dying indicate that the procedure was successful.
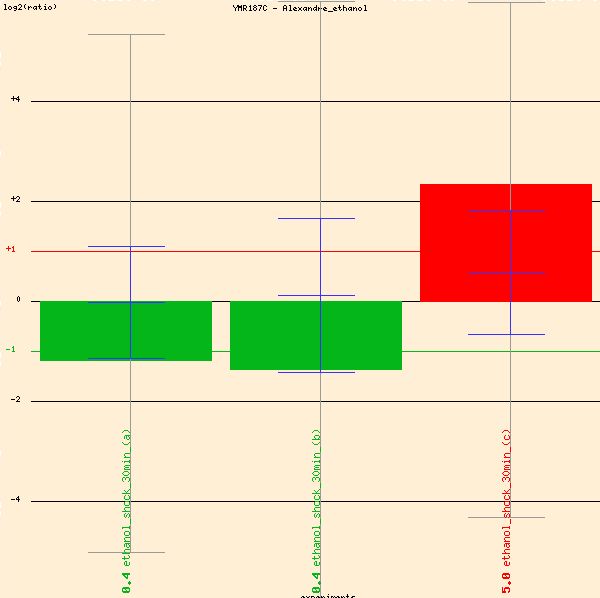
Figure 10: Induction of YMR187C in the presence of ethanol. (Function Junction 2004)
Next, Jelinski's examination of the Rpn4 of YMR187C in microarrays is particularly interesting. According to NCBI (2004), Rpn4 is a transcription factor that stimulates expression of proteasome genes. RPN4 is transcriptionally regulated by various stress responses (SGD 2004). Under many of Jelinski's different conditions, YMR187C was induced (red) over one-fold (see Figure 11). To view the different experimental conditions, click here. Jelinski concludes that the transcription patterns he observed reveal regulatory networks, and that base excision repair is linked to proteasomes by Rpn4 (SGD 2004).
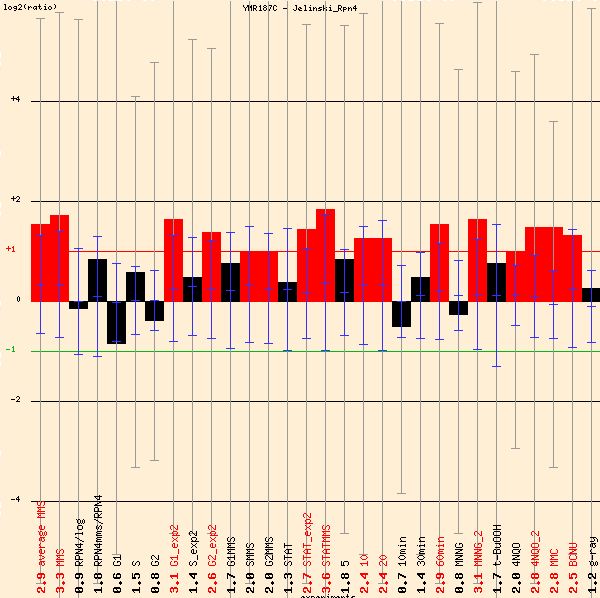
Figure 11: Induction of YMR187C under different experimental conditions. (Function Junction 2004)
Kobor studied transcription factors regulating RNA polymerase II. YMR187C is repressed (green) one- to four-fold in these experiments, so a strong connection seems to exist between YMR187C and RNA polymerase II (see Figure 12).
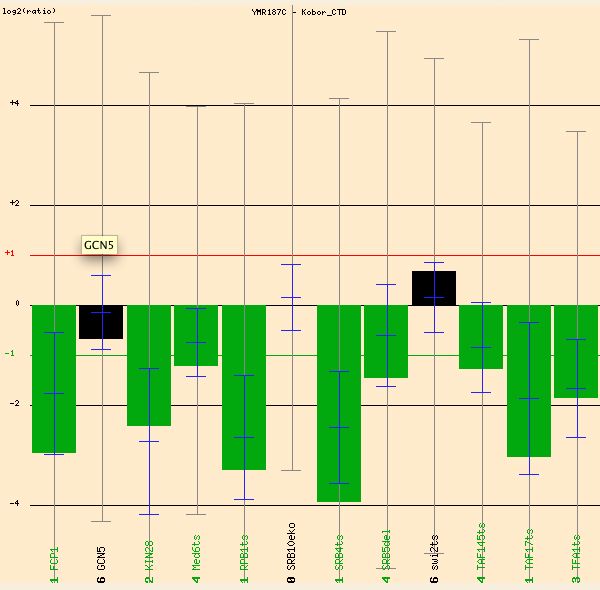
Figure 12: Strong repression of YMR187C in presence of transcription factors regulating RNA polymerase II. (Function Junction 2004)
Savoie studied the effects of griseofulvin, which is a widely-prescribed antifungal agent. The drug disrupts mitotic spindle structure in fungi, leading to metaphase arrest. In Figure 13 below, the red dye labeled non-treated cells, and the green marked the griseofulvin cells (which is opposite the typical convention). Thus, the red bars can be interpreted as repression of YMR187C in the presence of griseofulvin. Perhaps YMR187C plays a role in the mitotic spindle in S. cerevisiae. It is interesting to note that the figure below depicts the transcription levels as the cells were exposed to varying concentrations of griseofulvin for different amounts of time. The genome response seems transient, so it can react to varying conditions with different responses.
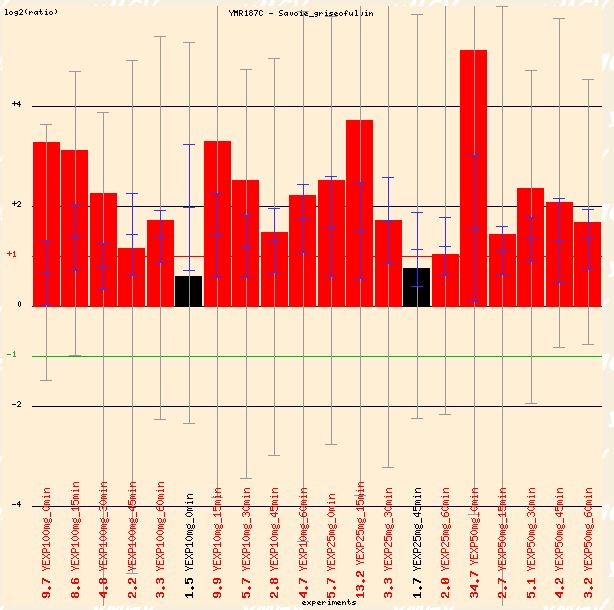
Figure 13: Repression of YMR187C in presence of griseofulvin, an antifungal agent. (Function Junction 2004)
Expression Connection has some interesting microarray data available for analysis as well.
Inspection of YMR187C's expression during sporulation shows that YMR187C's expression is closely related to that of genes involved in processes like cytokinesis and protein organization and creation (see Figure 14).
Figure 14: Expression of YMR187C and other similarly expressed genes during sporulation. (Expression Connection 2004)
YMR187C's expression in response to alpha factor (over time) is very similar to that of FMP52 (whose biological process is unknown) and of TUB2, which is involved in sister chromatid segregation, much like SGS1 (see Figure 15).
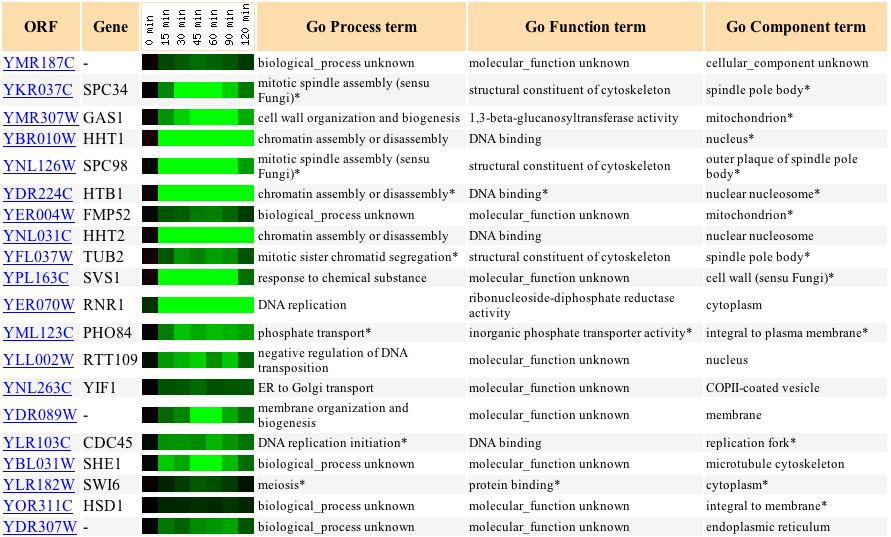
Figure 15: Repression of YMR187C in response to alpha factor (over time). (Expression Connection 2004)
Finally, YMR187C's response with respect to histone depletion is very similar to the response of the gene HCS1, which is involved in lagging strand elongation in DNA activities (see Figure 16).
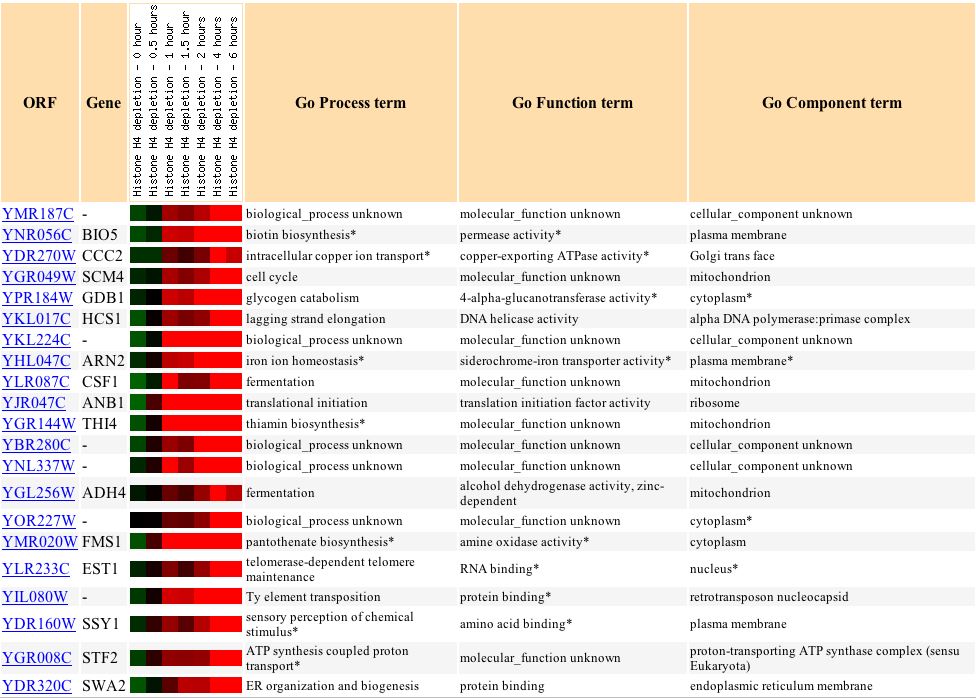
Figure 16: Varying expression response to histone depletion in YMR187C and similarly expressed genes. (Expression Connection 2004)
A search for YMR187C on GenomeNet, which examined the KEGG Genes Database, located a syntenic homolog of YMR187C in Ashbya gossypii called AFL152W, which lies on chromosome VI from bases 147222 to 148499. A. gossypii is a filamentous fungus currently used to produce Vitamin B12 (Dietrich 2004). Its genome has similarity with that of S. cerevisiae with respect to conservation of gene order and orientation, so it is a beneficial study tool. However, the function of AFL152W is yet unknown, so this proves inconclusive.
A motif search of YMR187C sequence returned an E value of 0.21 for a zinc finger protein (see Figure 17 below) from amino acid 17 to 79.
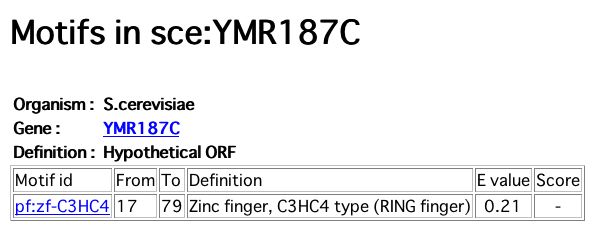
Figure 17: Zinc finger motif in YMR187C sequence. (GenomeNet 2004)
The MIPS (2004) website gives the names of genes with which YMR187C has been found to interact physically. These genes include LYS14 (a transcriptional activator of lysine pathway genes), JSN1 (which suppresses the high-temperature lethality of tub2-150), and RSA3 (RiboSome Assembly protein, binds to the helicase Dbp6p in pre-60S ribosomal particles), which are shown in Figure 18 below.
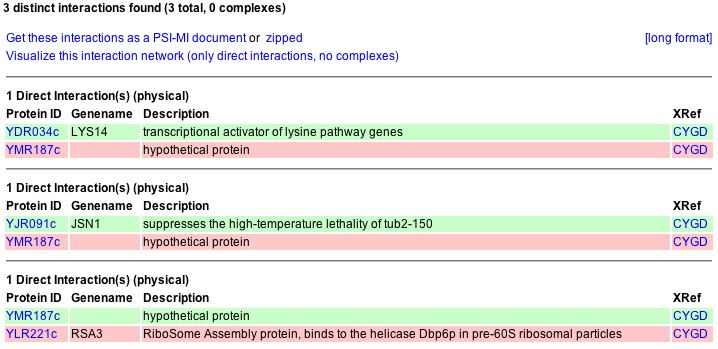
Figure 18: Physical interactions of YMR187C protein with protein products from other genes.
Conclusion:
It seems as though there are many possibilities for the role of YMR187C in the life of yeast. Microarrays indicate that YMR187C could be a regulator of stress responses, a transcription factor affecting DNA polymerase II, a protein involved in cytokinesis and protein organization, or a regulator of important DNA processes.
I would venture to guess that YMR187C plays more than one role in the life of yeast. YMR187C is very close to SGS1, which is involved in sister chromatid segregation. As such, it could have a similar function to SGS1, or it could be regulated by the same promoter upstream. In addition, YMR187C's expression in response to alpha factor is similar to that of TUB2, which also aids in sister chromatid segregation. According to MIPS, YMR187C can physically interact with Tub2-150 to suppress its high-temperature lethality.
Using the guilt by association method, I conclude that YMR187C plays a role in sister chromatid segregation. Its sequence lies very near to a gene that regulates sister chromatid segregation, and it interacts physically with TUB2 which also plays a role in this process.
References:
Campbell AM, Heyer LJ. 2003. Discovering Genomics, Proteomics, and Bioinformatics. Benjamin Cummings: San Francisco. p.107-109.
Dietrich FS, et al. 2004. The Ashbya gossypii Genome as a Tool for Mapping the Ancient Saccharomyces cerevisiae Genome. <http://www.sciencemag.org/cgi/reprint/1095781v1.pdf> 2004 March 4.
Expression Connection website. 2004. <http://db.yeastgenome.org/cgi-bin/expression/expressionConnection.pl> Accessed 2004 Oct 20.
Function Junction website. 2004. <http://db.yeastgenome.org/cgi-bin/SGD/functionJunction> Accessed 2004 Oct 20.
GenomeNet website. 2004. <http://www.genome.jp/> Accessed 2004 Oct 21.
[MIPS] Munich Information Center for Protein Sequences. 2004. YMR187C <http://mips.gsf.de/genre/proj/yeast/searchEntryAction.do?text=YMR187C> Accessed 2004 Oct 21.
[NCBI] National Center for Biotechnology Information. 2004. Mrp4. <http://www.ncbi.nlm.nih.gov/entrez/query.fcgi?db=gene&cmd=Retrieve&dopt=Graphics&list_uids=851542> Accessed 2004 Oct 21.
[SGD] Saccharomyces Genome Database. 2004. <http://www.yeastgenome.org/> Accessed 2004 Oct 20.
Yeast Microarray Global Viewer. 2004. <http://transcriptome.ens.fr/ymgv/index.php> Accessed 2004 Oct 21.
____________________________________________________________________________________________________________________________________________________
For more information, please refer to the Genomics Home Page or to the Davidson College Home Page.
Questions or comments? E-mail me: "jehoekstra" at "davidson.edu".
Back to my genomics home page.
Page last updated 2004 Oct 22 by J. Hoekstra.
