This
webpage was produced as an assignment for an undergraduate course at Davidson
College
Expression
Profiles for my favorite Yeast Genes
Annotated:
DOT1
Non-annotated:YDR458c
DOT1
The annotated gene DOT1 has been found to have the
following characteristics:
Molecular function: protein-lysine N-methyltransferase activity, which means
the protein catalyzes the transfer of a methyl group from S-adenosyl-L-methionine
to the epsilon-amino group of a lysine residue in a protein substrate.
Biological Process: chromatin silencing at telomeres, repressed through the
formation of heterochromatin; histone methylation; and regulation of meiosis,
the process by which the nucleus of a diploid cell divides twice, forming four
haploid cells.
Cellular Component: nucleus, the membrane-bound organelle in which chromosomes
are housed and replicated.
The
best way to examine the expression of a gene under many experimental conditions
is to look at microarray data. Below are examples of DOT1 expression under specific
environmental conditions, taken from the Expression
Connection database.
This scale will be used for all the following microarray figures.
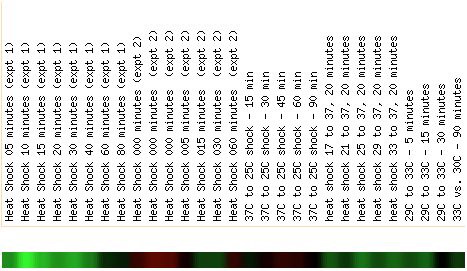
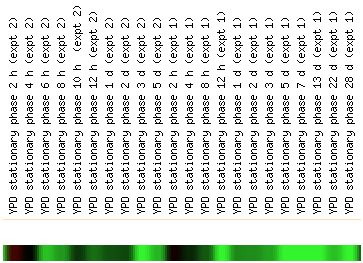
As you can see from the scale above these images, the brighter the color, the
greater the change in expression of the protein. If the area under the experimental
condition is red, the cell had induced expression of this particular gene compared
to the wildtype expression. If the color is green, the protein was repressed
compared to the control data.
However to examine the most interesting data, we would want to know which genes
have the most change in expression under the experimental conditions. This would
indicate that the conditions are prime for the gene either to be expressed or
to be turned off.
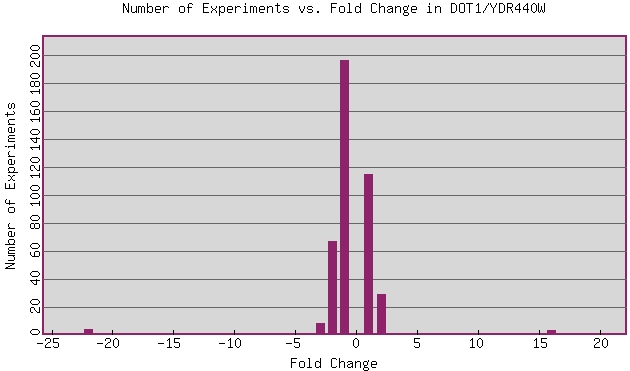
This figure examines the amount of repression or induction incurred by particular
types of experimental conditions. Those at the outlying numbers are the most
interesting, as those conditions have produced the largest response from the
gene. The positive numbers indicate when the gene has been induced, and negative
numbers indicate conditions under which the gene has been repressed.
Examining the expression pattern under these conditions could lead to a more
comprehensive understanding of the gene expression. The experiment at -22 Fold
Change was ploidy regulation of gene expression, thus below we will examine
the expression patter under those conditions:
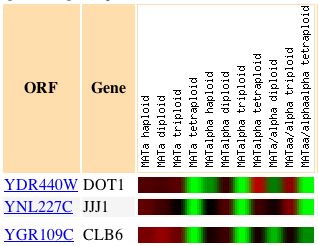
On the first row of the figure, we can see the gene expression pattern for DOT1,
with green indicating a repressed signal. Below DOT1, we can see two other genes
that also have expression patterns very similar to DOT1 under the same conditions.
This is another method of looking for gene function, and one can compare a gene's
expression patterns to another to see if they could be expressed using the same
promoter, thus may be linked. While the exact amount of repression or induction
is not equal, the same patterns could indicate a link in their regulation.
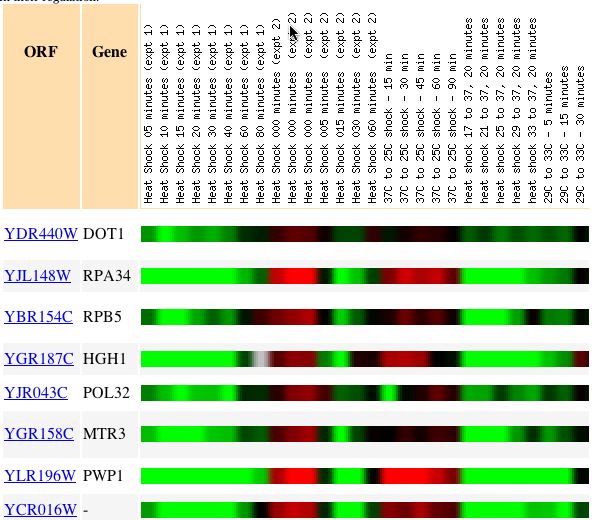
Under the environmental conditions, this is an example with only several genes,
however there are many other genes that also match the expression pattern of
DOT1. As you can see from the image above, the gene directly below DOT1, RPA34,
appears to have an almost identical expression pattern, but the amount of induction
or repression appears to be greater. While DOT1 is barely induced in the beginning
of the Heat shock experiment 2, RPA34 shows the same pattern, but with a large
amount of induction. Since the expression patterns are so similar, we would
expect the two genes to be similarly regulated. In order for the yeast to want
to regulate two genes in the same manner, they most likely have very similar
functions. When we examine the function of RPA34, we find it is localized to
the nucleus, is involved in the transcription of the Pol1 promoter, and catalyzes
the DNA template directed extension of RNA. While these two proteins are localized
to the same location, the functions do not appear very similar. This could lead
researchers to examine a link between these two functions, as they are regulated
very similarly.
This data has shown us some interesting paths to further examine, however it
supports the current knowledge about the function of the DOT1 gene.
YDR458c
This non-annotated gene is located in close proximity to gene DOT1, on chromosome
IV. While the function, process and cellular location of this gene are unknown,
some hypotheses can be made based on the similarity between the function of
this protein and others using the same method detailed above for the annotated
gene.
To see what kind of experiments have been done to record the expression levels
of YDR458c, we use the yeast
Microarray Global Viewer. Shown below are the key changes in expression
ordered by author and condition for expression change. As you can see, there
are several conditions that cause the gene to have a changed pattern of expression.
To compare this gene with the DOT1 expression, using the same Expression
Connection database, here are the expression patterns for
the same experimental conditions as shown in the first two figures for the annotated
gene DOT1.
As you can see, the expression patterns are very different,
so although the genes are very close to one another on the chromosome, this
does not necessarily mean they are under the control of the same promoter.
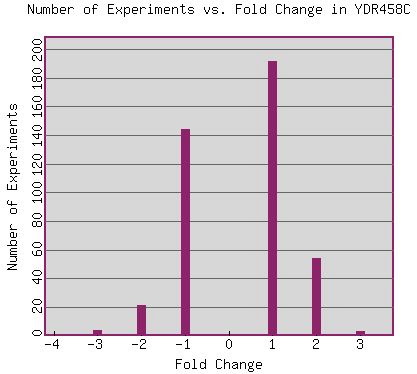
Unfortunately, there are no major changes in the expression of this unknown
gene, as there were with DOT1. However, we will still examine the experiments
that cause the +3 fold change in the gene expression of this unknown gene. These
changes were caused by three separate experimental conditions: response to DNA-damaging
agents, response to environmental factors, and histone depletion. As we have
already examined several of the environmental factors, we will look at the response
to DNA-damaging agents.
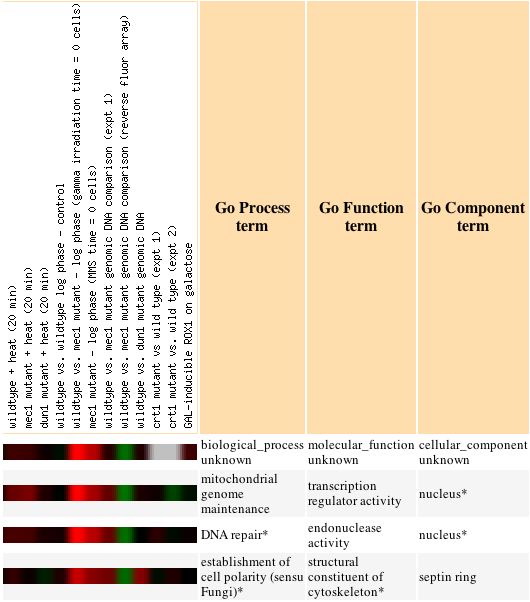
From this image, we can see the bright red under the mec1 mutant header. This
indicates a strong induction of the gene under these circumstances. Also, we
see that there are several other genes with known functions, that have clustered
with the expression of the unknown gene. These three other genes may be able
to give us a clue to the function of the non-annotated gene. For example, the
two directly below YDR458c are both involved in maintaining and repairing DNA,
and both are localized to the nucleus. This gives us a hint towards determining
the function of the unknown protein. To be more certain, more expression checks
should be done under different conditions.
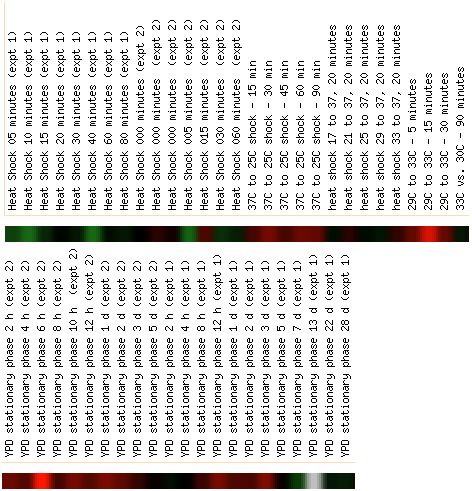
Another condition that cause a significant fold change was Expression during
Sporulation. This caused the gene expression to be repressed, three fold. When
we search for other genes that show similar expression to YDR458c under the
sporulation condition, we find:
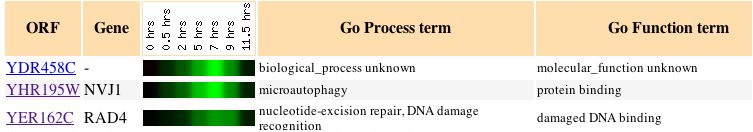
This image shows the two most similar gene expression profiles to that of the
unknown gene. As you may notice, again we see a DNA damage function. Microautophagy
means the direct transfer of cytosolic components into the lysosomal compartment.
Both of these proteins are found localized in the nucleus, or its membrane.
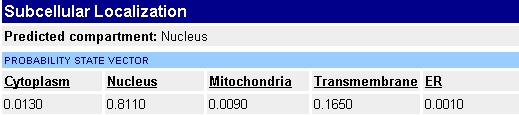
Since the protein likely has a transmembrane location, we might guess that it
is present in the membrane of the nucleus. Using the Yale
Gerstein Gene Census for YDR 458c, we can confirm that the protein has a
high probability of being localized to the nucleus, as seen in the image below:
By
searching the web supplement to the paper written by Gasch
et. al when they examined the response of yeast cells to environmental
changes, I found the non-annotated gene clustered with several other genes that
showed the same expression across the environmental conditions.
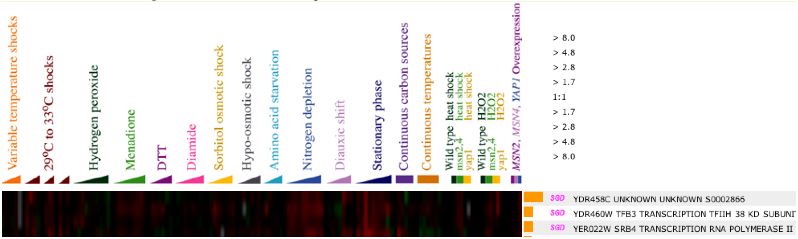
As you can see, the pattern is very similar between these three genes, and the
two known genes have functions involving DNA transcription. Another method of
examining function is to check the association of YDr458c with other proteins.
The function of the associated proteins may give more information about the
function of the unknown protein. To check for any protein interactions, I used
the
Yeast Grid, and found that YDR458c associated with only one protein, as
shown below:
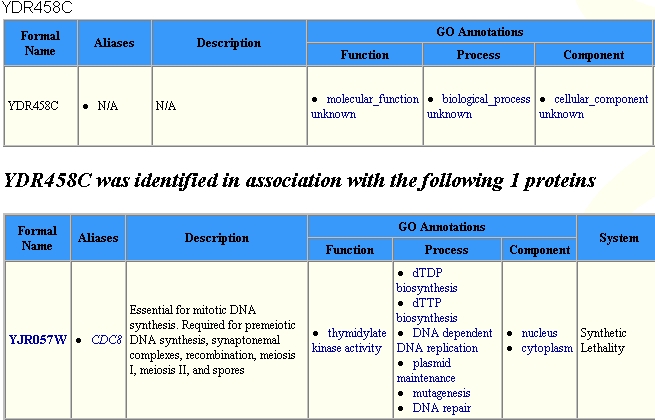
As seen in the image above, the associated protein, YJR057W is essential for
mitotic DNA synthesis, and is also found in the nucleus.
By
searching the database UniProt, we
can search for other genes in Saccharomyces cerevisiae that are similar
to YDR458c based on sequence similarity. The database found three proteins,
however only one had an already known function.

In the above figure, SRC1 is found to match YDR458c. The SRC1 protein plays
a role in sister chromatid separation. Thus, it is active during mitosis, and
also localizes to the nuclear periphery.
Due
to so much of the data pointing toward an interaction with DNA and a localization
to the nuclear membrane, I believe it would be an educated guess to say that
the function of the non-annotated gene YDR458c involves an interaction with
DNA and is found in the membrane of the nucleus. Perhaps YDR458c associates
with SRC1 because it also assists in mitosis. YDR458c may check for damage done
to the DNA during mitosis, or may signal that damage has been done. This method
of hypothesizing function based on association with other genes because of gene
expression profiles is known as guilt by association, and while not always an
accurate method, is one of the better places to begin when the function of a
gene is unknown.
References
Chu S, DeRisi J, Eisen M, Mulholland J, Botstein D, Brown PO, Herskowitz
I 1998. "The transcriptional program of sporulation in budding yeast".
Science, 282, 699-705.
Gasch AP, et al. 2000. "Genomic Expression Programs in the Response
of Yeast Cells to Environmental Changes". Mol. Biol. Cell; 11,
4241-4257.
Gasch AP, Huang M, Metzner S, Botstein D, Elledge SJ, Brown PO 2001. "Genomic
expression responses to DNA-damaging agents and the regulatory role of the yeast
ATR homolog Mec1p". Mol Biol Cell, 12;2987-3003.
Galitski T, Saldanha AJ, Styles CA, Lander ES, Fink GR 1999. "Ploidy regulation
of gene expression". Science; 285, 251-4.
Huh WK, et al. 2003. "Global Analysis of Protein Localization
in Budding Yeast". Nature; 425, 686-691.
Tong, et al. 2004. "Global Mapping of the Yeast Genetic interaction
network". Science; 303, 774-775.
Expression
Connection
Mips
Yeast Genome Database
UniProt
Yale Gerstein Gene Census
Genomics
Home Page


Send
questions or comments to: Megan McDonald