My Favorite Yeast Expression:
On a previous page, I described the annotated PDI1 gene and explored available information on the neighboring YCL047C hypothetical ORF, which is entirely uncharacterized. Based on this information, I was able to propose a hypothetical gene function for YCL047C. This page will take the next step – examining expression patterns of PDI1 and YCL047C. This investigation will provide more information about PDI1 and will help to refine the hypothetical function of YCL047C.
Review of PDI1
∙ PDI1 is located within a small region of the Crick strand of Saccharomyces cerevisiae chromosome 3 (coordinates 50221-48653).
∙ PDI1 encodes the essential protein disulfide isomerase. This protein product catalyzes the formation of native disulfide bonds in secretory proteins, an important factor leading to the overall structure of these proteins.
∙ The folding of secretory proteins occurs within the lumen of the endoplasmic reticulum. Consequently, the protein product of PDI1 is also found in this region.
∙ The PDI1 protein product contains two thioredoxin-like domains, each with a copy of the active site sequence motif CGHC. The two cysteines within these active sites possess the ability to cycle between a reduced and an oxidized state. In the oxidized state, the two cysteines form an intramolecular disulfide bond that enables PDI1 to convert a pair of sulfhydryl groups in a polypeptide substrate into a disulfide bond.
PDI1 Expression Data Analysis
The image below depicts the number of experiments in which PDI1 mRNA expression is changed by two-fold, four-fold, etc. This figure illustrates the fact that most experiments present a two-fold (or less) change in PDI1 mRNA expression.
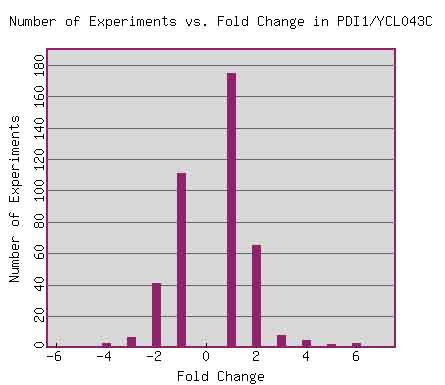
Figure 1. Expression Histogram for PDI1. This graph shows the number of experiments (in the Expression Connection database) in which PDI1 mRNA expression changed by two-fold, four-fold, etc. A negative fold change value (x-axis) indicates fold repression, while a positive number indicates fold induction. Image from: http://db.yeastgenome.org/cgi-bin/expression/expressionConnection.pl?orf=YCL043C&type=histogram. Permission pending.
PDI1 is known to be involved in the protein-folding process of secretory proteins, catalyzing the formation of native disulfide bonds. Therefore, data detailing the expression of PDI1 under conditions favorable and unfavorable to protein formation would be expected to yield biologically significant results.
For example, genes involved in protein synthesis are typically repressed in response to a diauxic shift (DeRisi 1997). Based on this information, we would expect to find PDI1 repressed in response to a diauxic shift; however, this is not the case. Analysis of PDI1 microarray data has actually shows an induction of expression, with a fold-induction maximum at 1.8.
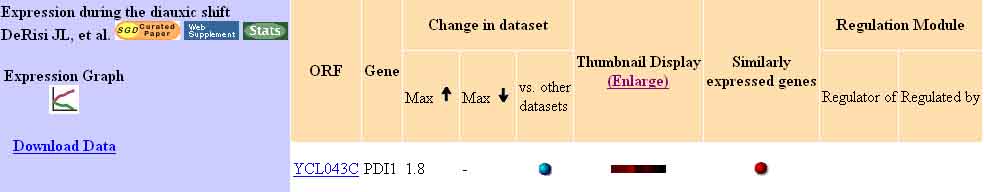
Figure 2. PDI1 Expression During a Diauxic Shift. This image shows that PDI1 expression is actually induced during the diauxic shift, up to 1.8-fold. This is contrary to the expected repressed value. Image from: DeRisi 1997. Permission pending.
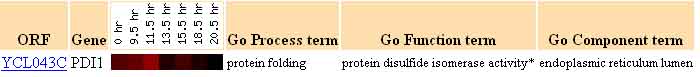
Figure 3. PDI1 Expression During a Diauxic Shift. This image shows a closer view of the microarray data for PDI1 expression. Clearly all data is red, maroon, or black - indicating expression is present, with no signs of induction. Image from: DeRisi 1997. Permission pending.
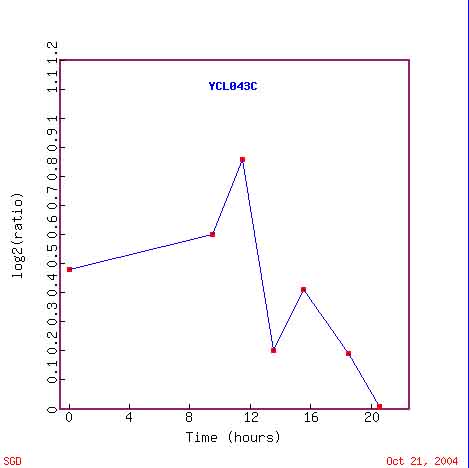
Figure 4. PDI1 Expression During the Diauxic Shift Over Time. This chart shows the expression level of PDI1 mRNA over a period of 20-hours, during the diauxic shift. This figure depicts a slow rise in expression for 8-hours, a sharp peak at 10-hours, followed by a dip and rise, and an expression level of almost 0 at 20-hours. Image from: DeRisi 1997. Permission pending.
The image shown below provides a list of genes with a Pearson correlation of >0.8, that is, genes which display an expression pattern similar to that of PDI1.
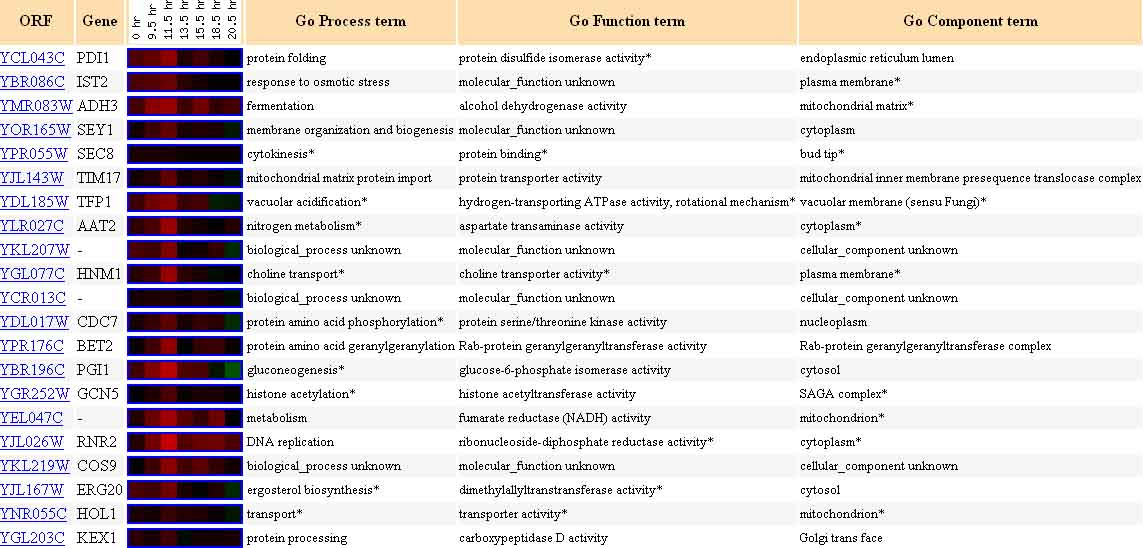
Figure 5. Twenty Genes Expressed Similarly to PDI1 During the Diauxic Shift. The genes listed above each have a Pearson correlation >0.8, meaning they are similarly expressed to YCL047C in the diauxic shift experiment. Image from: DeRisi, et al. Permission pending.
Although this information contradicts the expected change in mRNA expression, it does support the known function of the PDI1 protein product, as many of these "similarity of expression" hits are for protein synthesis and protein processing genes. Guilt by association seems to be valid, in this case. The lack of agreement with the predicted repression of protein formation proteins could mean that PDI1, the gene for an essential protein disulfide isomerase, is transcribed when others are not. Or maybe a large number of secretory proteins were necessary for the yeast’s survival in the diauxic shift; thus, PDI1 had to be expressed. Of course, this is only speculation, but this induction certainly does not lead one to doubt the known function of PDI1.
Also interesting to note is the expression pattern displayed by PDI1 in the stationary phase. Stationary phase is defined as the phase of yeast growth at which there is no net increase in cell number. The figure below shows that PDI1 is repressed during this phase of the yeast life cycle. The repression of PDI1 during stationary phase suggests that the protein disulfide isomerase is not necessary for the maintenance of the cell when it is not undergoing cell division.
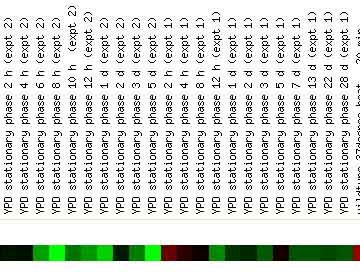
Figure 6. PDI1 Expression in Stationary Phase. This image illustrates that PDI1 is repressed during this phase of the yeast life cycle. The repression of PDI1 during stationary phase suggests that the protein disulfide isomerase product of PDI1 is not necessary for the maintenance of the cell when it is not actively dividing. Image from: DeRisi, et al. Permission pending.
Also interesting is the response of PDI1 expression during heat and cold shocks. The image below shows a clear correlation between heat shock and PDI1 induction, and cold shock and PDI1 repression.
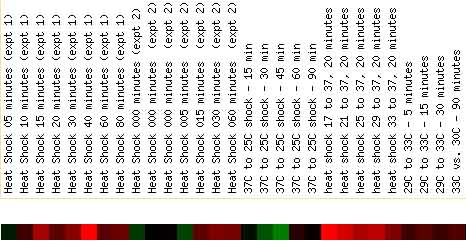
Figure 7. PDI1 Expression Changes in Response to Heat Shock and Cold Shock. This image shows a direct relationship between heat shocks (which produce an induction in the expression of PDI1) and cold shocks (which produce a repression of PDI1). Image from: DeRisi, et al. Permission pending.
Examination of the expression data, yielded from microarray experiments, provides valuable information concerning expression patterns of PDI1, in a variety of experimental conditions. This page has focused on the effects of a diauxic shift, expression in the stationary phase, and expression in response to heat and cold shocks. While some of the gene expression data does not support the anticipated results, the expression data does not immediately disprove the known gene function. Instead, investigators should ask why the data doesn’t match. Such unanticipated results can actually be very beneficial in determining the intricacies of the exact pathways through which a protein functions and the myriad of other factors which may affect a protein’s function.
My Favorite Yeast Expression: YCL047C
Review of YCL047C
∙ YCL047C is located within a small region of the Crick strand of Saccharomyces cerevisiae chromosome 3 (coordinates 44437- 43661).
∙ A BLASTp search resulted in a strong hit for the AFR721Wp protein in Eremothecium gossypii. Within this protein, there is a cytidylyltransferase conserved domain. Cytidylyltransferases form the critical intermediates in the biosynthesis of lipids and complex carbohydrates.
∙ A conserved domain search of the YCL047C sequence resulted in only one hit – the nicotinic acid mononucleotide adenylyltransferase domain, used in coenzyme metabolism.
∙ The Kyte-Doolittle hydropathy plot predicts the presence of two transmembrane domains – one near amino acid 65 and another near amino acid 108.
∙ On my previous page, I hypothesized that YCL047C is a transmembrane functional protein involved in coenzyme metabolism.
YCL047C Expression Data Analysis
The image below depicts the number of experiments in which YCL047C mRNA expression is changed by two-fold, four-fold, etc. This figure illustrates the fact that most experiments present a two-fold (or less) change in YCL047C mRNA expression.
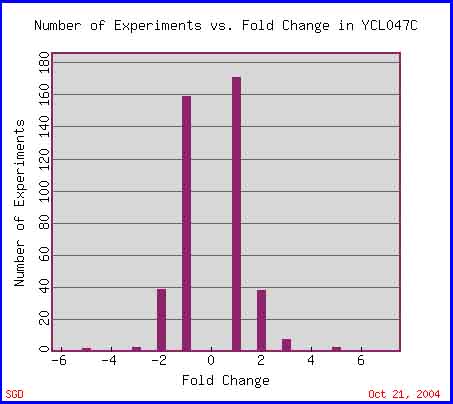
Figure 8. Expression Histogram for YCL047C. This graph shows the number of experiments (in the Expression Connection database) in which YCL047C mRNA expression changed by two-fold, four-fold, etc. A negative fold change value (x-axis) indicates fold repression, while a positive number indicates fold induction. Image from: http://db.yeastgenome.org/cgi-bin/expression/expressionConnection.pl?orf=YCL047C&type=histogram. Permission pending.
In fact, as shown by the figure below, there are only three types of experiments which demonstrate a fold change of three-fold or more: experiments concerned with subjecting yeast to various environmental stimuli (such as heat shock and cold shock), experiments testing expression regulated by the calcineurin/Crz1 pathway, and those concerned with expression during the unfolded protein response. This short list was created by using search option II, on the Expression Connection site, in order to find datasets where the expression of genes changes by a user-defined amount. The search parameters for this search were fold induction or repression of three-fold.
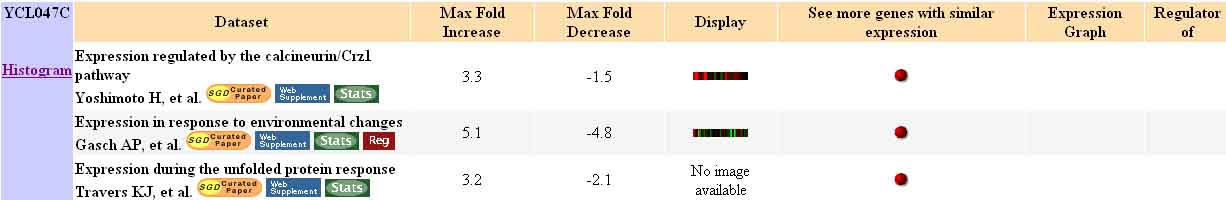
Figure 9. Experiments Producing a Three-Fold Change in Expression in YCL047C. This figure shows the three types of experiments which have yielded a result of at least three-fold induction or repression of YCL047C mRNA expression. Image from: http://db.yeastgenome.org/cgi-bin/expression/expressionConnection.pl. Permission pending.
An interesting point to note is that the expression histogram for YCL047C also noted a three-fold increase in mRNA expression for YCL047C, during the cell cycle. This is not included in the results of the above search.
The following data will analyze each of the three experiments which produced a three-fold change in the expression of YCL047C mRNA, in hope of clarifying the functional role this protein product may play in the cell.
Figure 10 (below) shows the microarray data for the expression of YCL047C regulated by the calcineurin/Crz1 pathway. This image shows that YCL047C was mainly induced under the experimental conditions of this experiment. Based on the previous figure, we know that YCL047C experiences a maximum induction of 3.3-fold.
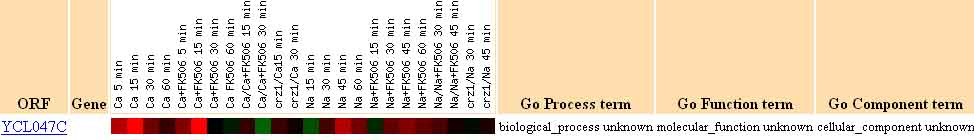
Figure 10. Expression of mRNA for YCL047C Regulated by the Calcineurin/Crz1 Pathway. This image shows the results of a study detailing yeast mRNA expression regulated by the Calcineurin/Crz1 pathway. This image illustrates that YCL047C was mainly induced under the experimental conditions (with a maximum induction of 3.3-fold). Image from: Yoshimoto, et al. Permission pending.
The twenty genes listed in the next figure, represent genes with a Pearson correlation of >0.8, that is, genes which were similarly expressed to YCL047C in the experiment in which yeast mRNA expression was regulated by the Calcineurin/Crz1 pathway.
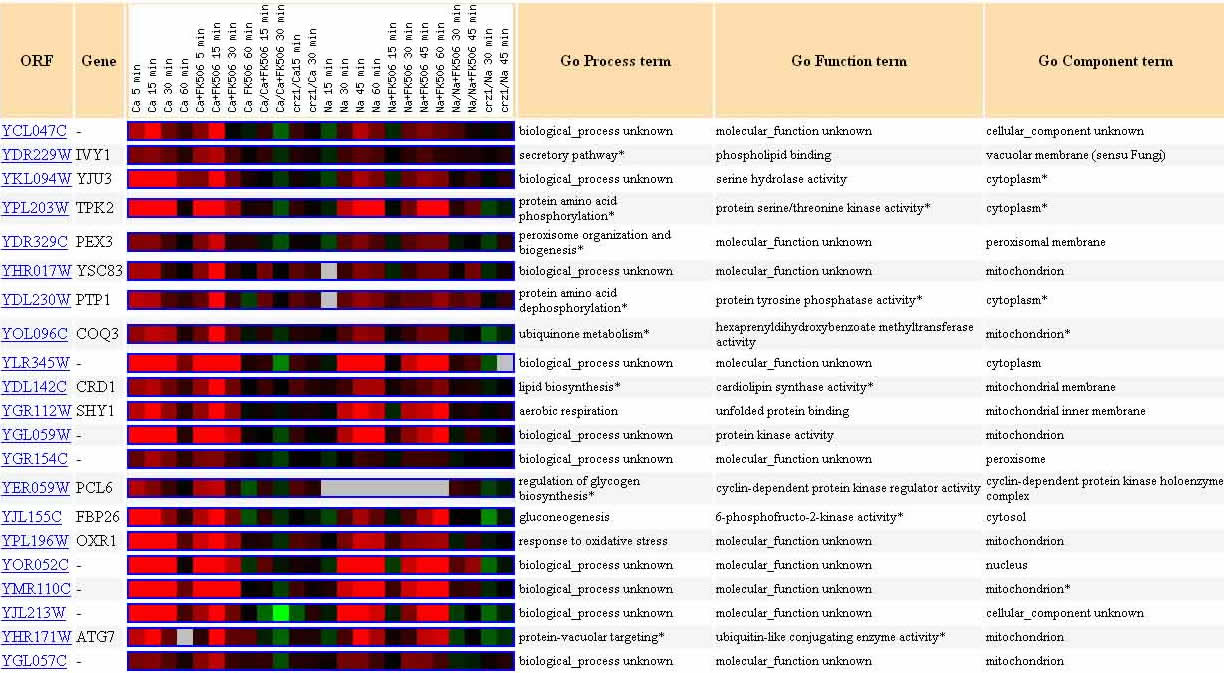
Figure 11. Twenty Genes Expressed Similarly to YCL047C in Calcineurin/Crz1 Pathway Experiment. The genes listed above each have a Pearson correlation >0.8, meaning they are expressed similarly to YCL047C in the experiment in which mRNA expression was regulated by the Calcineurin/Crz1 pathway. Image from: Yoshimoto, et al. Permission pending.
Guilt-by-association would indicate that YCL047C could play a genetic role similar to, or complementary to, any of these genes. Among the possibilities are phospholipid binding, serine hydrolase activity, unfolded protein binding, lipid biosynthesis (consitent with the BLASTp result for the AFR721Wp protein with a cytidylyltransferase conserved domain), ubiquinone metabolism (consistent with the nicotinic acid mononucleotide adenylyltransferase domain of YCL047C), etc.
Another experiment which yielded an expression change of more than 3-fold was that of expression during the unfolded protein response. Although no image is available for YCL047C expression during the course of this experiment, the data show that the experimental conditions produced a peak induction of 3.2-fold.
The twelve genes listed in the next figure, represent genes with a Pearson correlation of >0.8 for the experiment in which yeast mRNA expression was monitored during the unfolded protein response. The genes listed here were similarly expressed to YCL047C.
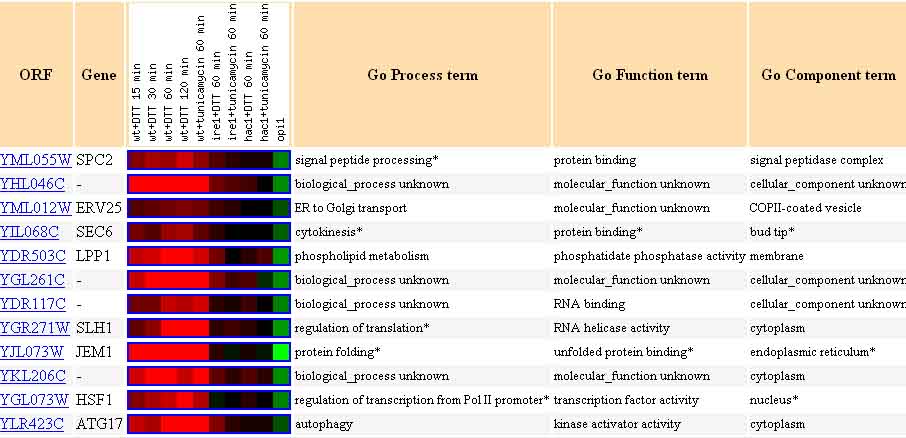
Figure 12. Twelve Genes Expressed Similarly to YCL047C During the Unfolded Protein Response. The genes listed above each have a Pearson correlation >0.8, meaning they are expressed similarly to YCL047C. Image from: Travers, et al. Permission pending.
Guilt-by-association would indicate that YCL047C could play a genetic role similar to, or complementary to, any of these genes. Among the possibilities are protein binding, phospholipid metabolism, RNA binding, kinase activator activity, transcription factor activity, etc.

Figure 13. Expression of mRNA for YCL047C in Response to Environmental Changes. This image shows the results of a study detailing yeast mRNA expression in response to different environmental stimuli. This image illustrates that YCL047C shows strong repression under cold shock conditions (peak -4.8) and strong induction under heat shock conditions (peak 5.1). Image from: Gasch, et al. Permission pending.
The next figure, represents a search for genes with a Pearson correlation of >0.8 to YCL047C, that is, genes which were similarly expressed to YCL047C in the experiment in which mRNA expression varied in response to environmental stimuli. Clearly, there are no matches!
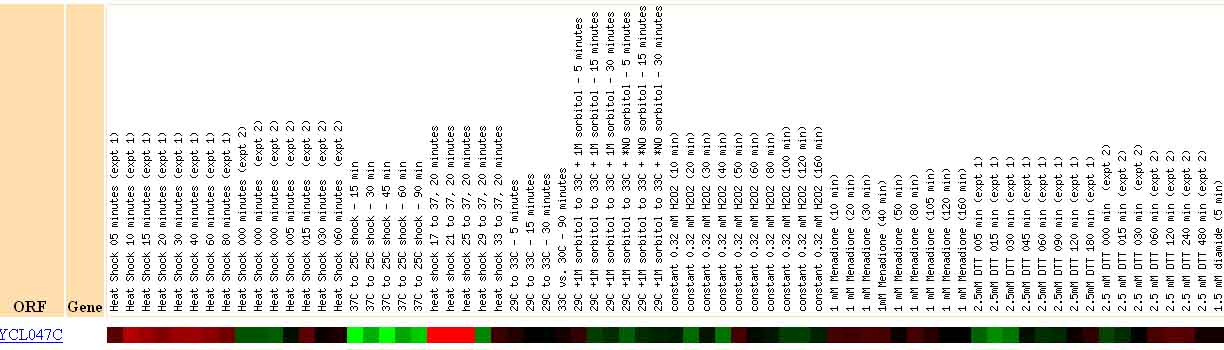
Figure 14. No Genes Expressed Similarly to YCL047C in Response to Environmental Changes. This image shows that no gene has a Pearson correlation >0.8, meaning none are similarly expressed to YCL047C in the experiment in which mRNA expression varies in response to environmental changes. Image from: Gasch, et al. Permission pending.
Since there are no genes with similar expression patterns to YCL047C, there is no guilt-by-association hypothesis attainable from this experiment.
Finally, since my hypothesis was that YCL047C is a transmembrane functional protein involved in coenzyme metabolism, I will examine the results of the diauxic shift experiment. One would typically expect an mRNA transcript involved in energy metabolism to be induced in response to a diauxic shift (DeRisi, et al. 1997).
Figure 15 (below) shows the microarray data for the expression of YCL047C during the diauxic shift. This image shows that YCL047C was hardly induced or repressed, with a peak induction at 1.3 and a peak repression at -1.3. This result is fairly neutral; while it does not support the hypothesis, it does not provide evidence to reject it.

Figure 15. Expression of mRNA for YCL047C During the Diauxic Shift. This image shows the results of a study detailing yeast mRNA expression during the diauxic shift. This image illustrates that YCL047C was neither repressed, nor induced to a great extent. This finding calls my previous hypothesis – that YCL047C is involved in metabolic processes – into question. Image from: DeRisi, et al. Permission pending.
The twenty genes listed in the next figure, represent genes with a Pearson correlation of >0.8, that is, genes which were similarly expressed to YCL047C in the experiment in which yeast mRNA expression was monitored during the diauxic shift.
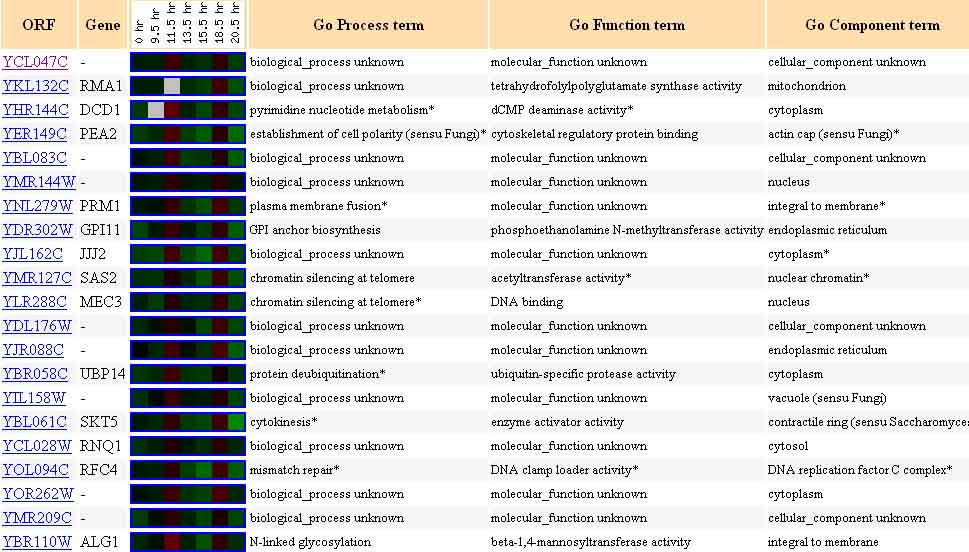
Figure 16. Twenty Genes Expressed Similarly to YCL047C During the Diauxic Shift. The genes listed above each have a Pearson correlation >0.8, meaning they are similarly expressed to YCL047C in the experiment in which yeast mRNA expression was monitored during a diauxic shift. Image from: DeRisi, et al. Permission pending.
Guilt-by-association would indicate that YCL047C could play a genetic role similar to, or complementary to, any of these genes. Among the possibilities are tetrahydrofolylpolyglutamate synthase activity, dCMP deaminase activity, cytoskeletal regulatory protein binding, acetyltransferase activity, beta-1,4-mannosyltransferase activity, etc.
The aforementioned queries resulted in three sets of genes which produce similar expression patterns to that of YCL047C, in experiments which induced a greater than three-fold change in YCL047C expression. However, it would be impossible to determine the most likely correlation from among these three groups without computer assistance. For this, we use the SGD Gene Ontology Term Finder (http://db.yeastgenome.org/cgi-bin/SGD/GO/goTermFinder).
The 36 genes, of known function, found to display similar expression patterns in the previous four experiments were all entered into this page. The results are as follows:
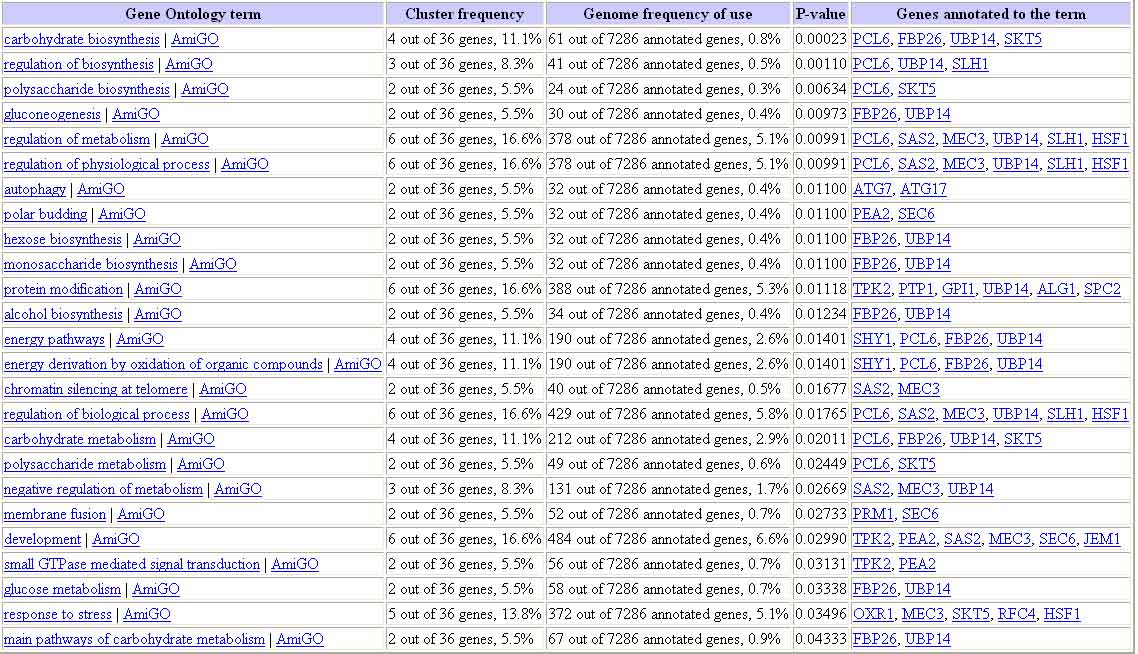
Figure 17. Results of Gene Ontology Term Finder Query for Genes with Similar Expression to YCL047C. The results of this query show that many of the genes expressed with YCL047C are involved in biosynthesis (metabolism), particularly anabolic carbohydrate metabolism. Image from: http://db.yeastgenome.org/cgi-bin/SGD/GO/goTermFinder. Permission pending.
The image above shows that many of the genes expressed with YCL047C are involved in biosynthesis (metabolism), particularly anabolic carbohydrate metabolism. In addition, it is important to note the P-values for the first few hits. These values (0.00023, etc.) indicate that these results are not likely due to random chance. This result is consistent with my original hypothesis.
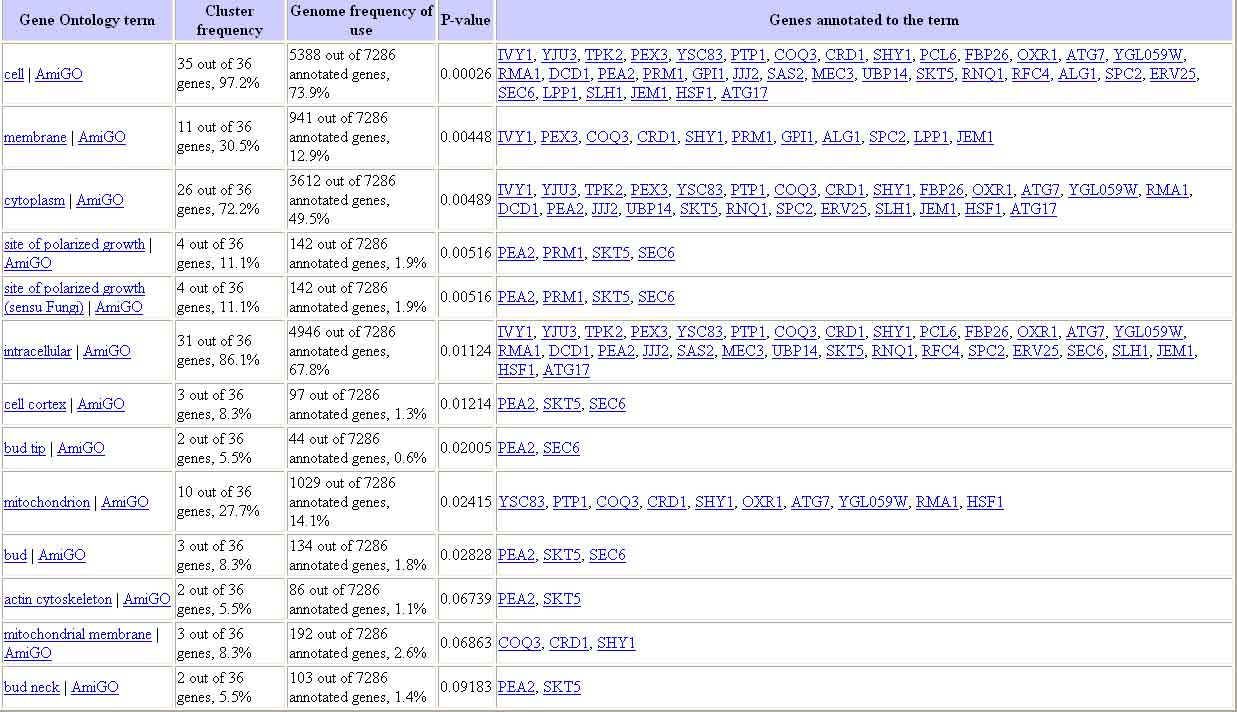
Figure 18. Results of Gene Ontology Term Finder Query for Genes with Similar Expression to YCL047C. The results of this query show that many of the genes expressed with YCL047C are expressed in the membrane and the cytoplasm. Image from: http://db.yeastgenome.org/cgi-bin/SGD/GO/goTermFinder. Permission pending.
The image above shows that many of the genes expressed with YCL047C are expressed in the membrane and the cytoplasm; however this result is not conclusive, as all P-values are very similar.
Revised Prediction of YCL047C Function
Given the new information attained from expression analysis, I would like to revise my previous hypothesis. Based on the new information, I would predict that YCL047C is a functional protein involved in biosynthesis (metabolism) of anabolic carbohydrates. Since no conclusive evidence was presented contrary to the Kyte-Doolittle hydropathy plot, I will stick with my original hypothesis that YCL047C codes for a transmembrane protein.
References
DeRisi JL, Iyer VR, Brown PO. Exploring the metabolic and genetic control of gene expression on a genomic scale. Science 1997; 278(5338): 680-6 .
Dolinski K, et al. 2004. Saccharomyces Genome Database. <http://www.yeastgenome.org>. Accessed 2004 Oct 21.
Gasch AP, et al. Genomic expression programs in the response of yeast cells to environmental changes. Mol Bio Cell 2000; 11(12): 4241-57.
Gene Ontology Software Group. 2003. Gene Ontology Database. <http://www.godatabase.org/dev/database>. Accessed 2004 Oct 21.
Travers KJ, et al. Functional and genomic analyses reveal an essential coordination between the unfolded protein response and ER-associated degradation. Cell 2000; 101(3): 249-58.
Yoshimoto H, et al. Genome-wide analysis of gene expression regulated by the calcineurin/Crz1p signaling pathway in Saccharomyces cerevisiae. J Bio Chem 2002; 277(34): 31079-88.