This web page was produced as an assignment for an undergraduate course at Davidson College.
My Favorite Yeast Expressions:
Expression Data about MCA1 and YOR205C
Introduction
Although data from sequence analysis of the genes of S. cerevisiae can provide some information regarding a gene’s function, data for yeast gene expression under various conditions provide a wealth of data to use when determining a gene’s function. Microarray analysis allows the detection of fold-scale inductions or repressions in all of the yeast genes at once under a certain set of conditions. This information can provide many different types of information as well. First, the microarray information can show which environmental stresses cause a particular gene to be induced or repressed. In addition, genes can be compared with each other to determine clusters of genes that are induced or repressed under a given set of stimuli. In this way, not only can countless data sets be compiled about the functions of known genes, but the expression patterns of these known genes can be clustered with that of unknown genes to help determine the function of genes that have not been annotated yet. Microarrays provide a powerful tool at studying qualitative gene expressions among different environmental factors and across whole genomes.
In this website, gene expression data from the Saccharomyces Genome Database (www.yeastgenome.org) can help further characterize a known gene, named MCA1. In combination with sequence analysis data, this expression information can also test and either refute or provide evidence for hypotheses concerning the function of ORF YOR205C, a non-annotated gene.
MCA1 Expression Data
Previous analyses of MCA1 determined that the gene's protein product functioned as an initiator caspase, or a molecule toward the beginning of the signaling process for apoptosis in yeast cells. Information regarding sequence data validated this finding by comparing it to caspases in other yeast strains as well as other species. However, expression comparison data can provide even more information about this gene's function and relation to other biological processes.
One of the most effective ways of characterizing a gene by its expression characteristics is to compare gene expression levels under certain conditions to the expression levels of other genes. If a gene is induced or repressed under the same conditions as another, there is a probability that the two genes respond to the same stimuli, which could possibly mean that they function in similar ways.
Of course, when comparing MCA1 and YOR205C with other gene expressions, correlation does not necessarily imply causation; simply because two genes are expressed in the same way under a subset of conditions does not prove that they are involved in the same process. If this was true, MCA1 would be involved in not only apoptosis, but telomere maintenance, the MAP kinase kinase signaling pathway, initiation of sporulation, and cell-cycle regulation. The probability that the functions of MCA1 include all of the above is very small, but analysis of these expression databases show correlations between genes that could link them, either in the broad sense of a cellular process or the narrow sense of having similar functions. Therefore, these microarray comparison data, along with data about gene function and sequence data, can help determine the function of the non-annotated gene YOR205C.
|
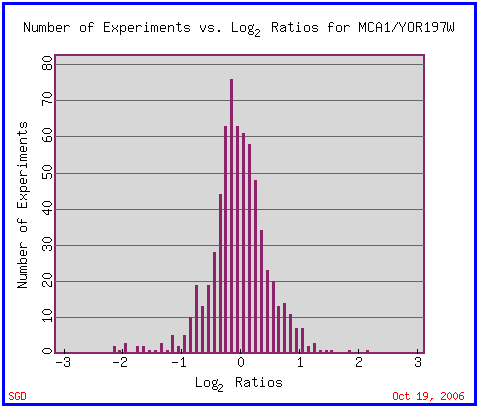
| Figure 1. Overall expression profile of MCA1. Permission pending from www.yeastgenome.org. |
This histogram displays the overall expression data for MCA1. Although it provides a comprehensive picture about the overall expression ratios of MCA1 and helps illuminate the fact that no environmental condition has yet to experimentally produce induction or repression of the gene above 3-fold, it does not provide much specific information needed to characterize MCA1 and compare it to other genes with related or distinct processes and functions. However, this graph is a good starting point - it shows that most of the gene expression data gathered on MCA1 display that it exhibits no change or slight represssion under experimental conditions. This data can be puzzling if the function of the MCA1 gene - an initiator caspase - is to induce programmed cell death under conditions of nutrient deprivation, environmental stress, or interaction with harmful compounds. Two conclusions can be drawn: either many of the apoptosis-inducing stresses have not been tested yet in this database, or the initiator caspase does not need to be expressed to a great extent to begin apoptosis. It seems to be induced in some circumstances; it is possible that the circumstances that begin apoptosis are the ones in which the MCA1 gene is induced.
Comparative Expression Patterns:
Expression in response to Histone Depletion
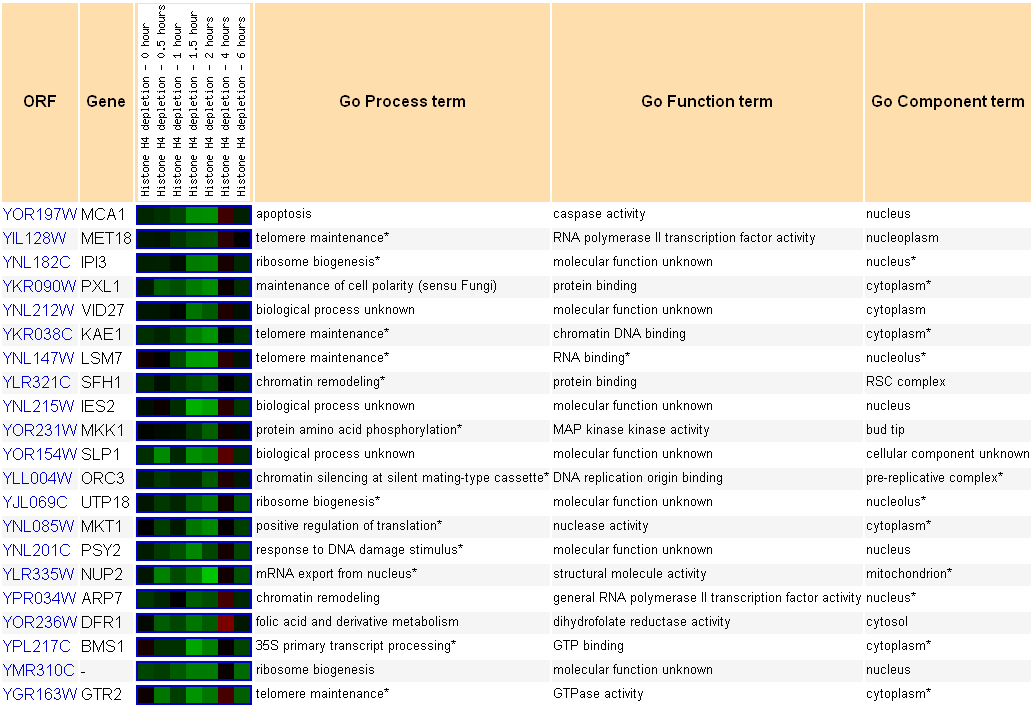 |
| Figure 2. MCA1 expression comparison with genes that are expressed in similar ways following histone depletion. Permission pending from www.yeastgenome.org. |
This figure shows the genes that are expressed in a similar fashion to MCA1 when the yeast cell experiences histone depletion. According to the first row in the table, MCA1 exhibits very little change in gene expression until 1 hour following depletion, when increasing amounts of repression occur in the yeast cell. As the cell presumably adapts to this stressor, it returns the expression of MCA1 to normal levels, as seen by the last two expression boxes on the left.
The subsequent rows correspond to genes that have the same types of expression under conditions of histone depletion. According to the GO Process terms, MCA1 is repressed at the same times as multiple genes involved in telomere maintenance, including a DNA repair regulator (MET18), a glycoprotease that binds chromatin (KAE1), and an RNA processing gene (LSM7). This points toward a link between genes that maintain the length of telomeres and initiators of apoptosis, but why?
According to some cancer research, inhibition of telomerase, a gene that is involved in maintenance of the telomeres, causes both telomere shortening and initiation of apoptosis in human cancer cells (Zhang et al., 1999). According to the paper, “It appears that telomerase inhibition in cells with short telomeres lead to chromosomal damage, which in turn trigger apoptotic cell death” (Zhang et al., 1999). Therefore, it is possible that yeast cells also co-express apoptosis initiators with telomere maintenance genes, since their processes are interlinked. In addition, the environmental stress of histone depletion could cause increased DNA damage, which would force the cell to work harder to fix DNA damages in known genes. To conserve energy and protect the genes it needs to survive, the yeast cell could repress telomere maintenance genes, transferring energy over to processes that repair known genes. However, this repression would cause telomeres to degrade, which could cause initiation of apoptosis and un-needed cell death. Therefore, the repression of apoptosis markers in conjunction with repression of telomere maintenance genes could reflect the cell’s need to prevent suicidal measures while still maintaining the correct sequence of important genes.
In addition to this linkage with telomere maintenance genes, the gene expression comparison page also shows genes that are directly involved in the apoptosis pathway. Expressed similarly to MCA1 is a gene with a GO Function term of MAP kinase kinase activity, MKK1. MAP kinase kinase genes are involved in a second-messenger system within a cell that controls a variety of cellular processes (cite wikipedia, or find another). This particular gene (shown here) is a MAP kinase kinase “involved in [a] protein kinase C signaling pathway that controls cell integrity” (Cherry et al., 1997). Since this protein is involved with cellular integrity, it probably relates to the process of apoptosis as well, which alters the integrity of a cell. The linkage in expression between these two genes provides evidence that they are both involved in apoptosis.
Finally, this figure also includes genes, such as IES2 and SLP1, that have no known GO terms for process or function. Because these genes are regulated alongside apoptosis pathway and telomere maintenance genes in response to histone depletion, it is possible that these two genes are related to one of these two processes. Further study would be needed to implicate either gene in these processes, but this data provides initial evidence that they are involved in the maintenance of the ends of chromosomes or in the pathway of controlled cell death. This technique of comparing unknown genes with known genes that have related expression profiles under the same environmental stresses can be used to further predict the function and nature of the unknown gene, further below on this website.
Expression during sporulation
Sporulation, according to Krishnamoorthy et al., is a process wherein the cell duplicates its genome then divides into four haploid spores under conditions of “nutrient deprivation, including nitrogen starvation, growth in nonfermentable carbon sources, or the absence of glucose” (Krishnamoorthy et al., 2006). This process caused a 2-fold repression in MCA1 over a 10-hour period of time, as seen in the expression graph below:
 |
| Figure 3. Expression Graph for MCA1 in response to sporulation, showing a repression of the gene over the course of 12 hours. Permission pending from www.yeastgenome.org. |
A repression in the MCA1 gene during sporulation could be a product of the changes that occur in a cell during the process of sporulation. During this process, the cell would presumably undergo drastic gene expression changes involving multiple signaling pathways. Many of these pathways that drastically alter genes could cause pathways that activate apoptosis mechanisms to be induced, necessitating the repression of apoptotic genes in order to allow sporulation to occur. Alternatively, the gene expression profile during sporulation could change so dramatically that it causes the cell to be undergo an immense amount of of stress, which could begin initiator caspases and apoptosis in response to that cellular stress. Either way, sporulation would be unable to occur if a cell is undergoing apoptosis at the same time, which would kill the cell; therefore, apoptosis is repressed at the same time to ensure survival of the cell during sporulation.
Expression during exposure to different Zinc concentrations
Although the MCA1 gene is repressed during many cellular processes, it is also induced in others. In environments when gene expression of initiator caspases are induced, presumably the cell could begin apoptosis; therefore, this gene might be induced under periods of extreme stress or damage to cellular structure.
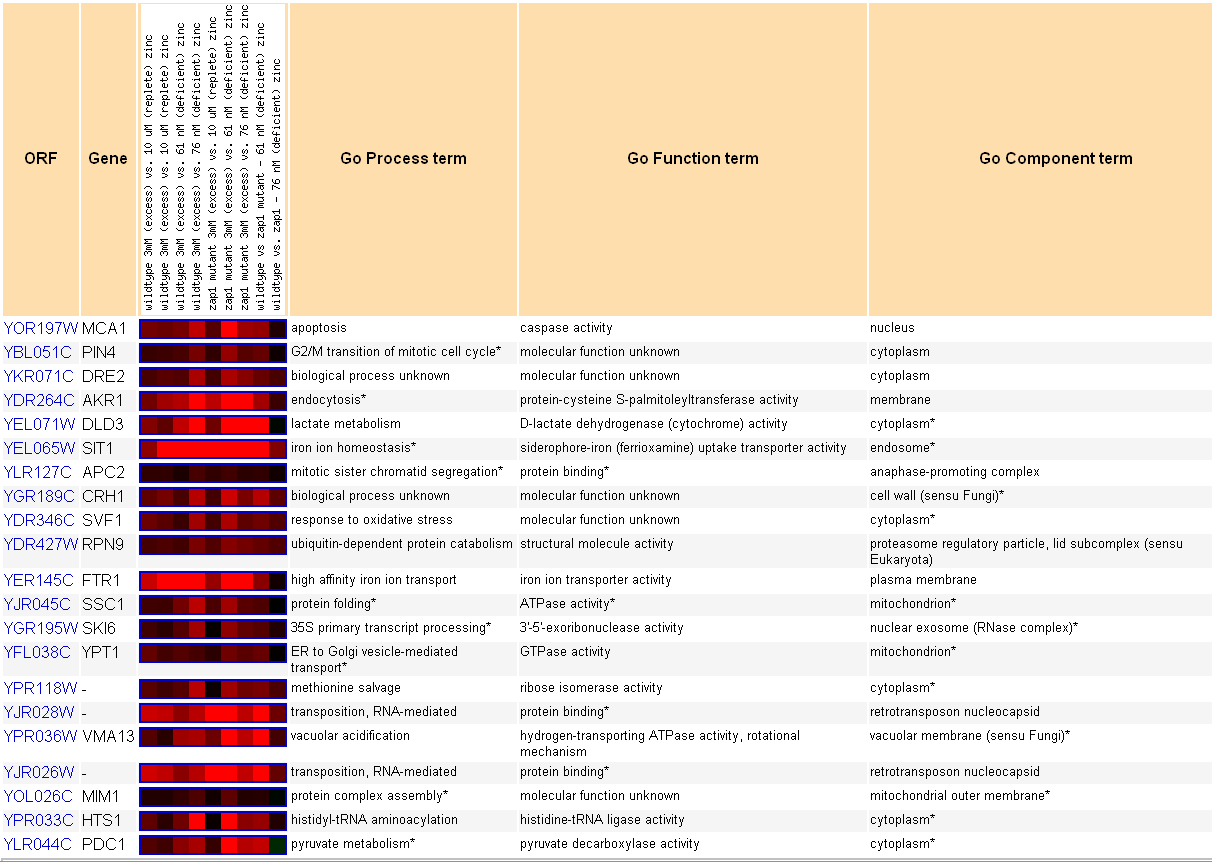 |
| Figure 4. MCA1 expression comparison with genes that are expressed in similar ways following exposure to different concentrations of zinc, shown at the top of the figure. Permission pending from www.yeastgenome.org. |
According to this figure, MCA1 is expressed under concentrations of elevated zinc. The two brightest-red squares in the figure for MCA1 show that the gene is induced when comparing yeast cell with excess zinc (3mM) to cells with diminished quantities of zinc.
The other genes that are induced alongside MCA1 are much different from the genes that have been shown in other environmental stresses, including histone depletion. The genes that are induced alongside MCA1 under excess zinc include genes that respond to oxidative stress, genes that control iron homeostasis, metabolic genes, and iron transporter genes. At first, there seems to be no pattern between all of these genes; however, many of them could be expressed alongside MCA1 for a variety of reasons. Genes that control iron homeostasis and iron transport could be induced under conditions of excess zinc because the cell could respond to an imbalance of one metal ion by changing the intracellular concentration of another, thereby maintaining metal homeostasis within the cell. In addition, the MCA1 gene is expressed alongside genes that respond to oxidative stress; both of these genes would be induced in this case if excess zinc proves harmful to a cell, causing both a stress response and initiation of cell death under fatal excess concentrations of zinc.Expression during exposure to arsenic
Apoptosis, as seen above, is induced in situations of damage to the cell, causing the cell to begin a process of programmed cell death in response to these environmental stresses. Arsenic exposure would seem like an ideal test of this hypothesis; since it is toxic to the yeast cell, MCA1 would be expected to be induced in response to arsenic.
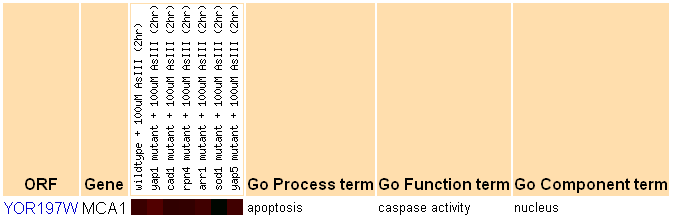 |
| Figure 5. MCA1 expression in response to arsenic exposure of various concentrations. Red squares represent inductions in gene expression. Permission pending from www.yeastgenome.org. |
According to this figure, MCA1 is induced in response to exposure to arsenic; this makes sense if arsenic is toxic to yeast cells. Sensing arsenic concentrations increase could cause initiation of apoptosis if the concentrations would eventually kill the cell; by initiating programmed cell death the yeast could save resources for cells without arsenic poisoning, thereby promoting the health of the yeast colony.
Conclusions
These gene expression data, in the form of expression profiles, graphs, and comparative expression tables, help characterize the processes that MCA1 is involved in to a fuller extent than sequencee and GO data. Gene analysis already determined that the gene was involved during apoptosis; expression data helped confirm that other genes in the apoptotic pathway were expressed alongside MCA1. These data also helped determine correlations between MCA1 expression and other yeast cellular pathways, including telomere maintainence, and allowed the hypothesis of a link between repression of apoptosis during periods of histone depletion. These same analysis tools can help determine characteristics of known genes as well as provide theories of the functions of non-annotated genes, such as YOR205C.
YOR205C Expression Data
On a previous site, sequence comparison analysis showed that YOR205C expressed sequence homology with an RNA helicase, leading to the hypothesis that the gene was involved in RNA processing and manipulation of transcripts inside the mitochondrion. The sequence data also helped hypothesize that the protein was GTP-dependent; however, it is possible that the protein product simply has a nucleotide binding site and may not necessarily be dependent on GTP. Comparison of this sequence data with expression data, below, will either support, refute, or possibly add to this hypothesis.
Response to a variety of environmental stressors
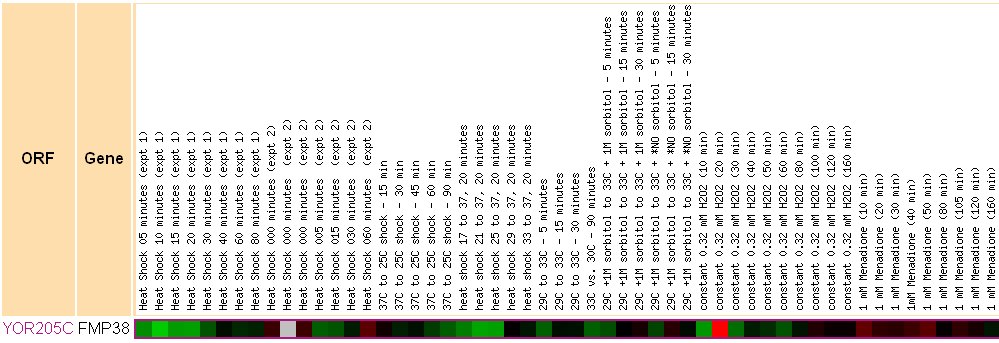 |
| Figure 6. Selected YOR205C expression data in response to a variety of environmental conditions, shown at the top of the graph. Red squares represent fold-inductions in gene expression; Green squares represent fold-repressions in gene expression. Permission pending from www.yeastgenome.org. |
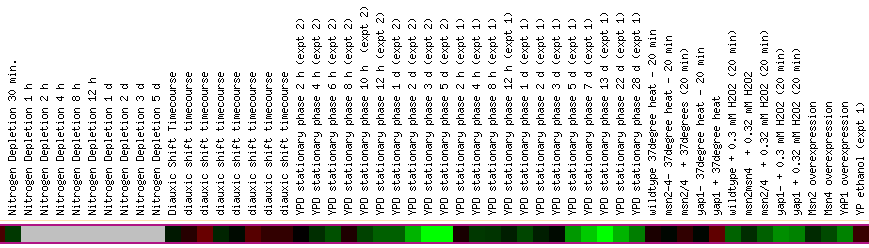 |
| Figure 7. Continuation of Figure 6 - YOR205C expression data in response to a variety of environmental conditions. Rows correspond to headings in Figure 6. Permission pending from www.yeastgenome.org. |
The data above is a survey of expression effects due to a variety of environmental stressors. The figure includes data from gene induction and repression due to heat shock, oxidative stress, chemical stress, nitrogen depletion, and other possible environmental effects that could affect yeast gene expression. By determining which stress responses the unknown gene responds to, the figure could provide a clue into what processes YOR205C is involved in.
According to the figure, induction of YOR205C occurs in rare cases, including some points in the diauxic shift, exposure to menadione, a vitamin precursor toxic at high concentrations ("Menadione"), and a prominent induction after 20 minutes of oxidative stress. These exposure studies show that this gene is induced in a variety of circumstances, including situations of stress in the cell.
YOR205C is also repressed under certain environmental stressors. The Figure shows that the most prominent repressions of this gene occur during some periods of heat shock (although the gene did not respond in all circumstances), as well as during the YPD stationary phase. Although this data gives one an idea of which processes cause expression of YOR205C to change, they are less fruitful in finding information about the gene’s process, since it seems to be induced under some conditions of stress and repressed under other conditions. This rules out the idea that the gene is universally expressed in response to any stress; however, it goes no further to help narrow down the gene’s function. To do this, the gene expression data for YOR205C must be compared to expressions for other genes under similar stresses.
Expression response to exposure to alpha-factor
According to the Expression Connection information for YOR205C, the ORF is expressed in a very distinct way in an experiment by Roberts et al., which measured gene expression levels in response to alpha-factor. This alpha-factor, according to a 1983 paper in Cell, is a short peptide involved in mating cues – in essence, it is a pheromone (Julius et al., 1983).
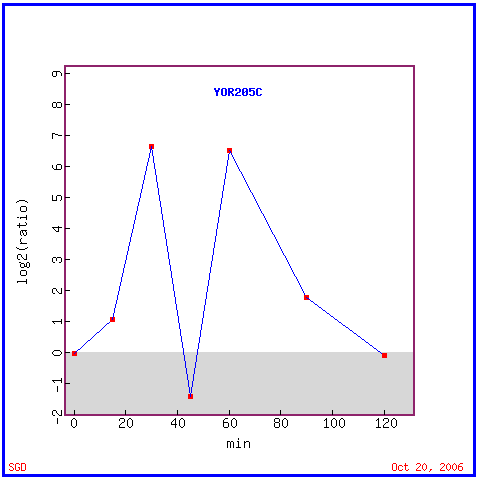 |
| Figure 8. YOR205C expression graph charting induction and repression in response to alpha factor over time. Permission pending from www.yeastgenome.org. |
According to the above data, YOR205C is induced for the first thirty minutes of response to alpha-factor, but then the gene becomes quickly repressed for a short period of time at 45 minutes post-exposure. After this point, the expression levels rise again until the gene is again induced almost 7-fold at 1 hour. This expression pattern seems out of the ordinary, especially when comparing its expression to many of the expression levels in the previous figure concerning environmental stress response. A comparison of this expression to expression of other genes can help determine whether this gene is expressed in concert with another pathway.
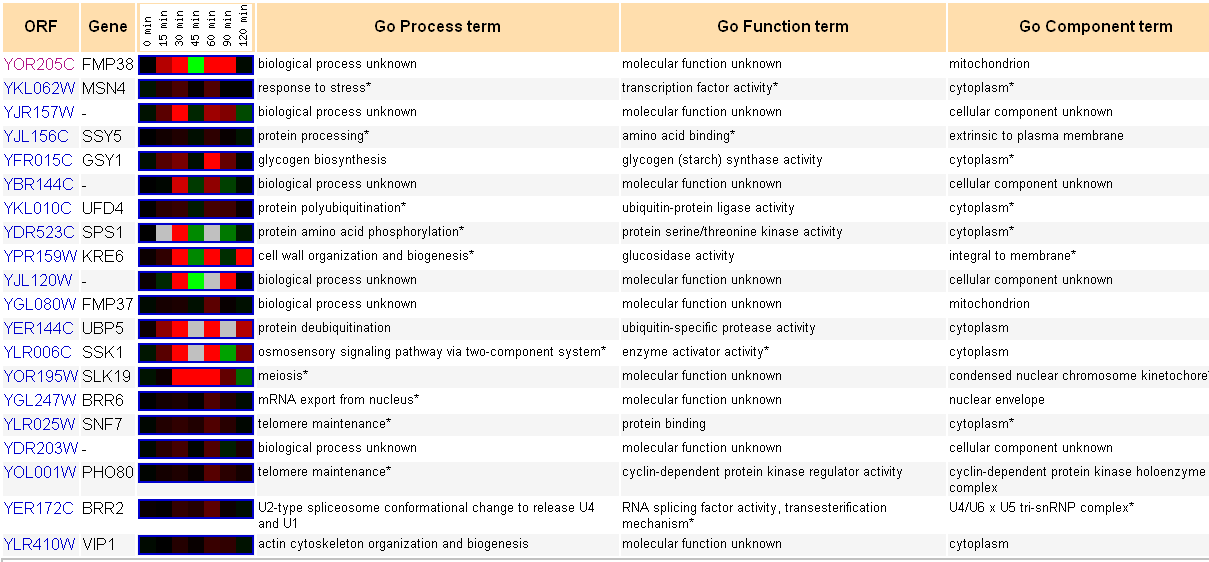 |
| Figure 9. YOR205C expression comparison with genes expressed in similar manner during response to alpha factor over time. Permission pending from www.yeastgenome.org. |
This expression data compares YOR205C expression response to exposure to alpha-factor to expression levels in other genes. Although none of these expression patterns seem alike at first glance, the site reports that the Pearson correlation for each gene was >0.8, showing that each of these genes is correlated strongly with expression for YOR205C. The genes on this page include many genes whose biological process and molecular functions are unknown; however, the known genes seem to either interact with proteins (such as SSY5, SPS1, and UBP5), deal with metabolism of other compounds (such as GSY1, UFD4, and KRE6), or are transcription factors. Although these are all three distinct processes, they do not seem to be related to one another; therefore, these data does not seem to bring us any closer to determining a function for YOR205C.
Expression during sporulation
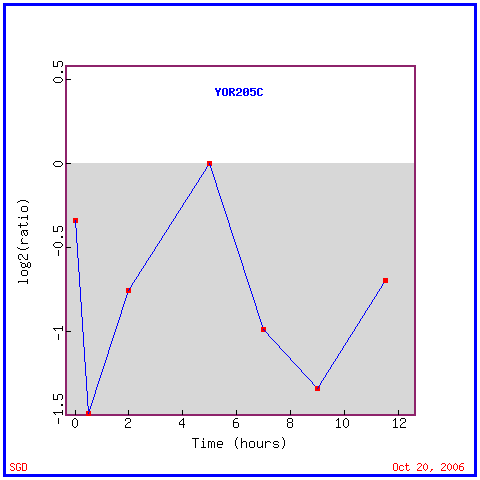 |
| Figure 10. YOR205C expression graph charting induction and repression in response to sporulation. Permission pending from www.yeastgenome.org. |
Another significant expression pattern for YOR205C involves expression during sporulation. According to the data above, the gene is repressed 1.5-fold at 30 minutes following initiation of sporulation and again at 9 hours following sporulation. Although this data could show that YOR205C is repressed during development of spores as well as during spore maturity, it is unknown whether the samples had achieved sporulation maturity at 9h and therefore it is impossible to draw this conclusion as of yet.
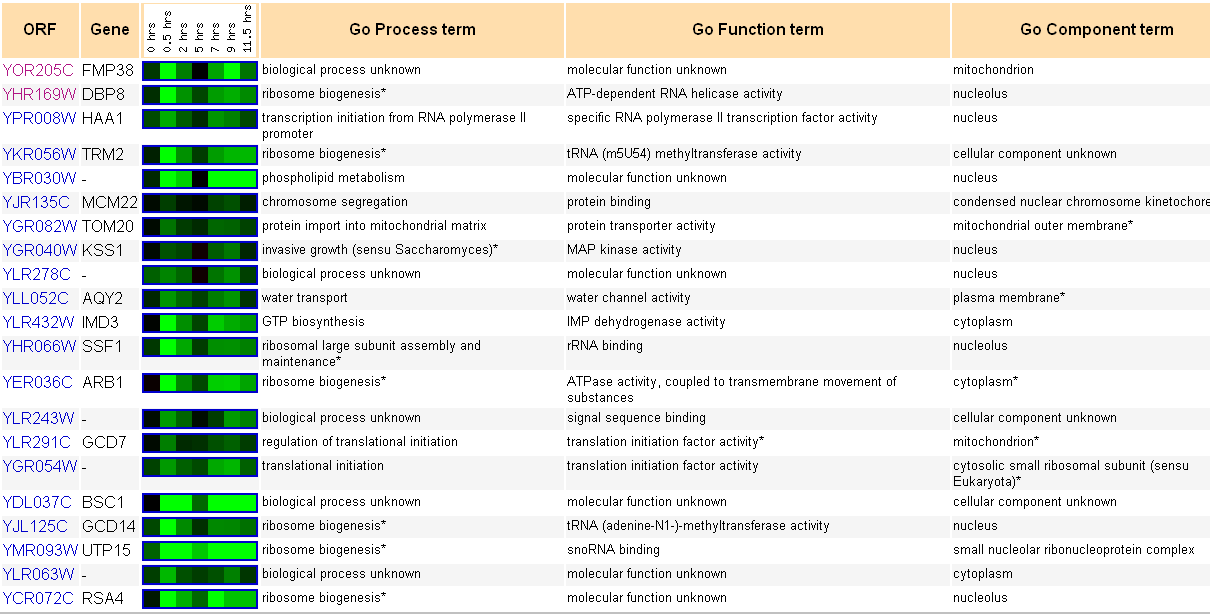 |
| Figure 11. YOR205C expression comparison with genes expressed in similar manner during response to sporulation. Permission pending from www.yeastgenome.org. |
Comparison of genes that are regulated alongside YOR205C during sporulation provide interesting data. The first hit in a search for related expressions is DBP8, a gene with a protein product that has “ATP-dependent RNA helicase activity” (see Fig. 11). This gene is involved in ribosome biogenesis according to its GO process term. Sequence analysis of YOR205C also predicted that the gene could possibly produce an RNA helicase molecule with nucleotide binding sites (website located here); these new data give support to this theory. However, there are other expressions in the above figure to examine. For example, the next hit is for HAA1, a transcription factor, while other genes in the list include genes with protein processing activities (MCM22 and TOM20) as well as many other varied functions. It is possible that any of these gene expressions correlate to the expression data for YOR205C because of related functions; however, more weight should be given to the link between the gene in question and DBP8 given the sequence analysis performed earlier.
Another interesting part of this expression comparison is the similarity of GO process terms among many of the genes with similar expression patterns in response to sporulation. Six of the top-20 genes correlated with YOR205C involve ribosome biogenesis, or the production of ribosomes by an organism. Further study into the regulatory patterns of ribosome biogenesis shows that the regulatory mechanisms for this pathway are extensive. In fact, Wade, Umbarger, and McAlear reported in 2006 that the “rRNA biosynthesis regulon contains over 200 genes” (Wade et al., 2006). Production of ribosomes, therefore, requires an immense amount of genes and gene regulation; it is possible that since so many of the genes that are expressed alongside YOR205C during sporulation belong to that regulon, that YOR205C is also regulated to some extent by ribsome biogenesis regulators. This finding would implicate YOR205C in the process of production of new ribosomes by the yeast cell.
Conclusions
The microarray data from SGD present a wealth of information about gene expression. Data about YOR205C, even if the gene has not been annotated, is immense. Although some of the expression data show that YOR205C is expressed in accordance with many biological processes, including protein interactions, transcription factors, and metabolism, correlation with expression of these processes and genes within them does not automatically conclude that the gene interacts with all of these biological processes and perfoms all of these molecular functions. It is possible, however, that the YOR205C gene is involved with one or more of these processes. Both the data presented on sporulation and the sequence analysis presented here give support that the gene is involved in RNA processing, since in both cases the gene is linked with an RNA helicase either by sequence homology or gene expression data. Therefore, this analysis gives weight to the hypothesis that YOR205C functions as an RNA helicase. However, the gene expression data also expands this hypothesis to propose a biological process that involves YOR205C. Because the gene was expressed alongside many ribosome biogenesis genes in the case of sporulation, the expression data present the theory that YOR205C is involved in the production of ribosomes. Although it exists in the mitochondrion and therefore might not be needed for ribosome biogenesis in its location, the mitochondrial genome of yeast cells includes genes that transcribe protein products, necessitating the production of ribosomes to translate those mRNA into proteins. It is possible, according to these data above, that YOR205C is an RNA helicase involved in the production of ribosomes in the yeast mitochondria.
References
Cherry JM, Ball C, Weng S, Juvik G, Schmidt R, Adler C, Dunn B, Dwight S, Riles L, Mortimer RK, Botstein D. 1997. Genetic and physical maps of Saccharomyces cerevisiae. Nature 387(6632 Suppl):67-73.
Julius, D. et al. 1983 March. Yeast alpha factor is processed from a larger precursor polypeptide: the essential role of a membrane-bound dipeptidyl aminopeptidase. Cell 32(3):839-52. Abstract accessed at <http://www.ncbi.nlm.nih.gov/entrez/query.fcgi?cmd=Retrieve&db=PubMed&list_uids=6339075&dopt=Abstract>. Accessed 20 October 2006.
Krishnamoorthy, Thanuja et al. 2006. Phosphorylation of histone H4 Ser1 regulates sporulation in yeast and is conserved in fly and mouse spermatogenesis. Genes and Development 20:2580-2592.
Updated 13 September 2006. Menadione. <http://en.wikipedia.org/wiki/Menadione>. Accessed 19 October 2006.
Wade CH et al. 2006. The budding yeast rRNA and ribosome biosynthesis (RRB) regulon contains over 200 genes. 23(4):293-306. Abstract accessed at <http://www.ncbi.nlm.nih.gov/entrez/query.fcgi?cmd=Retrieve&db=PubMed&dopt=Abstract&list_uids=16544271>.
Zhang, Xiaoling et al. 1999 September 15. Telomere shortening and apoptosis in telomerase-inhibited human tumor cells. Genes Development 13(18): 2388-2399.
Questions? Comments? Email brhenschen "at" davidson.edu
© 2006 Department of Biology, Davidson College, Davidson, NC 28035