Introduction
Berger et al. (2011) sequenced, performed arrays on, conducted ChIP-seq analysis on, and imaged flourescence in situ hybridization for seven prostate tumor cell lines: PR-0508, PR-0581, PR-1701, PR-1783, PR-2832, PR-3037, PR-3043. The mutations, translocations, deletions and rearrangements they found across transcription regulating, tumor suppressing, and growth regulating genes varied across tumor cell lines. The complexity and scope of the mutations involved in oncogenesis of human primary prostate cells is now clear.
Mutations
There was a median of 3,866 putative somatic base mutations per tumor, a mean mutation frequency per megabase of .9, and a median of 20 non-synonymous mutations per sample within protein coding genes. SPTA1, SPOP mutations exceeded Q=0.055, [CHD1, CHD5, HDAC9 (3/7 tumor cell lines)]. Q is a measure of the expected background mutation rate in these tumors. KEGG, PRKCI, DICER and members of the HSP-1 stress complex (3/7 tumor cell lines) also contained mutations.
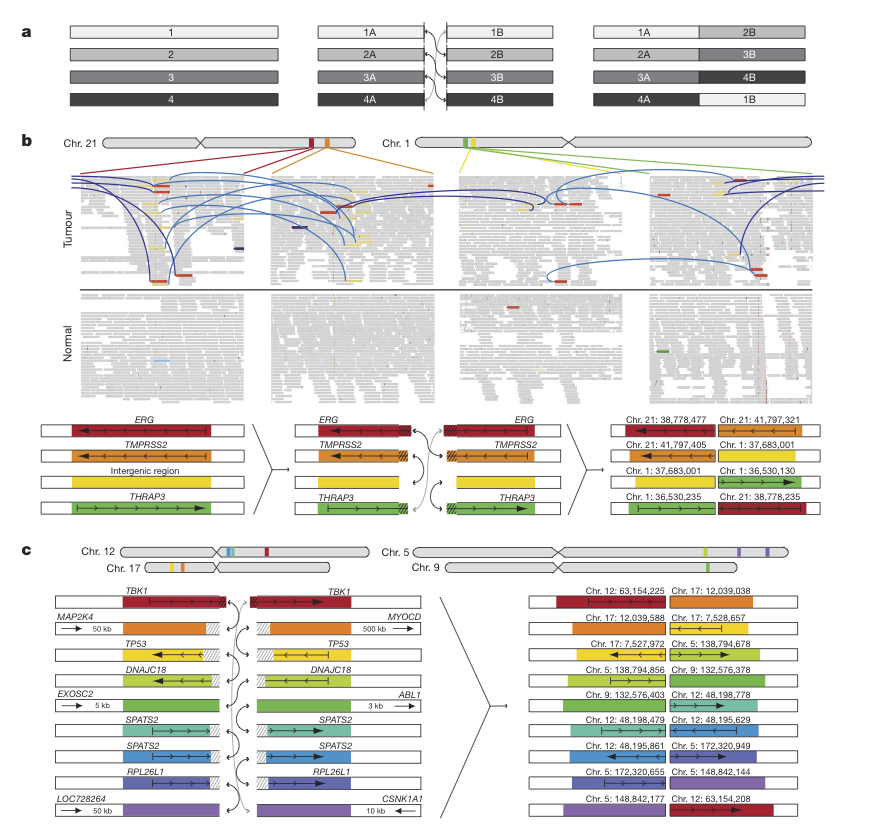
Table 1
The table indicates that prostate tumor cell lines PR-0581, PR-1701, PR-2832 harbor the TMPRSS-ERG gene fusion. All tumors except for PR-1701 and PR-3043 have more tumor bases sequenced than normal bases sequenced. PR-0581, at the extreme, has 1.62X more tumor bases sequenced than normal bases. PR-3027 has the most point mutations (5865) and most non-silent coding mutations (43) while PR-3043 has the least point mutations (3192) and PR-2832 the least non-silent coding mutations (13). PR-1783 has the most number of rearrangements (213) and PR-3043 the least (43).
Rearrangements
There was a median of 90 rearrangements per genome and these were reexamined by multiplexed PCR followed by massively parallel sequencing, validating 78% of events.ZNF407 CHD1, and PTEN, disrupted by rearrangements, also contained non-synonymous mutations.
CHD1 contained a splice site mutation in prostate tumor PR-1701 and intragenic break points in PR-0508 and PR-1783.
While 2-3 bp overlaps are common in breast cancer fusion junctions, these overlaps are rarer in prostate cancer samples. The prostate sequences more commonly consist of a precise join mapped to base pair resolution in 88% of cases. Mechanisms for these rearrangements may differ between cancer types.
The prostate sequences exhibited a balance of breaking and rejoining. Chimeric chromosomes were observed, formed by both inter and intra chromosome breakage and rejoining events.
Breakpoints independent of TMPRSS2-ERG may interrupt other genes in their vicinity such as TBK1, TP53, MAP2K4, and ABL1 (proto-oncogene) to fuel prostate tumor growth. This is interesting because tumorigenesis may be driven by the interruption or dysregulation of many genes. This brings prostate cancer to the genomic stage: we are not looking at a one gene-one phenotype disorder.
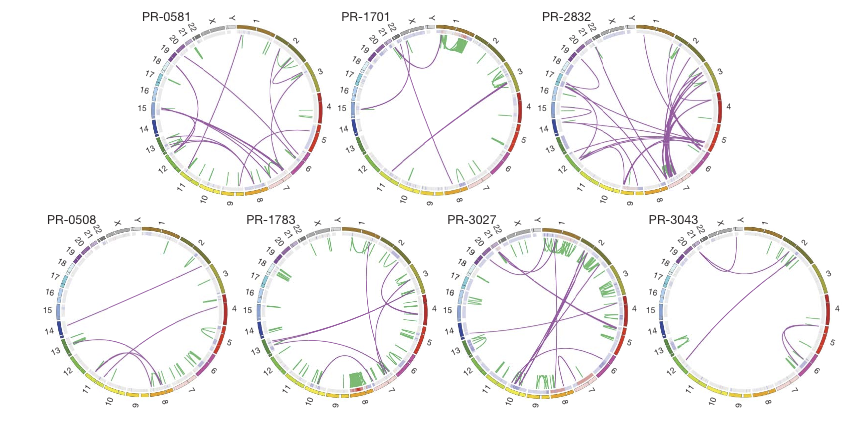
Figure 1
The top three tumors have the TMPRSS2-ERG gene fusion while the bottom three do not. The outer ring shows chromosomal position and the inner ring shows copy number. PR-2832 has the most interchromosomal rearrangements, indicated by the swooping purple lines, many between chromosome 3 and 7. PR-1783 has many intrachromosomal rearrangements, especially within chromosome 8, which also shows high copy number. In 4/7 tumors, we see intrachromosomal recombination from chromosome 7.

Figure 2
Section a shows the balance between breakage and rejoining events in which no genetic material was lost.
Section b shows rearrangement for prostate tumor PR-1701 between four loci: two on chromosome 21 and two on chromosome 1. These recombinations produce the TMPRSS2-ERG gene fusion.
The bars represent overlapping reads on a reference genome. Colored bars are discordant. The thick gene-based bars below show the results of rearrangement.
The bottom bars in section c graphically depicts rearrangements of 9 loci between four chromosomes. For two of the newly combined loci, orientation of the two combined pieces previously coding for functional genes differ. At other locations we see breakages kilobases away from known genes, which may affect regulation of those genes and lead to tumorigenesis.
Rearrangements and Epigenetic Marks
Androgen signaling may induce colocalization of TMPRSS2 and ERG allowing breaks to form TMPRSS2-ERG gene fusion. Evidence for this lies in the over 200 bp duplications at these breakpoints. In order to examine differences in transcriptional patterns or chromatin marks, Berger et al. used chromatin immunoprecipitation and massively parallel sequencing to examine the TMPRSS2-ERG fusion containing prostate tumor strain VCaP. Chromosomal rearrangements from PR-2832 corresponded to marks of open chromatin in VCaP. Also, androgen receptors (AR) and ERG binding sites (regulator of differentiation) were statistically correlated, indicating overlap. However, ETS fusion negative events were inversely correlated with AR, ERG binding sites, and open chromatin, indicating the possibility of rearrangement events in closed chromatin in prostate tumor cells. Patterns of open chromatin, AR, and ERG binding sites were correlated between breast tumor cells and prostate tumor cells but not between melanoma-lung cancer cells and prostate tumor cells. These correlations suggest that hormone-regulated cell types and tumors have more similar tumorigenesis-inducing mechanisms.Berger et al. observed genes CSMD3 and CADM2, in which high frequency of rearrangements were statistically significant. CADM2, a cell adhesion involved molecule, may have tumor suppression properties. Fluorescence in situ hybridization (fluorescent oligonucleotide probe) confirmed the existence of CADM2 aberrations in 6/90 samples.
Also, in two samples, rearrangements in tumor suppressor PTEN were observed. Researchers saw heterozygous deletions (FISH) and a dinucleotide insertion in one tumor. They also determined the existence of rearrangements in PTEN related protein MAGI2. Four out of seven tumors had rearrangements in either PTEN or MAGI2. The MAGI2 rearrangements were balanced while the PTEN were not (net loss of information). The researchers used high-density SNP arrays to discover somatic deletions in PTEN but no copy number changes in MAGI2.
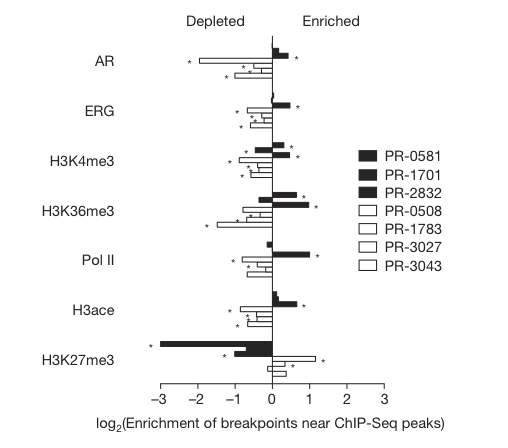
Figure 3
Figure 3 depicts the average higher enrichment of breakpoints from TMPRSS2-ERG positive prostate tumor cell lines (black bars) and the lower enrichment/depletion of breakpoints in ETS fusion negative tumors in areas of high transcription. In EST fusion negative lines there is enrichment of breakpoints near areas of closed chromatin.
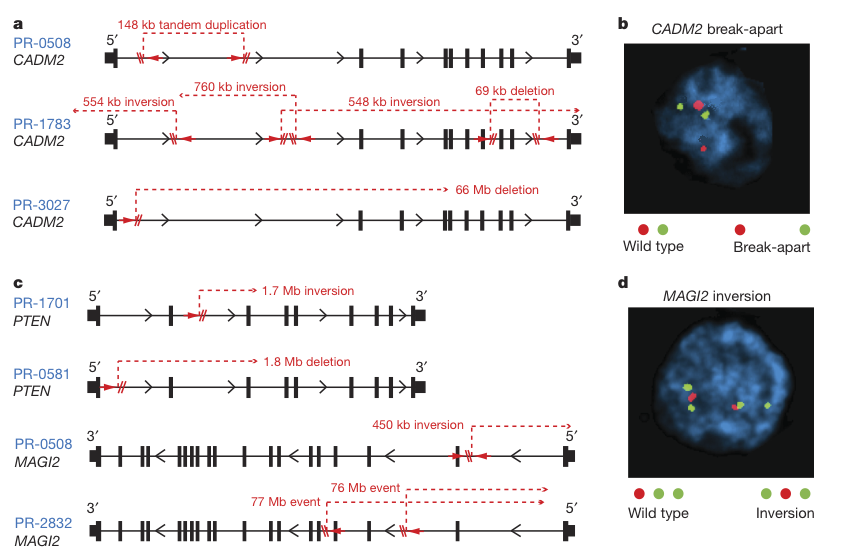
Figure 4
This figure shows the location of intragenic break points (indels) in CADM2, PTEN, and MAGI1 across prostate tumor cell lines. The figure sheds light on the diversity of chromosomal rearrangements in the same genes across different cell lines. The FISH images of CADM2 breaks and MAGI2 inversions demonstrate the use of probes to pick up on these variations.