In Situ Evolutionary Rate Measurements Show Ecological Success
of Recently Emerged Bacterial Hybrids
This web page was produced as an assignment for an undergraduate course at Davidson College.
Summary
The goal of the research presented in this paper was to measure the change in bacterial genomes on a short time scale in a natural environment. Microbial communities can have significant impacts on Earth’s geochemical cycles, but much information is lacking about their evolutionary processes. Current information about evolutionary rates is derived from laboratory studies on pathogens and endosymbionts, which may not be reflective of broader trends.
In order to address this, Denef & Banfield studied the bacterial communities inside the Richmond Mine. Because the extreme heat, humidity, and acidity limited biodiversity, the mine provided an ideal opportunity to study a relatively homogenous and stable microbial ecosystem. Denef & Banfield sampled bacterial biofilms from six different locations inside the Richmond Mine for over nine years. They found that the dominant microbe in the biofilms was the bacterial species Leptospirillum group II (group II contains types I-VI).
Previous studies indicated that recombination events between the early-colonizing Leptospirillum type VI and late-colonizing type I resulted in six hybrid genotypes. Using samples taken from the C75 location over five years, which contained primarily type III bacteria, Denef & Banfield were able to estimate the average substitutions per nucleotide per generation. They found this rate to be approximately 1.4 x 10^-9. This number for genome-wide, short-term substitutions, generated by studying a natural community, was higher than the previously-reported rate of 7.2 x 10^-11.
Denef & Banfield also collected biofilm samples that contained the other Leptospirillum types I, II, IV, V, and VI. By comparing their samples to the previously-estabished type I and type VI reference genomes, they were able to construct an evolutionary lineage for the different types. This lineage models how a specific series of individual recombination events led to the evolution of the modern genotypes that are found in the mine today. These genotypes differ by only a few mutations.
In brief, Denef & Banfield found that the rate of natural bacterial evolution was faster than expected, and they traced the evolution and divergence of the Leptospirillum genotypes found in the mine.
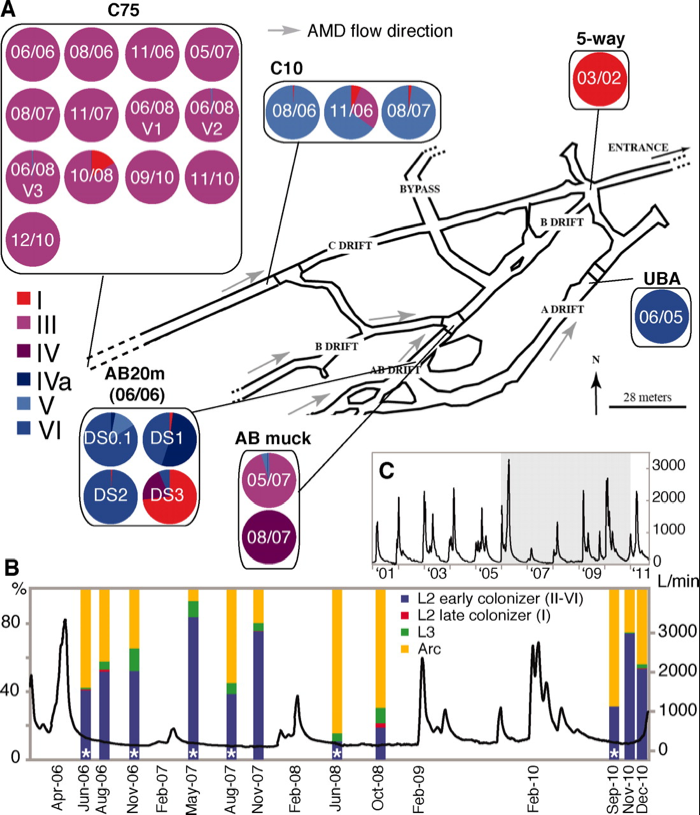
Figure 1. Distribution
of bacterial species and genotype throughout the Richmond Mine. A) Map
of the Richmond Mine with sampling locations, dates, and sample
compositions by genotype. B) Plot of the relative flow rate out of the
mine. Bars show date of samples and sample composition by species and
genotype. C) Plot of the flow rate out of the mine. Shaded area
indicates the section magnified in panel B.
Figure from Denef & Banfield. Permission granted.
Figure 1
Panel A shows 24 samples that were taken at 5 different locations in the Richmond mine. The samples collected at the C75 location are all predominately made up of Leptospirillum type III. The fact that this sampling location was composed of basically only one genotype of bacteria is what allowed Denef & Banfield to generate the mutation rate. Because there was only one species there it provided a great model of a naturally isolated population and allowed them to compare the genomic change from 06/06 to 12/10 with fewer confounding variables like increased biodiversity.
Samples collected at other locations contained bacteria of other types, whose genomes were analyzed and used to produce the evolutionary lineage in figure 2. The researchers noted that the physical location of some samplings provides evidence for positive selection of particular genotypes. The C10 location for example, is only 140 meters from C75, yet shows a completely different proportion of Leptospirillum genotypes. This suggests that local conditions can favor the relatively very small genetic differences between types, perhaps because of adaptive SNPs. They do not suggest a mechanism for selection, but do note that hybrids often tend to have enhanced success.
The paper does not seem to comment on a relationship between flow rate out of the mine and bacterial community composition, and I do not notice any obvious trends based on panels B and C.
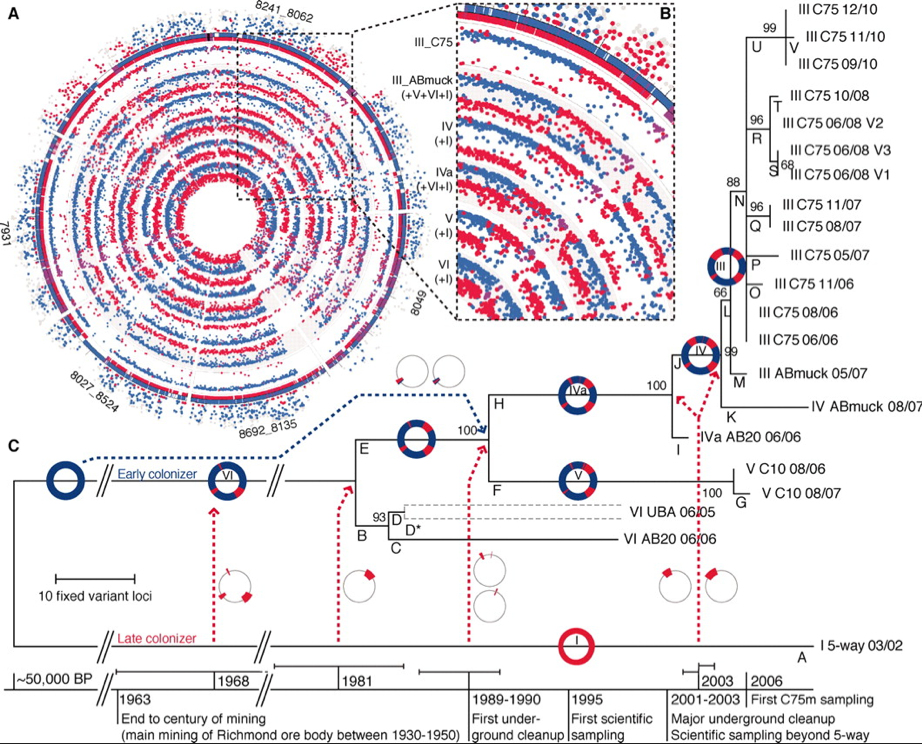
Figure 2. Proposed evolutionary lineage of Leptospirillum
group 2 types I-VI. A) Circles represent a genome of types III-VI, dots
indicate protein fragments at a particular locus that were traced to
type I (red) or type VI (blue). B) Magnification of this section reveals
identical recombination sites across multiple genotypes. C) Model
showing the suggested evolutionary progression of genotypes over time.
Figure from Denef & Banfield. Permission granted.
Figure 2
In panel A, red dots show peptides that were unique to the type 1 reference genome, and blue dots show genes that were unique to the type VI reference genome. This figure shows that almost all elements of the genomes of other types are composed of genes that can be traced to either type I or VI. Therefore, the researchers inferred that types III, IV, V are the evolutionary product of a recombination event between types I and VI. Panel B shows that the recombinant locus is in the exact same position in samples III-V, further supporting that those strains have arisen from a single I/VI recombinant individual. Furthermore, the peptides represented by the dots were characterized by PIGT, and because this data lined up with their read recruitment data, it supports the idea that their read-recruitment based evolutionary lineage (panel C) is valid.
Panel C shows one of the most important parts of this paper. It shows a series of recombination events that Denef & Banfield posit resulted in the evolution of strains II, III and IV from I and VI. This phylogenetic tree was created using the maximum parsimony method, and the bootstrap analysis is shown next to branch points. The lines below indicate a potential time scale for the events illustrated in the tree. This figure shows that a bacterial species can undergo significant evolution within relatively short time spans - the researchers estimate that the divergence of types I and VI into II, III, and IV took between 2 and 44 years. This evolution is likely significant enough to account for the positive selection inferred from the differences in sample composition by location shown in figure 1. Because type III has achieved dominance in biofilms at some locations, this supports that idea that bacterial recombination can quickly lead to new, adaptive phenotypes. Panel C also shows repeated recombination between type I and the hybrids, meaning that the more red, type I-like sections a hybrid has, the more recently it diverged.

Figure 3. Summary view of selected differences across Leptospirillum genotypes (circles).
Figure from Denef & Banfield. Permission granted.
Figure 3
Figure 3 is an overview of the differences between the Leptospirillum group 2 genotypes. On the inside circle is type I, the source of the red sequences, and outside that are the genotypes that contain recombinant sequences, with the most recently diverged genotypes on the outside. Gray sections represent sequences could not be analyzed relative to each other due to indels. Conserved recombinant blocks are observed in strains IV-VI. This figure also shows other mutations relative to the shared last common ancestor, indicated by the colored dots. Many of these mutations are conserved across multiple genotypes, suggesting that they are either neutral or adaptive. In particular, genes in functional groups T and K, affecting signal transduction and transcriptional regulation, were observed to mutate at a significantly higher rate. Mutations in these key pathways might be particularly adaptive (or maladaptive, but those organisms probably wouldn’t have grown to large populations like the sampled genotypes did) in the face of changing conditions.
Thoughts
I think this paper establishes some pretty interesting ideas. They came up with a nucleotide substitution rate for a natural population, which was higher than expected, and they showed that appreciable, and likely adaptive, evolution can happen in the wild over short time spans. They were also able to propose a series of genetic events that led directly to the divergence of different genotypes. It is interesting to see a molecular, step-by-step analysis of something as long-term and big-picture as evolution. This paper gave me a new perspective on the mechanisms through which genotypes diverge and organisms evolve. I feel as though evolution is often discussed on the macro-scale, and this paper really gave a concrete look at some of the molecular events that lead to evolution.
A couple things about this paper stood out to me stylistically. I thought the color scale for the different genotypes in figure 1 was too similar and it made the pie charts too hard to read. In figure 2, there are purple dots and blocks that are not explained in the text or figure legend and I can't figure out what they are. Much of the information referenced in the text is contained in supplementary figures, which is a little irritating. FIgure 3 can't even be analyzed properly without viewing supplementary material. In addition I thought the figures were rather poorly explained in the text - they were referenced only briefly and it was a bit of a challenge to figure out what was going in figures two and three. Figure1 has seemingly extraneous data on the flow rate out of the mine that is not commented on.
Reference
Denef, Vincent J., and Jillian F. Banfield.
"In Situ Evolutionary Rate Measurements show Ecological Success of
Recently Emerged Bacterial Hybrids." Science 336.6080 (2012): 462-6. Print.
Erich Baker's Homepage
Genomics Page
Biology Home Page
Email Questions or Comments to erbaker@davidson.edu or macampbell@davidson.edu
© Copyright 2013 Department of Biology, Davidson College, Davidson, NC 28035