MacDNAsis Analysis of
Lysozyme Genbank search results
Introduction
Using the lysozyme cDNA and amino acid sequences from
five different organisms (fly,
mouse, E.
coli, chicken, and human)
obtained in a previous Genbank search of lysozyme, the following page is
a presentation of a MacDNAsis analysis. MacDNAsis is a computer application
which analyses either DNA or amino acid sequences and produces a myriad
of useful information. In this analysis, the predicted open reading frame
of the fly cDNA sequence was first determined. Then using this ORF, the
molecular weight of lysozyme was calculated, hydropathy and antigenicity
plots were produced, a visual representation of the secondary structure
was made, and finally the similarity of the five amino acid sequences was
determined through a multiple sequence analysis and a proposed phylogenetic
tree. The results are summarized below.
1. Open Reading Frame (ORF) Determination
Using the 1366 nucleotide fly (Drosophila melanogaster)
lysozyme cDNA sequence obtained
through the previous Genbank search, the largest open reading frame was
determined. First the plot below (Fig. 1)was produced. This plot revealed
the largest open reading frame (shaded in black) which is assumed to be
the coding region for fly lysozyme.
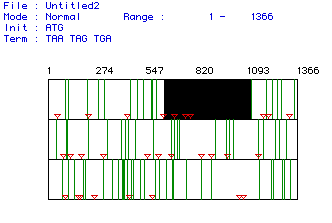 Fig. 1. MacDNAsis analysis of open reading frame (ORF) for fly (Drosophila
melanogaster) lysozyme. The numbers along the top indicate the nucleotide
number. The three different rows represent the three different reading
frame possibilities of a codon sequence. Start codons (ATG) are represented
by the orange triangles, stop codons (TAA, TAG, TGA) are represented by
the green vertical bars, and the white areas represent ORFs. The black
box in the top row is simply a highlight of the largest ORF. We assumed
that this largest ORF was the coding region of the lysozyme protein.
2. Molecular Weight (MW) Determination
The sequence location of this ORF was then determined
(aa's 634-1119). After translation, further analysis revealed that this
region encodes a 18.066 kDa protein (data not shown).
3. Determination of Lysozyme Hydropathy
The fly ORF was then analyzed using a Kyte and Doolittle
plot (Fig. 2). This plot shows both hydrophobic and hydrophilic regions
of the fly lysozyme protein. Since protein membrane spanning domains are
predominantly hydrophobic, the Kyte and Doolittle plot is used to predict
such regions.
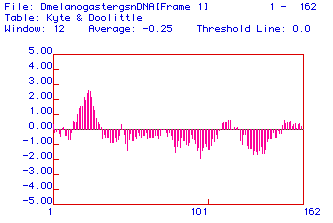
Fig. 2. A Kyte and Doolittle hydropathy plot of fly (Drosophila melanogaster)
lysozyme ORF. The x-axis shows the amino acid number in the sequence; positive
y-axis values are hydrophobic and negative values are hydrophilic. The
region centered near aa 30 displays significant hydrophobicity.
The significantly hydrophobic region near aa 30 indicates
that this region could possibly span a membrane. However, since the remainder
of the molecule is significantly hydrophilic, it seems unlikely that lysozyme
is an integral membrane protein. Also given that lysozyme is believed to
be cytoplasmic, it seems then, that this hydrophobic domain is rather an
indication of a hydrophic folding region (as will be discussed in section
5).
4. Determination of Lysozyme Antigenicity
Next, a Hopp and Woods plot (Fig. 3) was generated to
determine hydrophobic--and therefore potential antigenic--regions in the
lysozyme protein. Antibody-antigen interactions are dependant upon electrostatic
forces, hydrogen bonding, van der Waals interactions, and hydrophobicity1.
It is these specific interactions which give antibodies their high specificity.
Thus when wanting to raise monoclonal antibodies against a protein, for
the purpose of producing a probe, it is necessary to determine what region
will provide the most successful epitope.
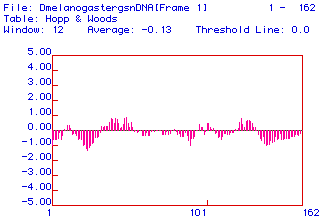
Fig. 3. Hopp and Woods antigenicity plot of fly (Drosophila melanogaster)
lysozyme ORF. X-axis shows amino acid numbers; positive y-axis values are
hydrophobic and negative values are hydrophilic. The region surrounding
aa 50 displays a relatively hydrophobic region.
Fly lysozyme appears to have two relatively weak hydrophilic
regions and two relatively weak hydrophobic regions. The largest of these
hydrophobic regions is the one surrounding aa 50. Due to the hydrophobicity,
this region will display good antigenicity. Therefore, one would want to
sequence this region and raise antibodies against it when producing a probe
against lysozyme.
5. Determination of Predicted Secondary Structure
Next, the secondary structure of the fly lysozyme ORF
was predicted using MacDNAsis. There are four levels of protein structure:
primary, secondary, tertiary, and quaternary. Primary structure refers
to the actual amino acid sequence that comprise a protein. Secondary structure
refers to the local spatial arrangement of the amino acids, resulting in
alpha-helices or beta strands. Tertiary structure is the 3-dimensional
folding of the subunit due to forces such as disulfide bonds. Finally quaternary
structure refers to interaction of separate subunits to produce a whole
protein. MacDNAsis analysis produced the following diagram of predicted
secondary structure for fly lysozyme (Fig. 4).
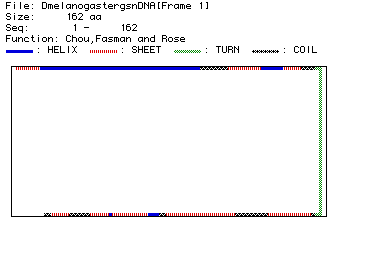
Fig. 4. Chou, Fasman, and Rose analysis predicting the secondary structure
for fly lysozyme (aa 1-162). As indicated in the legend, blue bars represent
alpha-helices, red striped bars represent beta-strands, green bars represent
turns in the structure, and black-checkered bars represent coiled domains.
From this prediction, fly lysozyme contains four alpha
helices, eight beta pleated sheets, six coiled domains, and two major turns.
When compared to a RasMol
image of lysozyme, this predicted structure seems relatively consistent.
The RasMol image (viewed best in Display:ribbons) appears to have four
alpha-helices and three beta-strands (forming a beta-pleated sheet) separated
by coiled domains. In addition, when tracing the sequence, the RasMol structure
does seem to illustrate two large turns just after the first two alpha
helices and the three beta-strands. Thus with the exception of the unseen
beta strands at the terminal half of the molecule, the MacDNAsis generated
secondary structure image and the RasMol image seem to confirm the structure
of lysozyme.
6. Multiple Sequence Alignment
The five amino acid sequences obtained through the previous
Genbank search were analysed for sequence similarity. Recently, sequence
analysis has provided another powerful tool for determining evolutionary
relationships. Fig. 5 show each lysozyme ORF from the five organism (fly,
E. coli, chicken, human, and mouse).
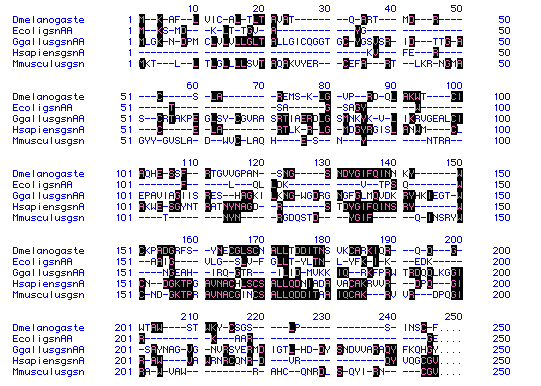
Fig 5. Lysozyme amino acid sequence alignment for five organisms (Dmelanogaste-fly,
EcoligsnAA-E. coli, GgallusgsnAA-chicken, HsapiensgsnA-human, and
Mmusculusgsn-mouse). Number to the left and right of the sequences and
above each sequence group indicate amino acid number. Letters represent
amino acids, with dashes (-) inserted to maximize sequence alignment. Black
boxes indicate amino acid conservation.
From this figure, it appears that human lysozyme and
mouse lysozyme are most closely related. This is seen particularly in the
fourth block of sequences (151-200), as the greater portion of the aa's
are conserved between the two.
On a more puzzling note, none of the first 35 aa's in
the human lysozyme are conserved. Although it is difficult to determine
the most primitive sequence, the human lysozyme sequence seems to have
mutated significantly from it. Whether there is a function significance
or an evolutionary significance to the human protein, is equally difficult
to tell, but a sequence comparison on a much larger scale might provide
more insight.
7. Proposed Phylogenetic Tree
From the sequence alignment produced in Fig. 5, a phylogenetic
relationship for lysozyme was constructed.

Fig. 6. Phylogenetic tree showing the determined sequence conservation
among the five organisms (HsapiensgsnA-human, MmusculusgsnA-mouse, Dmelanogaste-fly,
EcoligsnAA-E. coli, GgallusgsnAA-chicken). Numbers indicate lysozyme
percentage aa sequence conservation between shown organisms.
This proposed tree confirms the close relation of the
human, mouse, and to a lesser degree, fly, E. coli, and chicken
lysozyme proteins. A large homology is seen between human and mouse lysozyme
with 74.6% of the residues conserved. Next closest in relationship is the
fly lysozyme with 24.3% conserved between it and the other two, followed
by the E. coli lysozyme, having a 7.5% conservation rate. Finally,
the chicken lysozyme showed the least rate of conservation, only 6.7%.
It is clear that this tree is not wholly consistent with
evolutionary lineage. One would expect that the mouse would be most conserved,
followed by the chicken, the fly, and E. coli. A plausible explanation
for this is the selection pressures exerted on domesticated chickens. Since
domesticated chicken have a high exposure rate to bacterial infection,
it is consistant that a defense mechanism, such as lysozyme, might be highly
mutated. Thus in species where there is less selection pressure, one expects
the lysozyme protein to be more conserved. This is largely seen in the
phylogenetic tree. Nonetheless, this aberration demonstrates the precarious
nature of sequence analysis in predicting phylogenetic relationship.
References
1. Stryer L. 1995. Biochemistry. 4th ed. New York: W.H.
Freeman and Company. p 372.

Please send your comments, suggestions to grnoland@davidson.edu.
Back to GSN's homepage.
Link to Davidson College's Biology
Homepage.
![]()