The Big Picture
The researchers are trying to prove that pluripotent stem cells can be induced in mouse embryonic and adult fibroblast cultures by the addition of four genetic factors: Oct3/4, Klf4, Sox2, and c-Myc.
Summary of Results
Figure 1A
Part A shows the method Takahashi and Yamanaka used to determine if 24 selected candidate genes could be used to induce pluripotency (the ability to differentiate into any of the 3 germ layers) in somatic cells. Homologous recombination was used to insert betageo, a fusion of B-galactosidase and neomycin resistance genes into the mouse Fbx15 gene. Embryonic stem (ES) cells homozygous for Bgeo show resistance to G418, thus they concluded that iPS cells with at least partial activation of Fbx15 should show resistance to G418.
Figure 1B
Part B shows how the 24 candidate genes together produced G418 resistant colonies. (B-gal turns colonies blue when activated, thus the Fbx15 gene with the Bgeo construct must be active in these cells).
Figure 1C
These three photos show the cell morphology of ES cells, iPS-MEF24 cells and MEFs. Here we see that the iPS-MEF24 clones look very similar in shape to the ES cells compared to the MEFs which look completely different.
Figure 1D
This graph shows the growth of ES, iPS, and MEFs (on the Y-axis) over a period of 120 days (on the X-axis). We see that the iPS cells proliferate in a very similar manner to the way ES cells proliferate. MEF cells do not proliferate nearly as much or for as long.
Figure 1E
This gel resulting from RT-PCR shows the presence of ES cell marker genes in iPS cells, ES cells, and MEF cells. The Nat1 gene is used as a loading control, while the RT minus band is used to show that there was no contamination. The ES lane was used as a positive control, because ES cells should have all of those genes, while the MEF lane was used as a negative control, because MEFs should not express those genes. This analysis revealed that iPS-MEF24 clones expressed many ES cell markers (such as Oct3/4, Nanog, E-Ras, Cripto, Dax1, and Zfp296).
Figure 1D
Part D shows the bisulfite genomic sequencing of the promoter regions for three ES marker genes in three iPS-MEF24 clones, ES cells, and MEFs. Like ES cells, two of the three promoters were demethylated in iPS cells, but unlike ES cells, the third promoter (Oct3/4) remained methylated in iPS cells.
Overall Figure 1 Summary
In all, this figure demonstrates that some combination of the 24 candidate genes can induce ES cell marker genes in MEF cells.
Figure 2A
Part A is a graph that shows the effects of removing an individual marker gene from the group of 24 candidate genes on growth of G418 resistant colonies. The numbers on the X-axis represent one of the 24 candidate genes, and the Y-axis shows the number of colonies grown over a 10 day period (shown in white columns) and grown over a 16 day period (shown in black columns). The “All factors” lane shows the amount of G418 resistant colonies with all 24 factors. Withdrawal of 10 different factors resulted in complete lack of colony growth after 10 days and minimal or no colony growth after 16 days (Figure 1).
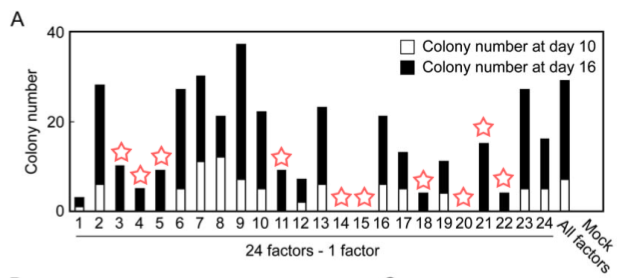
Figure 1. A replication of Figure 2A with red stars added over the 10 factors that upon their withdrawal did not produce G418-resistant colonies after 10 days.
Figure 2B
Part B is a graph that shows the effects of removing an individual marker gene from the group of 10 factors (identified in part A) on growth of G418 resistant colonies. The X and Y axes are the same as that in part A, and colonies were grown over a 16 day period. Removal of factors 14 (Oct3/4) and 20 (Klf4) did not produce G418 resistant colonies, while removal of factor 15 (Sox2) resulted in very few G418 resistant colonies. Removal of factor 22 (c-Myc) produced G418-resistant colonies, but they did not have ES cell-like morphology. This data implies that Oct3/4, Klf4, Sox2, and c-Myc play vital roles in inducing pluripotency in MEFs.
Figure 2C
Part C shows a graph of different combinations of factors on the growth of G418-resistant colonies. The X and Y axes are the same as those in parts A and B, and colonies were grown over a 16 day period. No combination of two factors produced G418-resistant colonies. The combination of Oct3/4, Klf4, and c-Myc did produce 54 G418-resistant colonies, which was the highest out of the multiple combinations of 3 factors (Referred to as iPS-MEF3).
Figure 2D
These pictures show the morphology of iPS-MEFs with a combination of four factors, ten factors, and three factors. The picture of the iPS-MEFs with three factors shows a non-ES cell like morphology while the pictures of the iPS-MEFs with four and ten factors show similar ES cell-like morphology.
Overall Figure 2 Summary
This figure demonstrates that the combination of Oct3/4, Klf4, and c-Myc can lead to G418-resistant colonies, but the morphology of iPS-MEF3 is different than that seen in iPS-MEF4 and iPS-MEF10.
Figure 3A
Part A shows a gel from RT-PCR of ES marker genes in clones of iPS-MEF3, iPS-MEF4, iPS-MEF10, ES cells, and MEFs. With the exception of Ecat1, iPS-MEF4 and iPS-MEF10 clones expressed most of the marker genes.
Figure 3B
Chromatin immunoprecipitation analysis was used to determine the extent of acetylation and methylation of the promoters of Oct3/4 and Nanog. The data from the graphs were obtained from RT-PCR.
Figure 3C
Bisulfite genomic sequencing was used to analyze the methylation status of the Oct3/4, Nanog, and Fbx15 promoters in iPS-MEF4 and iPS-MEF10 clones.
Figure 3D
The top two pictures show iPS-MEF4 and iPS-MEF10 clones stained with a mouse monoclonal antibody against SSEA-1, while the bottom two pictures show the same clones stained with an alkaline phosphotase kit.
Overall Figure 3 Summary
These data show that iPS cells are very similar, but not identical to ES cells.
Figure 4A
This figure shows the global gene-expression analysis of ES cells, iPS cells, and MEFs using DNA microarrays. Here, one can see that ES and iPS cells are similar, but are distinct from fibroblasts and their derivatives.
Figure 4B
This microarray determined what genes were upregulated in different types of cells. Group 1 genes are upregulated in both ES and iPS cells. Group 2 genes are upregulated more in ES cells, iPS-MEF4, and iPS-MEF10 clones than in iPS-MEF3 clones. Group 3 genes are upregulated more in ES cells than in iPS cells. Lower expression of genes in iPS-MEF3 clones may be the cause of its difference from iPS-MEF4 and iPS-MEF10 clones.
Overall Figure 4 Summary
Like Figure 3, these data show that iPS-MEF4 and iPSMEF10 cells are very similar but not identical to ES cells.
Figure 5A
Part A shows pictures of teratoma (a tumor containing all three germ layers) formation in different tissue types in a clone from iPS-MEF4.
Figure 5B
Through immunostaining, part B confirms that iPS-MEF4 can differentiate into all three germ layers.
Figure 5C
The upper panel of part C shows that iPS-MEF3, iPS-MEF4, and iPS-MEF10 clones were able to form embryoid bodies (which are normally derived from ES cells). The lower panel shows that iPS-MEF4, and iPS-MEF10 clones were able to differentiate into the three germ layers, while the iPS-MEF3 clone was unable to differentiate.
Figure 5D
Part D shows immunostaining of iPS-MEF4 and iPS-MEF10 clones demonstrating differentiation into all three germ layers (Figure 2).
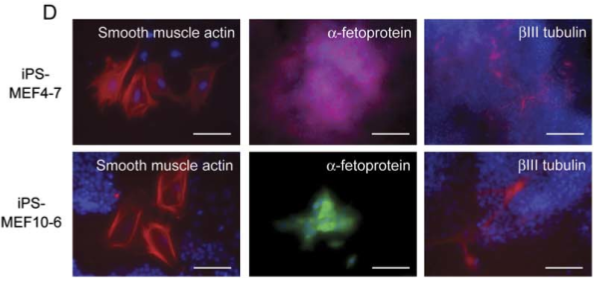
Figure 2. A replication of Figure 5D, showing immunostaining of iPS-MEF4 and iPS-MEF10 clones, demonstrating differentiation in the three germ layers.
Overall Figure 5 Summary
iPS-MEF4 and iPS-MEF10 clones exhibit pluripotency, but iPS-MEF3 clones cannot induce pluripotency in vitro.
Figure 6A
The four selected factors were put into tail tip fibroblasts of Fbx15Bgeo/Bgeo mice with green fluorescent protein (GFP). This picture shows the cell morphology of a resulting iPS-TTFgfp4 clone.
Figure 6B
Part B shows the resulting gel of RT-PCR analysis of ES marker genes in the iPS-TTFgfp4 clones 1-5 and 7. These clones express most of the ES marker genes.
Figure 6C
iPS-TTFgfp4 clones were microinjected into mouse blastocysts. The resulting pictures come from florescence microscopy. The upper panel in part C shows pictures of the embryos of one iPS-TTFgfp4 clone at stage 7.5. The lower panel shows pictures of the embryos of a different iPS-TTFgfp clone at stage 13.5. The right panels in both cases show fluorescence and indicate that GFP expressing cells (the iPS cells) have been integrated (Figure 3).
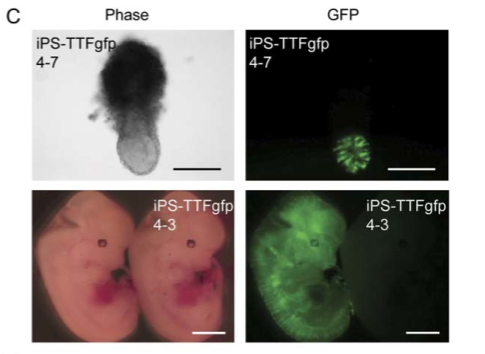
Figure 3. A replication of Figure 6C, demonstrating that iPS-TTFgfp4 clones contribute to embryonic development.
Figure 6D
The stage 13.5 embryo was stained with anti-GFP antibody (brown) and counterstained with eosin (blue) to show that the iPS-TTFgfp clones were expressed in all three germ layers.
Overall Figure 6 Summary
These figures show that iPS cells with the four factors can induce pluripotency from adult mouse fibroblast cultures.
Figure 7A
Part A shows a Western blot analysis of the four factors and three other proteins in iPS cells, ES cells and MEFs. B-actin is used as a loading control. The four factors are expressed similarly in iPS and ES cells. p-53 is expressed similarly in iPS and ES cells as well, but Nanog and ERas are expressed at lower levels in iPS cells than in ES cells.
Figure 7B
The graphs in the left column show RNA levels of three different factors (Oct3/4, Sox2, and Nanog) in iPS cells, ES cells, MEFs, and TTFs. These factors were either undifferentiated (U) on feeder cells or induced to differentiation through embryoid body formation (D). These RNA levels were determined by RT-PCR. White columns used primers specific for endogenous transcripts, while white and black columns used primers for both endogenous and transgenic transcripts. The graphs in the right column show protein levels of the three different factors; these levels were determined by Western blot analysis. It’s interesting to note that the Oct3/4 and Sox2 mRNA expression levels were higher in iPS cells than in ES cells, but their protein expression levels in iPS cells were similar to that of ES cells.
Figure 7C
Part C shows a Southern blot of iPS clones and ES cells using Klf4 as a probe. It shows that integration of Klf4 was in a different location for each iPS clone.
Figure 7D
Part D shows the karyotype analysis of the iPS-TTFgfp4-2 clone, which has a normal karyotype of 40XX.
Figure 7E
These pictures show the morphology of ES cells and iPS cells without feeder cells. The top row shows their growth with LIF (Leukemia inhibitory factor, a cytokine that promotes cell differentiation) while the bottom row shows their growth without LIF. Unlike ES cells, iPS cells could not remain undifferentiated without feeder cells both in the presence and absence of LIF.
Overall Figure 7 Summary
These results confirm that iPS cells are not merely ES cells that have contaminated their sample.
Critique
Overall, I feel that the paper was very well written and that the authors were straightforward in describing and interpreting their data. They systematically identified four marker genes from a larger group of 24 and provided thorough evidence that iPS cells with these four marker genes were very similar to ES cells both morphologically and in pluripotent ability.
One thing that I would have liked to see more of would be comparisons of experiments with iPS cells to ES cells as a positive control, just so that I have a better idea of what exactly I should be looking for when trying to see similarities in iPS cells. In Figure 3D, it would have been nice to see pictures of ES cells stained with a mouse mAb and with an alkaline phosphatase kit to understand how similar or different the iPS clones were to ES cells. I would have also liked to see histological evidence of ES cells causing embryoid formation and differentiation into germ layers in Figures 5C and 5D.
I would have also liked to see more clarification in Figures 7C-E in a way that allowed me to understand how these figures support the researchers’ argument. I feel that these figures confuse the reader rather than add to Takahashi and Yamanaka’s point that iPS cells are not just a result from contamination of ES cells.
Future Directions
One thing I think it would be interesting to look at is if the MEF3 clones (those without the Sox2 factor) could be made to be more similar to ES cells like MEF4 clones. The authors alluded that the lower expression of Dppa3, Dppa4, Dppa5, Nanog, Sox2, Esrrb, and Rex1 in MEF3 cells compared to ES cells, iPS-MEF4, and iPS-MEF10 clones could be a cause for the lack of pluripotency in MEF3 cells. If the authors selectively induced up regulation of these genes in MEF3 clones (by possibly putting them in an environment deficient of a specific need that would require a larger production of these genes’ protein products), they would be able to determine if the level of expression of these genes is the actual cause of MEF3 nullpotency.
Furthermore, the authors stated in their discussion that only a small amount of cells expressing the four factors became iPS cells, and that the reason for this low frequency may be due to the levels of expression of the four factors. To determine if this is the actual cause for low frequency, the authors should try to develop clones using various levels of expression of the four factors. If the promoters of these factors respond differently to certain proteins, causing different expression of the four factors, they may be able to purposely alter the level of expression of the four factors in this manner. This would require more in-depth research about the functions and properties of these four factors.
Finally, the introduction stated that human ES cells might be used to treat many diseases, and thus, the development of pluripotent stem cells from adult humans would be a major future experiment. They could use the same or very similar methods that they used in this paper to look for similarities between iPS cells from humans and ES cells in humans. Only a year after they published this paper, the same researchers were able to produce iPS cells from adult human fibroblasts using the same four factors (Takahashi et al., 2007).
© Copyright 2010 Department of Biology, Davidson College, Davidson, NC 28035
Send comments, questions, and suggestions to: Marissa Ghant at maghant@davidson.edu