Induction of Pluripotent Stem Cells from Mouse Embryonic and Adult Fibroblast by Defined Factors
General Overview
In this paper Takahashi and Yamanaka set out to discover a method by which somatic cells could be transformed into cells similar to embryonic stem cells to avoid the political ramifications involved with embryonic stem cell research. The authors describe a method that transforms somatic mice cells into pluripotent cells which share a number of similarities with embryonic stem cells. They are looking to discover the minimum number of factors integral to turning a somatic cell to an iPS cell to better understand the source of these similarities. They generated these iPS (induced pluripotent stem) cells by testing 24 different candidate genes and narrowing down to the genes that induced the cells most similar to embryonic stem (ES) cells in morphology, growth rate, and protein expression. A few strains of iPS cells ultimately were able to differentiate into all three germ layers, demonstrating pluripotency. Pluripotency is defined as the ability of a cell to differentiate into any of the 3 germ layers: endoderm, ectoderm or mesoderm. A pluripotent cell could therefore differentiate into any cell in the body.
Figure Analysis
Figure 1-
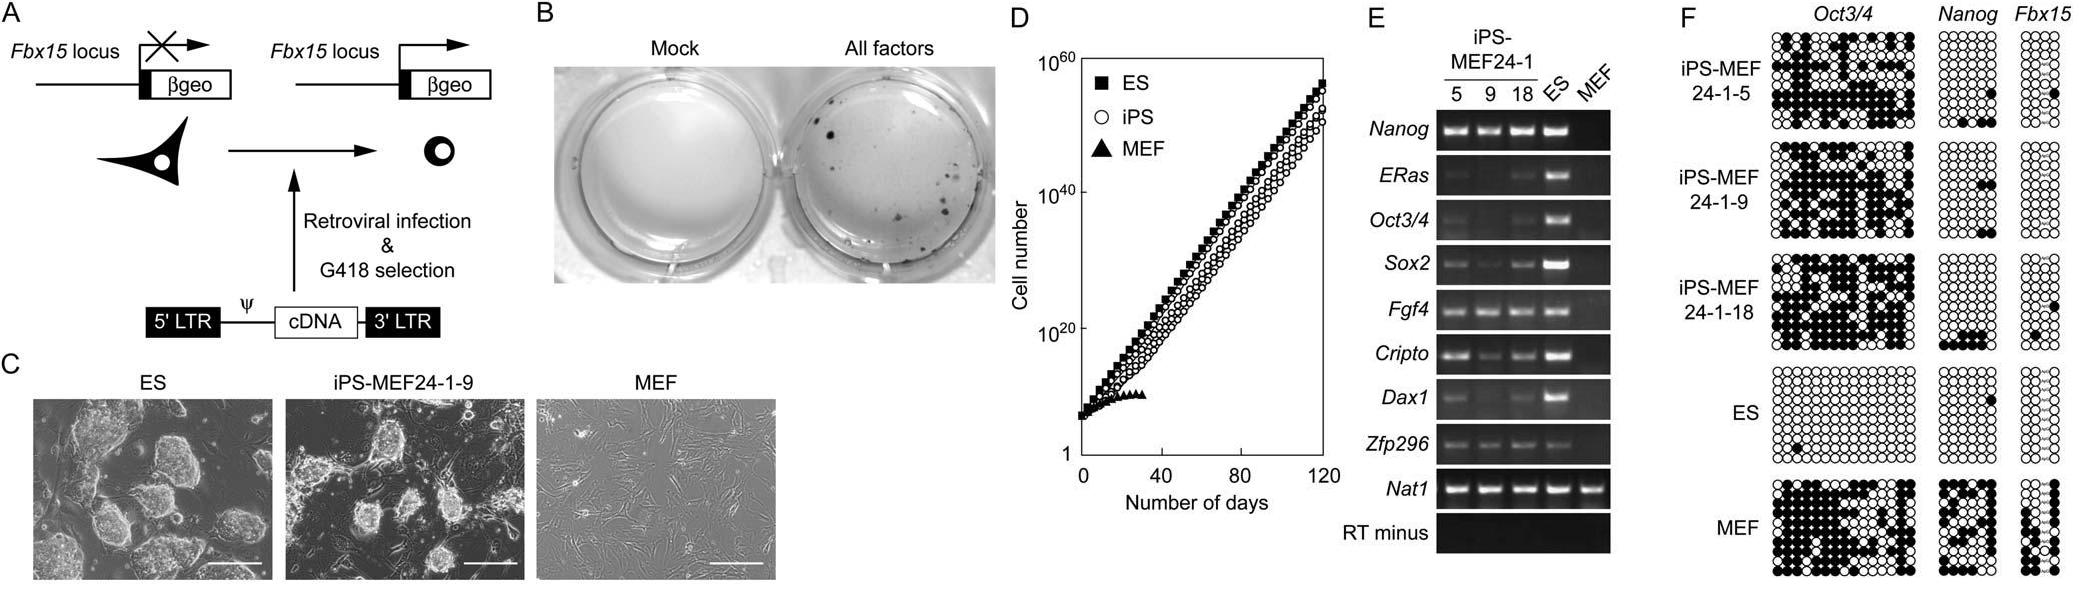
A. This diagram demonstrates the mechanism by which the authors plan to identify somatic cells from stem cells. Takahashi and Yamanaka inserted a β-geo cassette (a fusion of β-galactosidase and neomyocin resistance genes) into the Fbx15 gene. The Fbx15 gene is expressed in mouse embryonic stem cells and early embryos and is dispensable for the mouse’s survival. As the diagram shows, this construction should result in no expression in somatic cells with the insert, but expression in the pluripotent iPS cells. This expression will result in resistance to normal concentrations of G418, a compound that will be used to screen for pluripotent cells.
B. These images show two plates, the one labeled Mock is the control, while the experimental is the all factors plate. Both plates have G418 in their media, but only the all factors media has had all 24 candidate genes inserted into the cells. Cells were then stained with crystal violet to show which ones had survived. 22 G418-resistant colonies were reported, though this is hard to discern from the image.
C. These images display the morphology of 3 cell lines. Notice the amorphic shape displayed by all of the ES cells. In contrast, the MEFs are all rods. The iPS-MEF24-1-9 line shows a few rods, but mostly amorphic masses that closely resemble ES cells. This iPS line was obtained from one of the surviving cells shown in B with all 24 candidate genes inserted.
D. This graph displays the difference in cell number over a number of days between ES cells, iPS cells, and MEFs. The iPS cells show a constant, unchanged growth rate independent of cell number. This is consistent with the rate of growth of ES cells. MEFs, meanwhile, still have the somatic growth rate controls in place and their growth rate quickly decreases to zero.
E. This is an RT-PCR analysis of 3 of the iPS clone lines, ES cells, and MEFs. RT minus is the negative loading control and Nat1 is the positive loading control. MEF is the negative control and ES is the positive control. The diagram is meant to show which clones display the mRNA found in embryonic stem cells, but not MEFs. All clones have significant amounts of Fgf4, Cripto, Zfp296. Sox2 and Dax1 show an inconclusive result for the iPS-MEF24-1-9 clone but show significant bands for the three other clones. This diagram shows that at least some of the DNA found in the ES but not the MEF are now being transcribed in the iPS clones.
F. This diagram displays what CpG sites (locations that can be methylated) have been methylated in the promoter regions of the genes Oct3/4, Nanog, and Fbx15. The diagram was created via bisulfite genomic sequencing. Open circles indicate unmethylated CpG dinucleotides and closed circles indicate methylated CpGs. MEF is the negative control, showing where the cells have come from, and ES is the positive control, showing the desired result. The diagram shows in the iPS lines for Nanog and Fbx15, most of the promoters have been demethylated. In Oct3/4 for these same lines a much smaller percentage are demethylated, but a slight shift towards the fully demethylated ES cells is observable.
Figure 2-
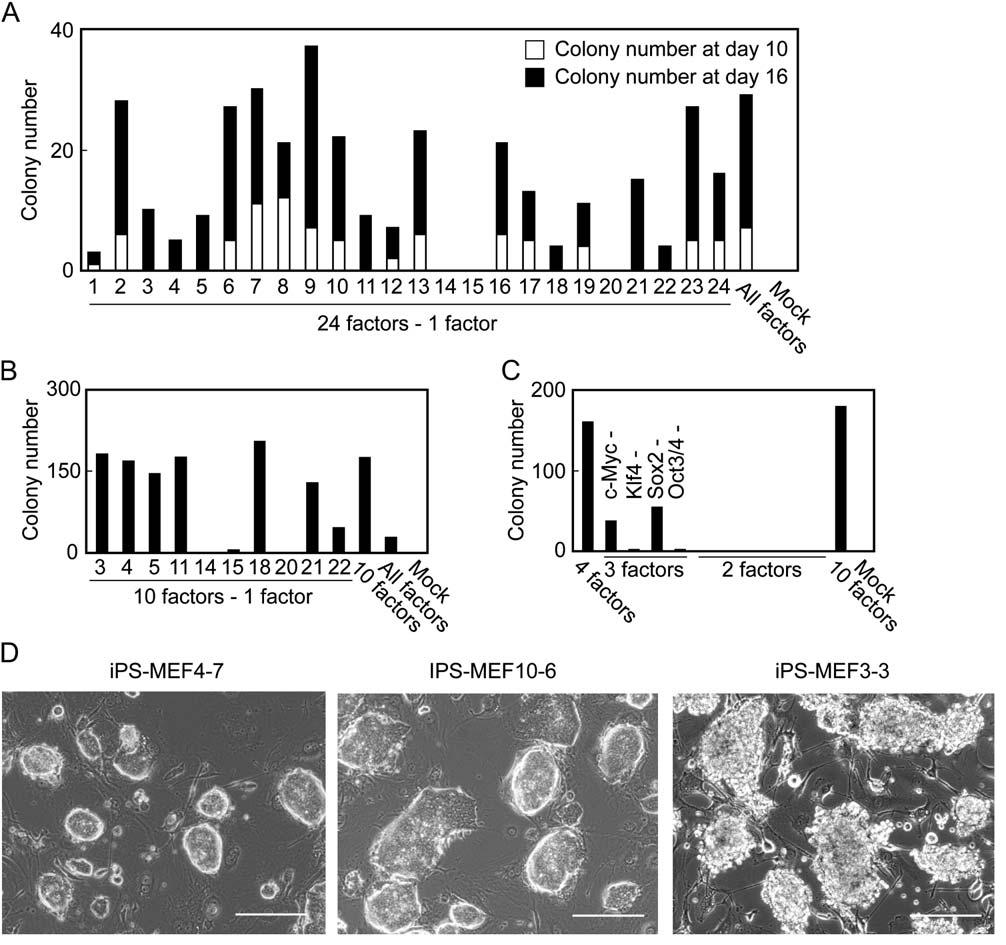
A. This diagram shows the result of removing a single factor from the pool of 24. The negative control is the mock batch and the all factors bar shows what would occur without the removal of any of the factors. Colony number at day 10 is in white and day 16 in black. Factors 3, 4, 5, 11, 14, 15, 18, 20, 21 and 22 all show no growth after the first 10 days, indicating they play a strong roll in the iPS cell’s stem cell properties. It is also interesting that removal of factor 9 results in more colonies at day 16 than with all factors, and both 7 and 8 had more colonies at day 10 than all 24 factors. This leads you to believe that some of these factors may be hindering the cell turning to an iPS cell.
B. This figure shows the results of removing one of the 10 factors listed previously on colony number observed 16 days after transduction. You can see the effect hinted at in the prior figure that the all factors batch was not the ideal batch and this 10 factors batch greatly outstrips it in colony number. The mock is once again a negative control. Factors 14, 15, and 20 appear to be most integral and 22 has more importance than any of the others. The removal of 18 created more colonies than all 10, once again showing that fewer factors may still yield a strain more similar to ES cells.
C. This graph shows that the ten factor batch has more colonies than the 4 factor batch, but not nearly to the extent that 10 factors outpaced 24 factors in the previous figure. Therefore these 4 factors must play a central role in the ES qualities of these iPS lines. This graph also shows that the removal of Kfl4 (factor 20) or Oct3/4 (factor 14) results in nearly zero colonies. Some colonies are observed when c-Myc or Sox2 are removed from the batch of 4, though much fewer than with all 4 factors or with all 10.
D. Looking back at the ES cell diagram in Figure 1C, iPS MEF4-7 and iPS MEF10-6 resemble ES cells much more closely in morphology than iPS-MEF3-3. This 3 factor batch appears much more granulated than the 2 other lines and the ES cells.
Figure 3-
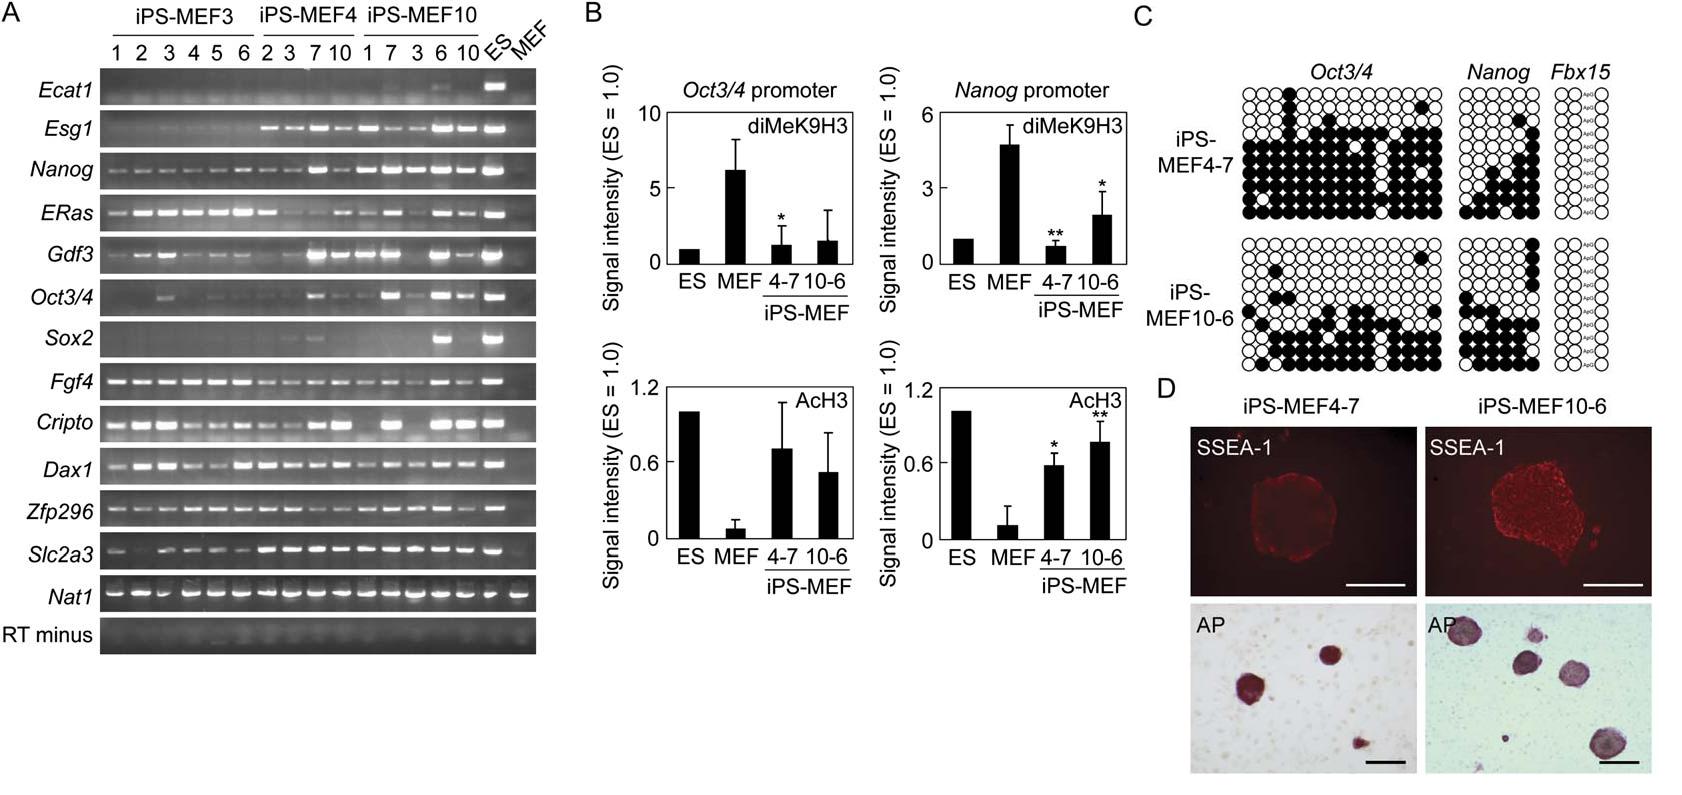
A-This shows an RT-PCR analysis of known ES marker genes in a number of different cell lines. Once again, Nat1 is a positive loading control and RT minus is a negative loading control. MEF is a negative control for the cell lines. ES is a positive control for the presence of these mRNA. iPS-MEF10-6 is the only cell line that conclusively has every mRNA tested for. However, even this cell line does not have these mRNA in the quantities they are found in ES. The general trend is that the iPS-MEF10 lines have the most in common with ES, followed by the iPS-MEF4 lines, followed by the iPS-MEF3 lines. There is a much more significant difference between the iPS-MEF3 lines and the two others.
B-These bar graphs display the dimethylation and acetylation statuses of the 4 cell lines. The graph in the upper left displays the dimethlyation status of lysine 9 of histone 3. Since histones are involved in tightly wrapping proteins in between replications, it makes sense that the graph shows a lower signal for stem cells than for MEFs. Stem cells replicate at a much higher, more constant rate than normal cells, as displayed in figure 1d. The decreased rate of expression of this lysine in histone 3 is also seen in the two iPS lines, consistent with the increased rate of replication from figure 1.
C-In this diagram, the authors use the same bisulfite sequencing method as figure 1F. To properly interpret it, you must look back to figure 1F. Interestingly, the 4 and 10 factor strains show more CpG methylation of the Nanog promoter than the 24 factor strains. However, the Fbx15 promoter is completely demethylated and the Oct3/4 promoter is much more methylated than observed in the 24 factor strains. The ES strain’s Nanog promoter is completely unmethylated at the CpG dinucleotides. Therefore these 10 and 4 factor clonal lines are less similar to ES cells in this respect than the original 24 factor line.
D-The iPS-MEF4-7 and iPS-MEF10-6 strains are stained to test for the presence of SSEA-1 in the top 2 frames. Both rows show staining, so both are present in the two cell lines. Strain 4-7 appears to have less of both compounds however it is difficult to quantify results from small snapshots of a larger sample.
Figure 4-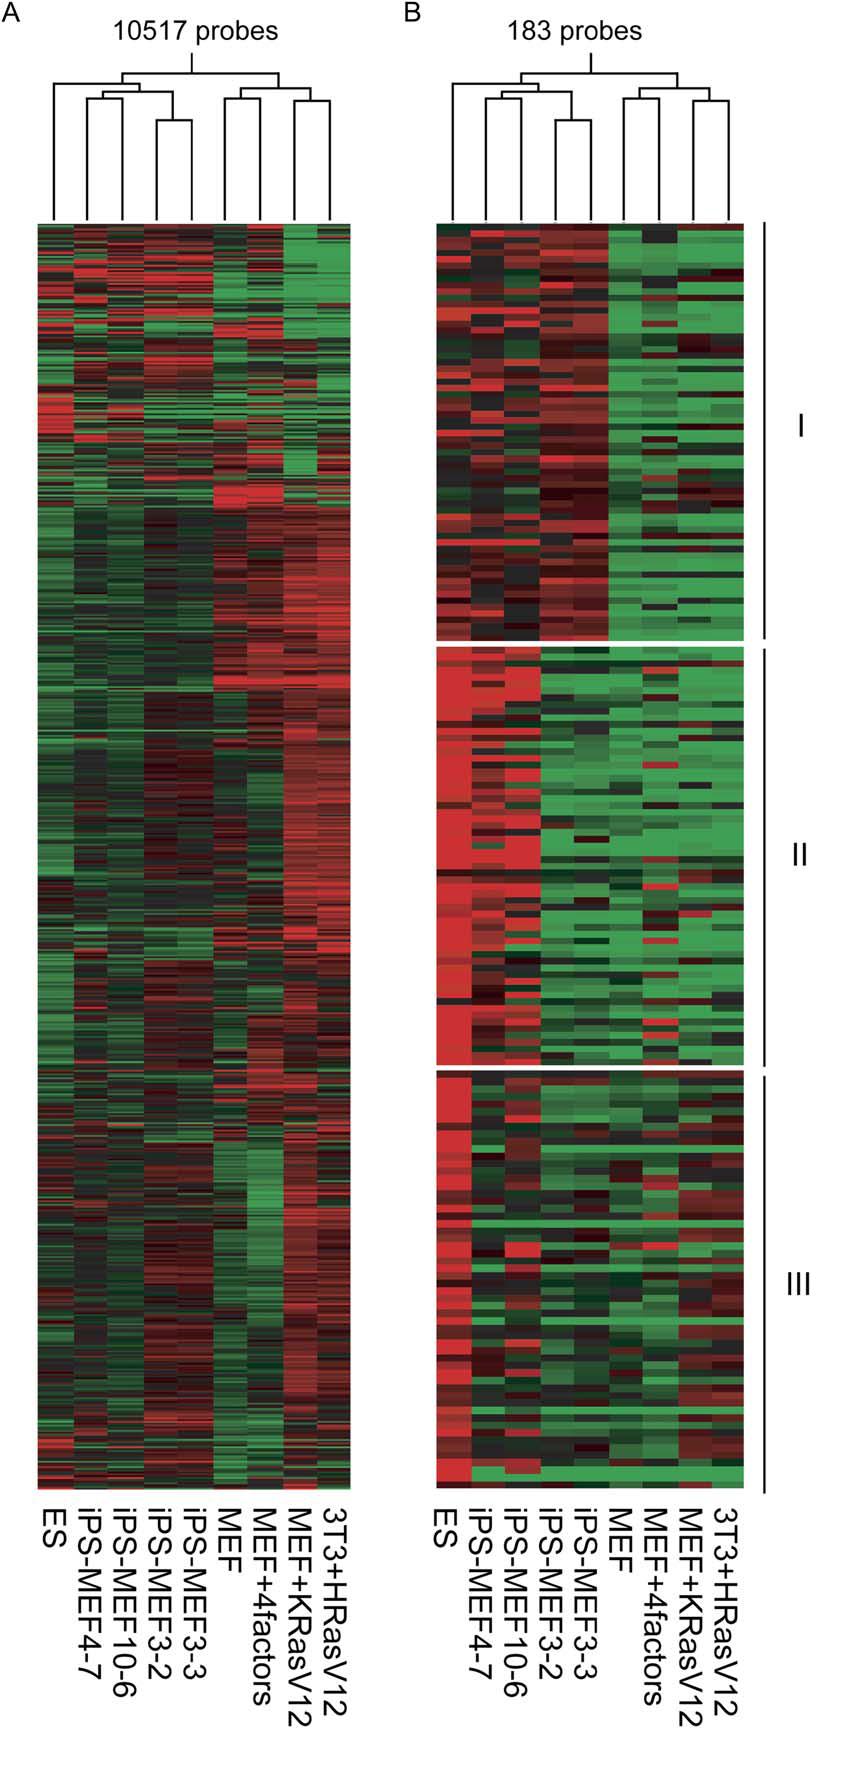
A-This is a quantitative display of the expression of 10517 different segments of DNA between the ES cells, four iPS-MEF strains, MEFs, MEF with the 4 most important factors, and 2 other MEF-related cells that have been immortalized. Red indicates greater expression than the median for all 8 strains, while green indicates less expression than the median. MEF shows the origin of the iPS strains, while ES is the desired destination. Other than the 3 furthest lanes to the right that seem least related to the experiment, the 2 strains that stick out the most are iPS-MEF3-2 and 3-3. These two strains have more upregulated genes than either the MEF or the ES. The strain that most closely mirrors the ES cells is the iPS-MEF10-6 strain. It is the strain that is most consistently upregulated and downregulated in concert with the ES strain. The iPS-MEF4-7 is also similar, but not the same extent.
B-This DNA microarray is similar to the one in A, except Takahashi and Yamanaka intentionally selected DNA that are upregulated in ES cells. These primers are regulated into 3 groups. Group I is upregulated in both the iPS cells and the ES cells. Group II is upregulated in ES cells and iPS-MEF4-7 and 10-6, but not particularly in 3-2 and 3-3. Group III is upregulated more in ES cells than any of the iPS cells. However, even in group III, iPS-MEF10-6 is upregulated along with ES in approximately half of the probes. iPS MEF4-7 does not have this same pattern.
Figure 5-
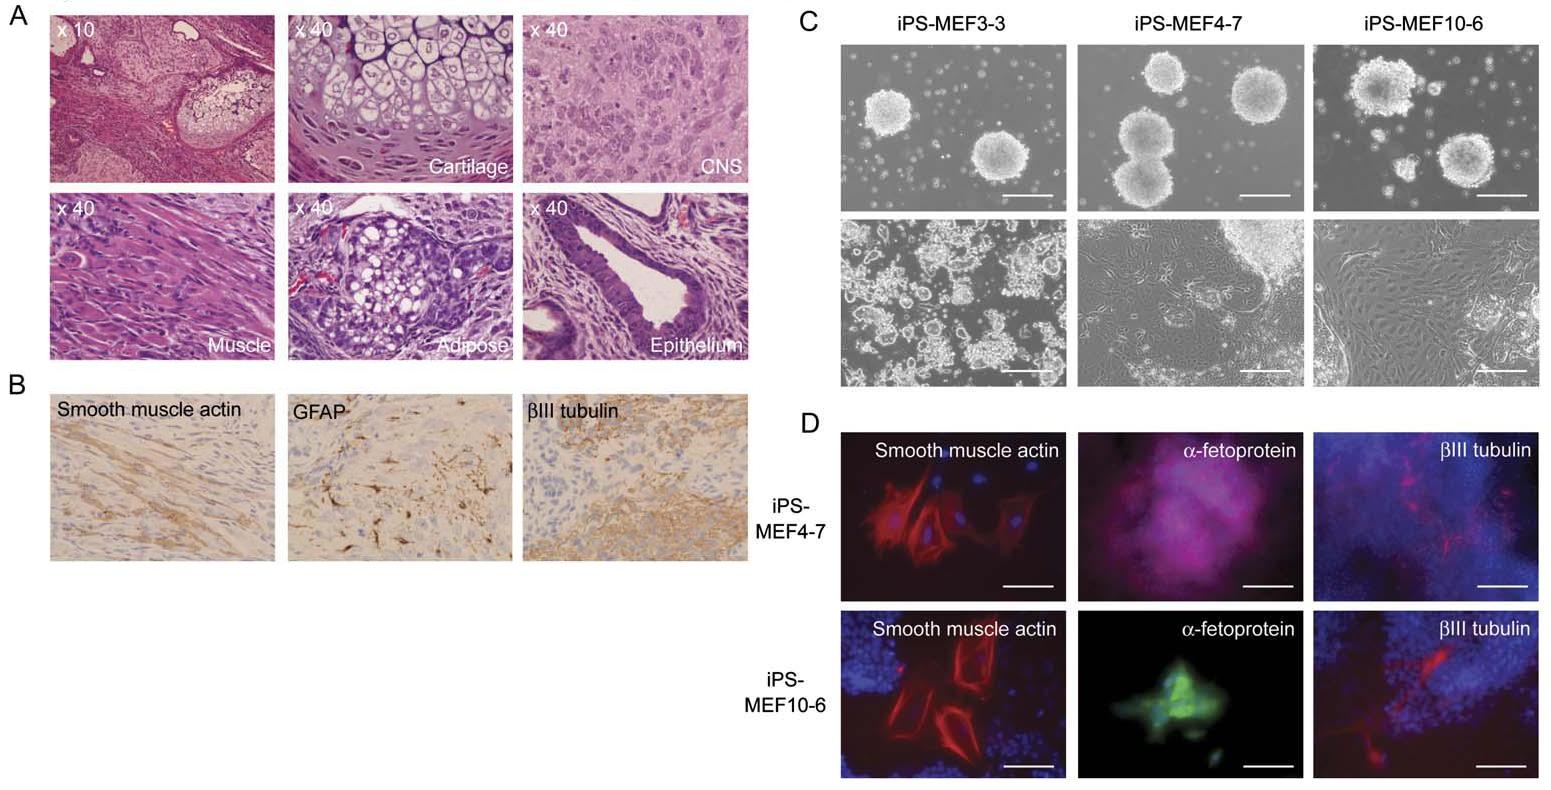
A-These images show a variety of tissues derived from iPS-MEF4-7 cells. Note that the cells seem to have taken a variety of forms, as would be expected of pluripotent cells.
B-These images show 3 types of tissue derived from iPS-MEF4-7 cells. Smooth muscle actin is a form of muscle tissue, β-III tubulin is a structural tubule protein, and GFAP is a protein involved with the central nervous system. These cells are showing an ability to differentiate into a number of tissues, consistent with ES cells.
C-All three cell strains form normally. However the iPS-MEF3-3, formed from only 3 factors, does not properly differentiate into the desired cell type. This is consistent with the claim made by the authors that none of the 3-factor strains were pluripotent.
D-This diagram shows two strains, iPS-MEF4-7 and iPS-MEF10-6, differentiating into all 3 germ layers as confirmed by immunostaining of the cells. This flexibility is consistent with ES cells, but not somatic cells. Therefore the authors are showing that they have at the least had some success in converting somatic cells into pluripotent cells similar to ES cells.
Figure 6-
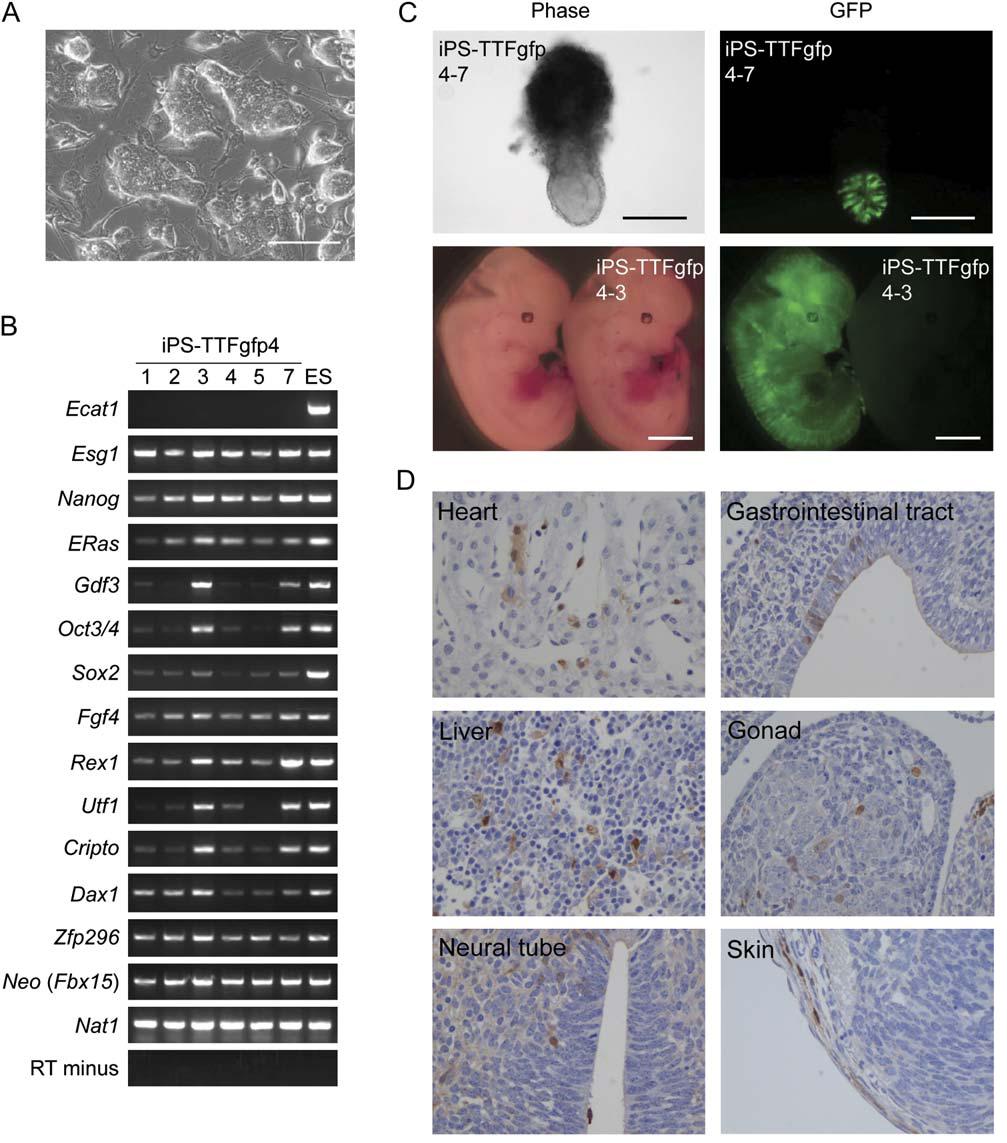
A-This diagram shows the iPS-TTFgfp4-3 strain on STO feeder cells, cells used to feed stem cells. This strain of iPS cells was created by inserting the four factors into tail-tip fibroblasts a 12-week-old female mouse homozygous for the β-geo insert. This female constitutively expressed the GFP protein through the CAG pathway. Comparing Figure 6A to Figure 1C, there isn’t a visually significant difference between ES cells and the iPS-TTFgfp4-3 strain.
B-This RT-PCR analysis is similar to the one found in Figure 3B. The mRNAs examined all code for proteins found in embryonic stem cells, as shown by the positives in every row except the negative loading control. 1, 3, 4, and 7 all give signals indicating the mRNAs are transcribed in their cell lines. Of these, 3 and 7 have signals most consistent with ES cells.
C-Mouse embryos are shown at 2 stages, earlier (upper) and later (lower). The gfp image shows where the iPS-TTFgfp4-3 have been injected and are proliferating in the embryo. The left images show an overall picture of the embryos. These images show that these cells can proliferate in mouse embryos like standard ES cells.
D-Cells from these 6 tissues were sectioned and stained with an anti-GFP antibody that would stain them brown. This means that any brown indicates the location of cells derived from the iPS-TTFgfp4-3 strain. Since brown is in every image, iPS-TTFgfp4-3 must have differentiated into all 3 germ layers and these 6 tissues. The blue was another stain to show that other cells were present.
Figure 7-
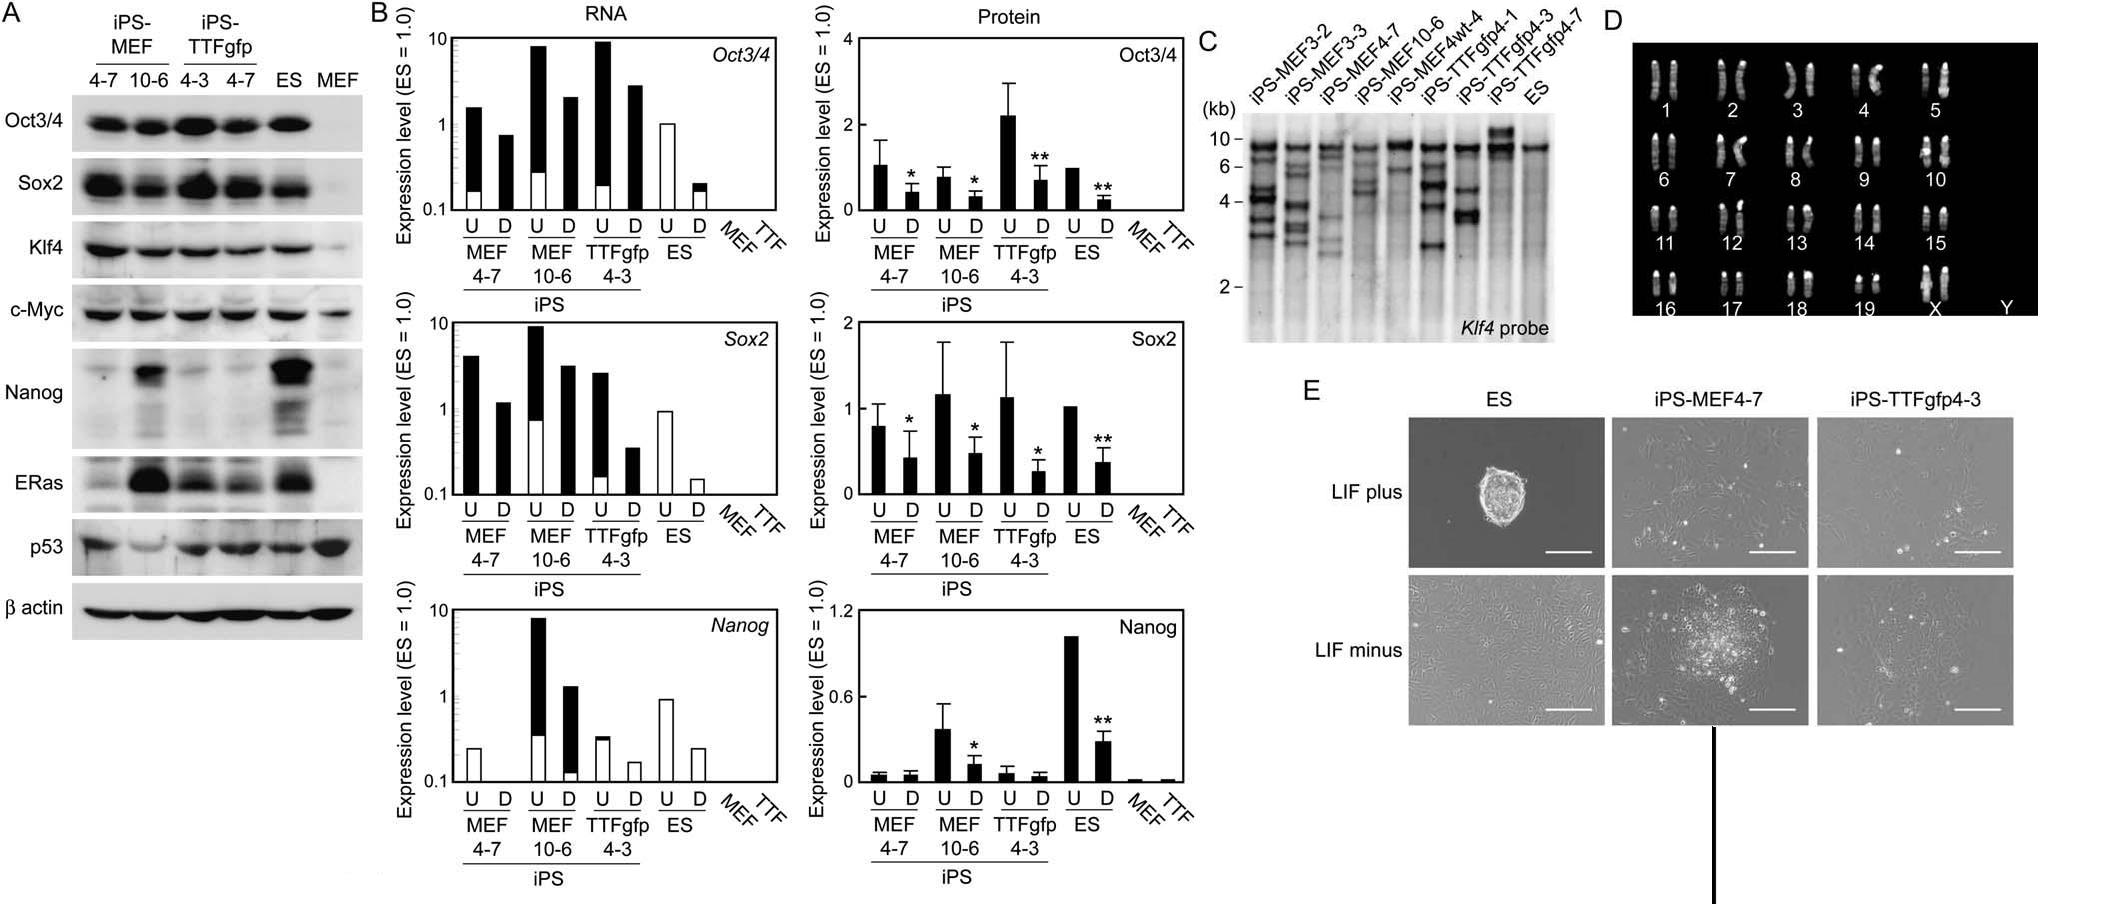
A-This is a western blot of the 4 factors selected earlier along with a few other proteins the authors viewed as important. ϐ-actin is a load control. Nanog is a protein that was thought by the authors to be essential to pluripotency due to its role in ES cells however the tests in this lab indicated that wasn’t true for our iPS strains. The western blot shows that the ES cells have more than double the Nanog of the iPS strain with the most, iPS-MEF10-6. ERas is a protein that is important in the tumor-like growth properties of ES cells. This protein is present in ES cells and all of the iPS strains, though iPS-MEF4-7 has a fraction of the ERas of the other two cells. p53 is a tumor suppressor protein that works to counteract tumor-like proliferation such as that found in ES cells. The most p53 is found in the MEF cells, with all the other strains having much less p53. This makes sense for the high, constant, tumor-like rate of growth of these strains as shown in figure 1D.
B-The top two graphs show the expression levels of Oct3/4 in the labeled cell lines. The units are set so that 1 is the relative unit assigned to undifferentiated ES cells. The RNA graph on the left shows endogenous RNA in white and transgenic in black. This presents a major difference between the ES cells and the iPS strains. The ES cells have much more endogenous RNA in the undifferentiated form and are the only strain with any endogenous RNA in the differentiated form. Generally, the protein levels are similar for Oct3/4 except the TTFgfp4-3 strain which has more than double the protein in the undifferentiated form of any other cell line. For Sox2, once again ES cells have all endogenous RNA in the undifferentiated form, and all but one iPS strain do not compare in endogenous RNA. However, iPS-MEF10-6 has a similar quantity of endogenous RNA, while it does have an equal amount of transgenic RNA. No transgenic RNA was in either the differentiated or undifferentiated ES cells. While the difference in protein levels is statistically significant, all the bars have ranges that are relatively close to that set by the ES cells, especially for cells derived from somatic cell lines. Nanog RNA levels are lower for endogenous RNA and this difference also corresponds to the protein levels. There is much more Nanog protein than any of the iPS cell lines. This is consistent with the findings from the difference seen in the western blot of Figure 7A and in the two prior RT-PCR analyses.
C-This southern blot shows the presence of a number of restriction sites. The same band of DNA coding for Klf4 is present in all of the iPS strains. The other bands, like was seen in figure 7B, are caused by transgenes that also contain the sequence recognized by the cDNA probe. This additional DNA is the major difference between the ES cells and these iPS strains as was also seen in Figure 7B.
D-The authors describe this as a normal IPS-TTFgfp4-2 karyotype. This female has all 23 pairs of chromosomes and 2 X chromosomes.
E-These photos show a major difference between iPS strains and ES cells. ES cells can survive off of LIF because they have an LIF receptor, one of the group III genes in figure 4B not found in the iPS strains. The iPS strains cannot survive off of this LIF, since they lack the receptor, and differentiate without any sort of feeder cell to help them survive.
Critical Analysis-
Overall, the study is compelling. The paper presents a number of constructs through a variety methods, some of which exhibit the desired properties of polipotency. The large number of constructs presented may confuse the reader in the paper's overall flow towards its purpose. In this section I will go on to address the issues I had with the Takahashi and Yamanaka's figureso.
Figure 1A-One component that is underutilized in this paper is the figure caption. Too much information is assumed to be understood and not enough is explained in the caption. For example in this figure, the reader’s assumed to figure out that the circle with the pointy surroundings is a somatic cell and the circle with a circle surrounding it is an iPS convert. However all this information could be understood much more easily with one sentence in the caption. Nearly all of the figures have this problem.
Figure 1B-The figure leads you to believe that Mock stands for some form of control, but neither in the discussion nor in the caption is the mock even referred to, let alone described. Without a control, it can’t be assumed that the experimental is the desired result.
Figure 1F-There are many methylations in the Oct3/4 promoter region. To better illustrate the change from the MEF cell line to each of the iPS cell lines the authors should use some sort of color. For example, if the cell in the upper left corner is methylated in MEF but isn’t in one or all of the iPS cell lines, this circle should not be white but instead could be blue in those lines where it has changed. This would allow the reader to more rapidly and succinctly evaluate the strains and the figure as a whole.
Figure 2A, B, and C-The authors are a bit too cut and dry in their evaluation of factors. In Figure 2A they set a rule that only those with zero at day 10 will make the cut to the next strain. However, factors 1 and 12 are very close to this hard cut line but the authors never even address them. This is a risk that these proteins may have ultimately been able to create a strain more similar to ES cells.
Figure 2A-The same problem exists in this figure as in 1B where the authors never address the mock nor is it ever described. Once again, this leaves no control to base the evaluation fo the experimental off.
Figure 2C-To stay consistent, the authors should have stuck with the factor numbers used before so that they could correlate 2A, B, and C better instead of labeling c-myc-, Sox2-, etc. The specific names could then be left to be described in the text or the figure caption.
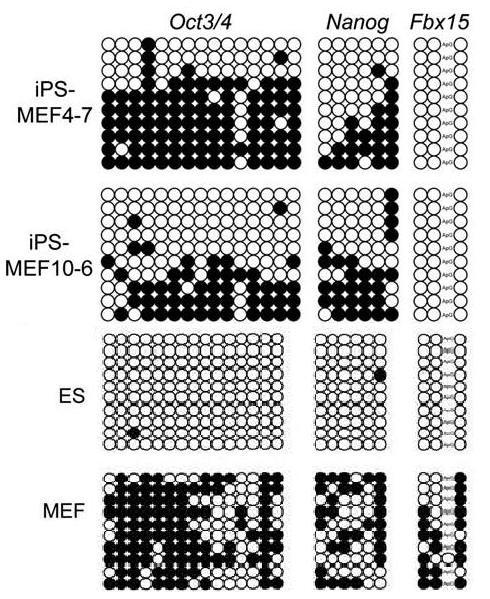
Figure 3C-It is interesting to compare these two strains against one another, but the analysis most beneficial to the paper's purpose requires comparing the strains to ES and MEF. Rather than forcing the reader to flip back and forth between Figure 1 and Figure 3 to make this examination, the authors should do one of two things. They should either place the ES and MEF data on both figures or consolidate all of the methylation data to one big figure. An example of placing the ES and MEF for easier interpretation is shown at left.
Figure 4-This figure is very appealing to the eye, but the inclusion of the MEF+4 factors, MEF+KRasV12, and the 3T3+HRasV12 strains was a mistake. These 3 strains are mentioned sparingly in the text and are never examined in great detail. They also differ greatly from all the other strains in their data except MEF. Therefore, in a figure where the median is critical to what color is displayed, these 3 strains skew the data and change the colors. This ultimately makes it more difficult to interpret differences between the 4 iPS strains, the MEF strain, and the ES strain.
Figure 5-These figures are all very beautiful however without any control images to go off of it leaves the reader without a vast knowledge of cell biology blind of any problems with the iPS cells’ ability to differentiate properly.
Figure 6B-In the nearly identical Figure 3A, MEF was a negative control for the iPS-MEF strains. It is puzzling that the authors did not provide TTF as a negative control for the same RT-PCR experiment using iPS-TTF strains. Without a negative control, the reader has no way of knowing that these RNA are not present in the TTF cells originally.
Figure 6D-This figure could use controls to ensure the gfp antibody is finding its desired target and not producing false positives.
Figure 7C-Once again there is no negative control present. Both MEF and TTF are candidates.
Figure 7D-The authors should provide a normal karyotype to compare with this iPS karyotype rather than forcing the reader to take the authors at their word that it is normal.
Modified Figure 3C |
Future Research
Future work should concentrate on trying to find similar results from human somatic cells. This research was concentrated on mice, likely due to the barriers to human embryonic stem cell use, but the results show that human research is needed. The procedure would be nearly identical; search for oncogenes or other genes commonly associated with stem cells and then narrow down the factors to try and create a strain. I would expect that many of the factors would be the same as in the mouse and that, with the same slightly limited success, iPS cells could be created from human somatic cells. As mentioned in the paper, human stem cells have a number of possible applications in the medical field. That is why ultimately this research should head in the direction of the medical field to treat diseases such as Parkinson’s and diabetes but this preliminary human research must be done first.