*Return to Michael Rydberg's molecular homepage*
Induction of Pluripotent Stem Cells from Mouse Embryonic and Adult Fibroblast Culture by Defined Factors
What they say...
Takahashi and Yamanaka begin their paper stating that somatic cells from mice can become ES cells by two methods. The first involves injection of the somatic cell's nucleus into an oocyte (an egg) (Wilmut et al. 1997 as cited in Takahashi and Yamanaka, 2006). The second process involves joining a somatic cell with an embryonic stem cell (Cowan et al. 2005; Tada et al. 2001 as cited in Takahashi and Yamanaka, 2006).
Their research began with the idea that genes essential to ES cells were possible "factors" that could be responsible for reprogramming the somatic cells. With that idea, Takahashi and Yamanaka selected 24 genes that were known to be active in ES cells. The team needed a simple way to identify cells that had been reprogrammed, and came up with a clever method involving antibiotic resistance. The mouse Fbx15 gene is activated primarily in ES cells. Takahashi and Yamanaka inserted a "Bgeo" cassette (conferring the neomycin antibiotic resistance gene and B-galactosidase) into this gene. Thus, the promoter for the antibiotic resistance gene would be active only if the cell was indeed exhibiting properties of an ES cell. Colonies were treated with the antibiotic G418; those that lived had turned on the Fbx15 promoter. Figure 1-A details the antibiotic construct that the team created; the image clearly depicts how the process works.
With a simple test in place to determine reprogramming, the team began to test various combinations of the 24 factors (genes) to see what combinations could reprogram mouse embryonic fibroblasts (MEFs). The factors were introduced using a retroviral vector. No gene was able to induce the changes by itself, indicating that a combination of these factors was needed. When all 24 factors were introduced simultaneously, 22 colonies were resistant to the antibiotic G418.
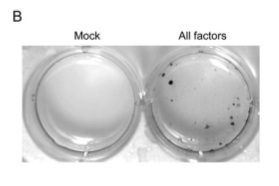
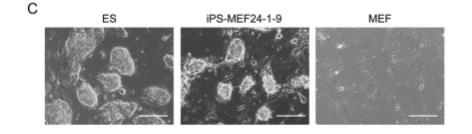
Figure 1-C eliminates the thought that these colonies survived by rapid proliferation of an advantageous mutation:
Figures 1-D, E, and F show more data that are intended to convince the reader that a functional change has taken place in these iPS cells.
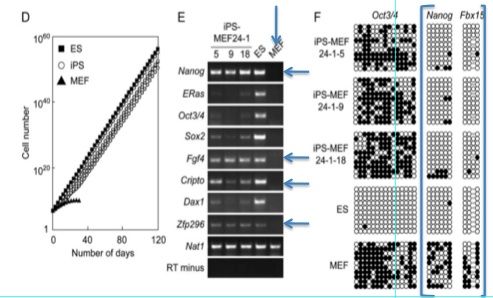
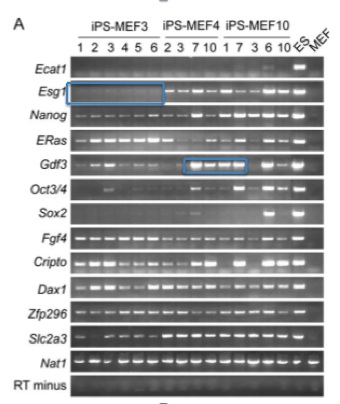
Figure 1-E is an RT-PCR analysis of genes that are common markers for ES cells. Notice that the negative control (MEFs - indicated by the vertical arrow) is perfect: no product has been detected and then amplified. The positive control is also standard. The horizontal arrows indicate genes where all iPS cells are transcribing the product. Many of the other marker genes seem to be expressed very weakly (if at all) compared to the ES cells. However, the only band we see on the MEF lane is for Nat1, the positive control. The iPS cells have clearly undergone some sort of change, and it looks consistent with ES cells.
Figure 1-F is a bisulfite genomic sequencing analysis of the promoters of various ES marker genes. This method tests for methylation of CG dinucleotides, which would indicate less activity (higher methylation leading to less transcription) ("Site Specific Promoter Methylation and Gene Silencing"). Closed circles represent methylation. Oct3/4 appears to be methylated as highly in iPS cells as in MEFs, and it is not methylated in ES cells. Notice the boxed region around the Nanog and Fbx15 promoters. iPS and ES cells show little methylation in either of these promoter regions, while the MEFs show heavy methylation. This is more evidence that the 24 factor genes did indeed convert the fibroblasts into iPS cells.
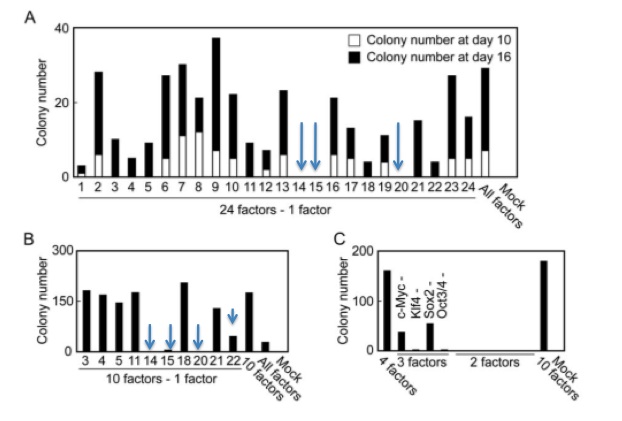
Figure 2-B shows the results of the experiment with the ten previously chosen genes. When 4 of these 10 genes were not transduced along with the other 9 genes, the number of colonies either significantly declined or the physical appearance of the cells did not indicate that these were truly reprogrammed ES cells. The removal of the c-Myc cancer gene produced this phenotype. The four genes (marked by blue arrows) that thus appeared to be absolutely critical towards inducing pluripotency were factors 14, 15, 20, and 22 (Oct3/4, Sox2, c-Myc, and Klf4). All four of these proteins are transcription factors.
Takahashi and Yamanaka attempted to eliminate even more factors involved in the conversion of MEFs to iPS cells. The results are shown in figure 2-C. 2-C shows that no combination of two genes was sufficient to induce antibiotic resistance, but that some combinations of 3 genes could produce colonies resistant to G418. Without transducing either c-Myc or Sox2, a number of colonies resistant to G418 survive. The number of G418 resistant colonies without either c-Myc or Sox2 is significantly lower than with all 4 genes, indicating that 4 genes are critical for the reprogramming.
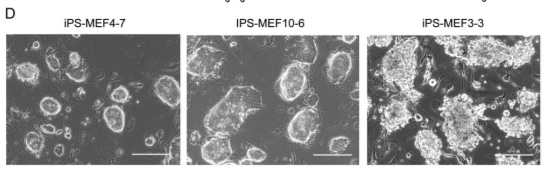
There appeared to be significant differences between the iPS-MEF3 cells that survived and all previous iPS cell lines, as evidenced in figure 2-D.
To further investigate the properties of iPS cells, Takahashi and Yamanaka explored the expression levels of various ES cell marker genes with a variety of techniques.
Figures 3-B and 3-C analyze the promoters of Oct3/4, Nanog, and Fbx15.
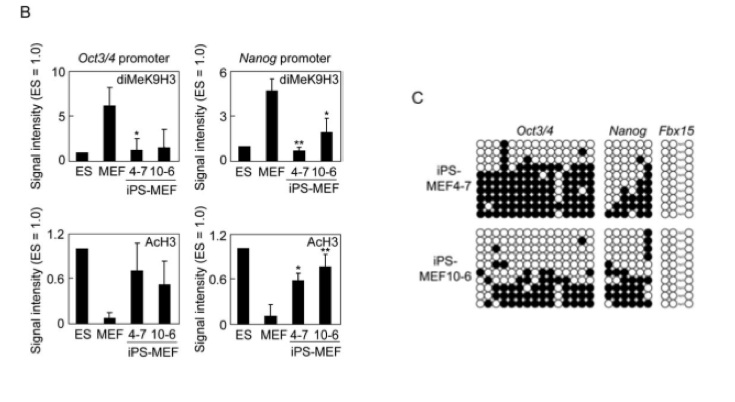
Figure 3-B analyzes promoters by measuring methylation and acetylation in the promoter sequences in ES, MEF, iPS-MEF4 and 10 cells. In all of the graphs, the ES and iPS cells seem to be inversely proportional to the MEF cells. Methylation of the promoters is high in the Oct3/4 and Nanog promoters in MEFs, and low in the ES and iPS cells. The acetlyation patterns appear to be the opposite. It is worth noting, however, that the graph on the bottom left shows no statistically significant differences (by their calculations, with p < .05). Thus, the differences may be slighter than the visuals would suggest.
Figure 3-C examines the promoter regions with a different method - genomic bisulfite sequencing. Dark circles represent methylation. Oct3/4 and Nanog are both partially methylated, and Fbx15 is not at all. There are no positive or negative controls here for us to compare these promoters to.
3-D (not shown) shows the results of stains with alkaline phosphatase. Alkaline phosphatase staining is a "stem cell membrane marker;" s such, a positive stain would indicate that the iPS cells are similar to ES cells in more than just gene expression levels ("Alkaline Phosphatase (AP) Staining of Stem Cells"). The results indicate that alkaline phosphatase is present in the cells.
The investigators continued their comparison of iPS, ES, and MEF cells with a DNA microarray analysis.
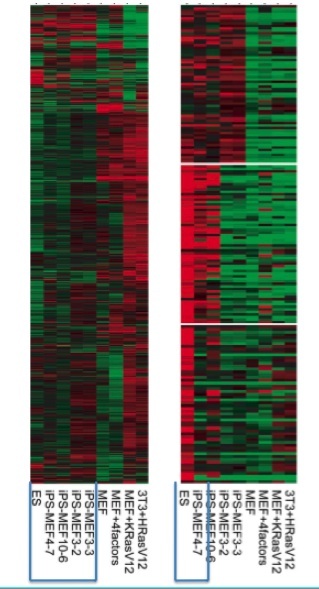
The preceding experiments all suggested that mouse embryonic fibroblasts were "induced pluripotent stem cells." The morphologies were similar, the activation of a promoter turned on in ES cells was conferring antibiotic resistance, and gene expression appeared similar. To function as actual embryonic stem cells, however, iPS cells must be able to differentiate into the 3 different germ layers (Evans and Kaufman, 1981; Martin, 1981, as cited in Takahashi and Yamanaka 2006). Their functional test involved injecting iPS cells into the mice and dissecting the tumors (teratomas) that formed. If the tumors contained tissues from all of the germ layers, the iPS cells would truly have gained pluripotency.
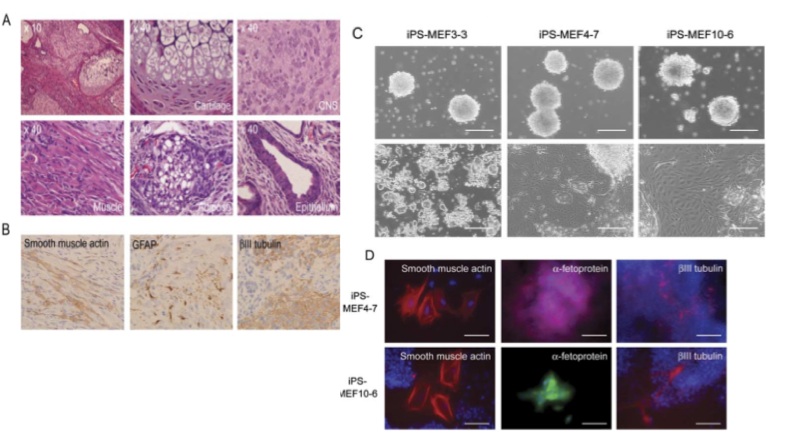
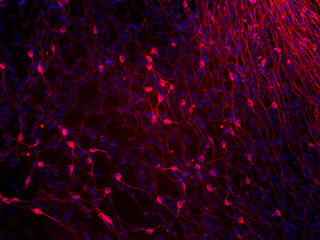
Figures 5-A through D show the results of experiments testing the pluripotency of the iPS cells. 5-A shows really stunning evidence for the case that iPS-MEF4 cells are in fact capable of differentiating. These tissues were found in a teratoma caoused by injection of the iPS-MEF4 cells and examined at 40X magnification. Starting at top left and moving clockwise, the images are of: the teratoma, cartilage, nerves, muscle, adipose (fat), and epithelium (skin). The tissues are physically very different from each other - this is strong evidence that iPS-MEF4 cells are pluripotent and have the ability to differentiate into different cell types.
5-B shows the results of an immunostain testing for differentiation into the 3 germ layers. The staining patterns are significantly different among the smooth muscle actin, GFAP, and BIII tubulin.
5-C shows the results of in vitro experiments testing the pluripotency of iPS-MEF3, 4, and 10 cells. In the upper row, iPS cells were grown in "noncoated plastic dishes." The large circular growths are embryoids. Each variety of iPS cell was able to form an embryoid. The bottom row shows cells that were grown on tissue culture dishes. Pluripotent cells were able to differentiate. iPS-MEF3 cells do not appear to have differentiated - they appear exactly the same as in figure 2-D. iPS-MEF4 and 10 cells, however, appear able to differentiate; different cell types have appeared.
Figure 5-D shows the results of an immunostain performed on the pluripotent iPS-MEF4 and 10 cells shown in 5-C. The antibodies used for this stain were anti-smooth muscle actin (mesoderm), anti-fetoprotein (endoderm), and anti-beta3 tubulin (ectoderm). The difference in color in the fetoprotein stains was due to the use of secondary antibodies labeled differently. The evidence in these figures is simply stunning. iPS-MEF4 and 10 cells are pluripotent: they possess the capability of embryonic stem cells to differentiate into any of the three germ layers in mice or the lab.
Takahashi and Yamanaka next decided to attempt to induce pluripotency in adult tail-tip fybroblasts (TTFs) through transduction of the same 4 genes. Additionally, they chose to insert the 4 genes into TTFs that expressed GFP, which would allow for easy visualization of the cells.
Figure 6-A shows an image of the iPS-TTFgfp4. These cells look very similar to earlier iPS-MEF4/10/24 cells, and wild type ES cells. For that reason, the figure will not be included in this review.
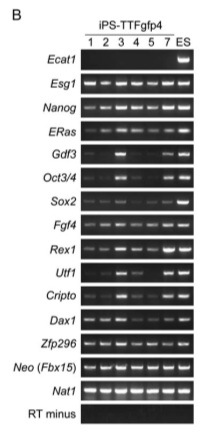
Figure 6-B is an RT-PCR analysis of gene expression in the iPS-TTFgfp4 cells.
Having iPS cells that expressed GFP allowed Takahashi and Yamanaka to do some fascinating work with iPS cells and embryonic development. iPS-TTFgfp4 cells were injected into blastocytes; the development of the embryos and the activity of the iPS cells were monitored.
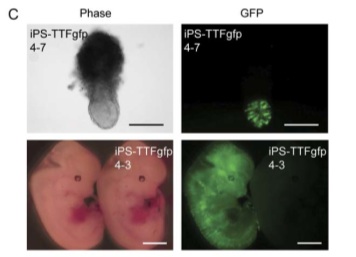
Figure 6-C shows the results of a fascinating experiment. iPS-TTFgfp4 cells were injected into blastocytes. The bottom right image shows an embryo with GFP expression spread throughout the entire body. This is incredible visual evidence that these cells can differentiate and take on different roles throughout the organism, especially in embryo development.
Figure 6-D shows the results of an immunostain of the GFP expressing embryo pictured above in 6-C. The brown comes from the anti-GFP antibody, while the rest of the cells have been stained blue.
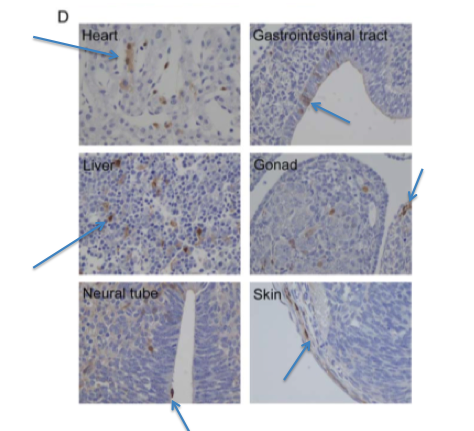
The arrows point out noticeable regions of brown (regions where GFP is
found within the cells). GFP is clearly being expressed in a variety of
cell types - heart, neural tube, skin, gonad, liver, and the
gastrointestinal tract. The only way that this could happen is if the
iPS-TTFgfp4 cells injected into the blastocyte differentiated into
these cell types. This is more compelling evidence that even adult
cells can be reprogrammed to become pluripotent through these 4 genes.
More data is presented in the discussion. Figure 7-A is a western blot of proteins from the ES marker genes. The iPS-TTFgfp and iPS-MEF cells are more simlar in their expression of these proteins to ES cells than to the negative control, MEFs. This data confrims what we saw in the numerous RT-PCR analyses of transcription in the iPS cells. Many of the ES marker proteins are being translated in iPS cells.
Figure 7-B quantifies the data on transcription and translation by measuring changes in transcription/translation products. 7-C is a southern blot with a Klf4 probe. 7-D is a karyotpye of an iPS-TTF cell, and 7-E shows images of the cells. This data does not provide any more significant information on the induction of pluripotent stem cells, and will not be discussed further.
In figure 1-C, growth curves of iPS-MEF24, ES, and MEF cells are examined. After 120 days (80 days after the MEFs died out), the number of cells is enormous. 1 strain of iPS cells appear to have almost exactly the same number of cells as the ES line, but the other two lines were below. Due to the large order of magnitude change that a small jump on the y-axis could have, statistical information regarding the differences in cell numbers between all three lines would be useful. If they are not statistically different, that is fine, but if they are, this is an aspect of iPS cells that could merit future studying as these cells may become produced on large scales. Also, a difference here may mean these cells are not as fit as wild type ES cells. This could be worrisome for future medical applications.
Takahashi and Yamanaka narrowed the gene pool down from 24 to 10 by systematically introducing every gene but the one in question. They chose the genes to continue with by counting the number of colonies at day 10 - the ten that decreased the number of colonies most significantly were chosen to continue. The researchers continued counting colonies until day 16. With that step already in place, it seems illogical to not choose the genes after day 16. For example, the removal of gene 1 resulted in far fewer colonies after 16 days than genes 4, 5, or 21, all of which were chosen for the 10 gene pool. Gene 1 could have been an incredibly important factor in reprogramming the cells. These researchers may have been under heavy pressure to publish, and this choice seems to imply that.
Figure 3-C analyzes a promoter sequence for methlyation by the genomic bisulfite sequencing method. These graphs show Oct3/4, Nanog, and Fbx15 promoters for iPS-MEF4 and 10 cells. A positive control (ES cells) and a negative control (MEF cells) would be extremely useful in analyzing this information. Without those controls, we cannot see if methylation of the promoter sequences has changed from MEF to iPS cells or if the methylation patterns of an iPS cell match up with the ES cell. This would have been incredibly easy to fix, and would have improved this figure significantly.
Figure 5-C (depicting in vitro embryoid formation and differentation) also suffers from lack of controls. This again robs us of the chance to make some really useful comparisons. Seeing the images of the supposed differentiated iPS cells - while visually convincing - could be better if we saw that they exactly replicated the behavior of ES cells grown under the same conditions.
There is one other small issue with figure 5-C. In the immunostain for the fetoprotein, the researchers labeled their secondary antibodies with different colors for the two iPS lines. This procedure was not done for the other two proteins, making this an unnecessary confusion. If at all possible, it would have made much more sense to attempt to provide the same image.
In the RT-PCR analysis shown in figure 6-B, there is no negatice control. A very obvious choice would have been TTF cells - in parallel RT-PCR analyses done for iPS-MEF cells, MEFs were used as negative controls. Without this negative control, it is hard to take anything conclusive from the data. Yes, these cells appear similar in their gene expression to the ES cells and the other iPS cells, but it is formally possible that the TTFs do as well.
These are some of the problems that I noticed with this paper. The criticisms, while important, do not make me question the validity of their findings. Takahashi and Yamanaka have provided an outstanding amount of evidence that their iPS cells are pluripotent and resemble ES cells.
Despite the few criticisms that I have pointed out, this was an excellent paper. The science was very solid, and it left me convinced that these 4 genes could induce pluripotency in embryonic or adult cells. The real question now lies in what needs to be explored next.
Goal 1) Creating human iPS cells
Research in model organisms often has tremendous implications on the lives and health of humans. Indeed, these projects would probably not be funded if there was no chance of applying these findings to human health. The creation of human iPS cells would be my first priority. I would attack this problem in much the same way that Takahashi and Yamanaka did. The first step would be identifying the "factors," genes that are involved in the maintenance of embryonic stem cells in humans. How could we find these genes?
a) A microarray analysis of human embryonic stem cells
A microarray analysis of human ES cells would provide us with information about gene expression. Comparing these cells to control cells should give us a good idea of which genes are transcribed in ES cells and not in skin or blood cells, for example. Heat mapping and statistical analysis would indicate genes of interest that should be pursued as possible factors.
b) An Orthology approach
It is quite possible that some of the 24 genes that were "factors" in mice could play a similar role in humans. Finding orthologs of these genes (through programs such as BLAST or ClustalW) would give us a possible starting pool with which to work.
Once a pool of genes has been assembled, methods similar to those of Takahashi and Yamanaka would be employed. The genes would be introduced into an adult human cell (a blood cell, for example) using a retrovirus or some other method. Other possibilities include DNA packaged directly inside liposomes or other new vector technologies. The pool could be narrowed down using the same "remove one and observe" method. If adult human cells could be reprogrammed, then this would be an optimal way to discover which genes are involved in the process. Obviously, the histological examination of tumors caused by injection of iPS cells into humans would not be ethical or feasible. In vitro examinations of differentiability would have to be performed. Human iPS cells could be grown on tissue culture dishes and culture samples analyzed for signs of differentiability.
A significant amount of experimental work would have to be done before any medical applications could be explored in humans. The safety of these cells would have to be thoroughly explored in model organisms such as mice.
Goal 2) Examine the long term safety and functionality of iPS cells in mice
Studying the long-term functionality of iPS cells in mice would be absolutely crucial for future medical applications in humans. An experiment such as this could begin with injecting iPS cells into mouse blastocytes. GFP could be used as a reporter protein (in much the same way it was here) to determine which embryos contained differentiated iPS cells. This experimental group would be raised against a control group of mice. The long term health of the mice would be carefully monitored. Do these cells "break down" and stop working at a certain age, causing early degeneration and death, or do these mice live as long as normal mice? Are tumors found in every injected mouse? Illness, fitness and behavior would have to be monitored carefully. Apparently, this team has already been able to induce pluripotency without the use of the c-Myc gene (Cherfas 2010). This is critically important - c-Myc is a cancer gene, and could pose major threats to human health. This is already one step towards making iPS cells safer for future human use.
Goal 3) Test iPS cells for medical functions in mice
We already have mouse models for many devastating human diseases, and embryonic stem cells seem to hold tremendous promise for the treatment of numerous diseases. Thus, we need to begin testing the effects of iPS cells on some diseases that medicine hopes can be cured or treated by ES cells.
Leukemia is currently treated by stem cells in the form of a bone marrow transplant ("Stem Cell Therapies Today"). Because this disease is already treated by stem cells, it seems logical that iPS cells could be tested on a leukemia model. This would provide an excellent control (normal stem cell treatment) against which to compare the effectiveness of iPS cells. The first step would be to find a mouse model of the cancer. Then, iPS cells would be injected into the body in the same way that the bone marrow transplant takes place. iPS cells could be tested (through injection) on a number of mouse disease models that could be treated with stem cells. If the iPS cells produce similar gains in the diseased mice as the normal ES injection, we would be well on our way towards the ultimate goal of treating human disease with iPS cells.
Goal 4) Basic Research - Understand how these 4 genes are capable of reprogramming cells
This question is fascinating by itself and clearly has larger applications than simply basic research. The goal of this research would be to find out more about how these 4 genes can reprogram a cell trhough introduction into embryonic and adult cells. We already know that they are transcription factors. There are some methods we could use to find out what these factors bind. One method is immunoprecipitation. We would need to develop monoclonal antibodies for these 4 proteins (which would be done with the standard method detailed here.) We could then simply immunoprecipitate with these antibodies. The protein of interest would be attached, as would anything binding this protein (since it is a transcription factor, we would probably find DNA). Isolation and sequencing of the DNA fragment would allow us to identify what gene this protein is activating. Through many coimmunoprecipitations, we could determine the pathways these 4 genes act in.
Additionally, these proteins may be modulated through interactions with other proteins. A yeast two-hybrid system (using one of these 4 proteins as the "bait") could allow us to identify interacting proteins. These basic research questions could enhance our understanding of the induction of pluripotency and thus how to create safer and more effective iPS cells.
References:
Cowan C., Atienza J., Melton, D., Eggan K. 2005. Nuclear reprogramming of somatic cells after fusion with human embryonic stem cells. Science 309: 1369–1373.
Evans M., Kaufman, M. 1981. Establishment in culture of pluripotential cells from mouse embryos. Nature 292: 154–156.
Martin, G. 1981. Isolation of a pluripotent cell line from early mouse embryos cultured in medium conditioned by teratocarcinoma stem cells. PNAS USA 78: 7634–7638.
Tada M., Takahama Y., Abe K., Nakatsuji N., Tada, T. 2001. Nuclear reprogramming of somatic cells by in vitro hybridization with ES cells. Current Biology 11: 1553–1558.
Takahashi K., S. Yamanaka. August 2006. Induction of pluripotent stem cells from mouse embryonic and adult fibroblast cultures by defined factors. Cell 126(4): 663-676.
Thomson J., Itskovitz-Eldor J., Shapiro S.S., Waknitz M.A., Swiergiel J., Marshall V., Jones, J. 1998. Embryonic stem cell
lines derived from human blastocysts. Science 282: 1145–1147.
Wilmut I., Schnieke A., McWhir J., Kind A., Campbell, K.H. (1997). Viable offspring derived from fetal and adult mammalian cells. Nature 385: 810–813.
Stem Cell Terhapies Today. 2010. Genetic Science Learning Center. <http://learn.genetics.utah.edu/content/tech/stemcells/sctoday/>. 29 April 2010.
Alkaline Phosphatase (AP) Staining of Stem Cells. 4 February 2009. Protocol Online <http://www.protocol-online.org/prot/Cell_Biology/Stem_Cells/Analysis_and_Identification_of_Stem_Cells/Alkaline_Phosphatase__AP__Staining_of_Stem_Cells/index.html>. 30 April 2010.
Cherfas, Jeremy. 2010. Working Out the Various Factors in iPS Cell Generation. scienceWATCH.com. <http://sciencewatch.com/ana/hot/bio/10janfeb-bio/>. 30 April 2010.
Site Specific Promoter Methylation and Gene Silencing. Biology Online. <http://www.biology-online.org/articles/biological_significance_dna_methylation/site-specific_promoter_methylation_gene.html>. 27 April 2010.
***Please send any comments or questions to Michael Rydberg***