*This website was produced as an assignment for an undergraduate course at Davidson College.*
In the article "Induction of pluripotent stem cells from mouse embryonic and adult fibroblast cultures by defined factors," Takahashi and Yamanaka reprogram differentiated cells to an embryonic-like state by transferring the nuclear contents of the differentiated cells into oocytes or by fusing them with embryonic stem cells. Takahashi initially hypothesized that the factors playing important roles in conferring the identity of embryonic stem cells would likewise play a significant role in inducing pluripotency in somatic cells. They selected 24 candidate genes and developed a novel assay system using a beta-geo cassette and the Fbx15 locus to determine which genes were most relevant through G418-resistant colonies. They determined that a combination of four factors - Oct3/4, Sox2, c-Myc, and Klf4 - could induce pluripotency in somatic cells. Moreover, these four factors were able to induce teratoma formation of all three germ layers and form embryoid bodies, two crucial characteristics of natural pluripotent stem cells.
iPS cells (induced pluripotent stem cells): type of pluripotent stem cell that is artificially derived from a non-pluripotent cell (ex. adult somatic cell) by inducing a "forced" expression of certain genes
ES cells = embryonic stem cells
Teratoma: a tumor with tissue components resembling normal derivatives of all three germ layers (mesoderm, ectoderm, endoderm)
Figure 1A: This figure shows a schematic of the assay system that the authors used in identifying the induction of the pluripotent state. They inserted a beta-geo cassette downstream of the Fbx15 gene through homologous recombination (beta-geo is a fusion of the beta-galactosidase and neomycin resistance genes). When the construct (5'LTR-cDNA-3'LTR) is transduced into the cells, and the Fbx15 gene is transcribed, the cells will exhibit the characteristic blue color of beta-galactosidase and will also be resistant to G418, a broad-spectrum antibiotic. Thus, induction of the pluripotent state will result in blue colonies on a G418-coated surface.
Figure 1B: This figure shows the result of the assay system from Figure 1A. The 'mock' plate shows cells that were transduced with only one of the 24 candidate factors; there is no growth on the plate, indicating that there is no induction of the pluripotent state and that the cells are susceptible to G418 antibiotics. The 'all factors' plate includes all 24 candidate factors that the authors believe are important in pluripotency. When all 24 candidate factors were transduced together, there were 22 G418-resistant colonies, indicating that some combination of these factors is sufficient to induce pluripotency.
Figure 1C: This figure shows the morphology of embryonic stem (ES) cells, iPS cells selected from the plate in figure 1B, and mouse embryonic fibroblasts (MEFs). Note that the iPS cells strongly resemble the ES cells - round shape, large nucleoli, and scant cytoplasm.
Figure 1D: In order to further characterize the iPS-MEF clones, the authors created the growth curves of the ES cells (square), iPS cells (circle), and MEFs (triangle). The doubling time of the iPS cells was equivalent to that of the ES cells. Furthermore, the growth of the MEF cells trails off around the 35th day, while the growth of the iPS and ES cells continue to grow similarly throughout the entire 120 days.
Figure 1E: This figure shows an RT-PCR analysis of eight ES cell marker genes in iPS cells. An RT-PCR uses an agarose gel to visualize RNA strands that have been reverse transcribed into their DNA complements. RT minus serves as the negative control and Nat1 as the positive loading control. Note that the bands for Nat1 are equivalent, which allows us to take the rest of the data at face value. Lanes 1-3 show various iPS clones, lane 4 shows ES cells (also serves as a positive control), and lane 5 shows MEF (negative control for the candidate genes). It is clear that the iPS clones express all eight of the ES cell markers, albeit at varying degrees of expression.
Figure 1F: This figure shows the output of bisulfite genomic sequencing of the promoter regions of Oct3/4, Nanog, and Fbx15 in iPS cells, ES cells, and MEFs. Open circles represent unmethylated CpG dinucleotides while closed circles represent methylated CpG dinucleotides. As shown, the promoters of Fbx15 and Nanog were demethylated in iPS cells, while the Oct3/4 promoter remained methylated. These results indicate that some combination of these 24 candidate factors induce the expression of ES cell marker genes in MEF culture.
Figure 2A: This figure exhibits the number of G418-resistant colonies that grew when one of the 24 candidate factors were removed from the entire pool of candidate factors. The x-axis indicates which factor was removed; 'all factors' represents all 24 factors transduced, while 'mock' serves as a negative control. The y-axis shows the number of G418-resistant colonies that grew; note that the white bar indicates the colony number at day 10, while the black bar indicates the colony number at day 16. The graph shows that there are 10 factors whose removal resulted in no colony formation by day 10: factors 3, 4, 5, 11, 14, 15, 18, 20, 21, 22.
Figure 2B: This is a similar figure to 2A, but only deals with the ten factors they identified as resulting in no colony formation by day 10 in figure 2A. Again, Takahashi removes each individual candidate factor from the entire bulk transduction of ten factors to identify which of the ten factors is most important in colony formation. Note that factors 14, 15, 20, and 22 had little or no G418-resistant colony growth. These factors correspond to Oct3/4, Klf4, Sox2, and c-Myc, and indicate that they play significant roles in inducing the pluripotent state in MEFs.
Figure 2C: This figure shows the number of G418-resistant colonies grown after various combinations of 2, 3, and 4 factors were transduced into cells. Note that no combination of two factors yielded colonies, only several of the three-factor combinations yielded colonies, and the most number of colonies was a result of a combination of four factors (Oct3/4, Klf2, Sox2, c-Myc). The combination of four factors resulted in almost the same number of colonies as the sample with all ten factors transduced.
Figure 2D: This figure shows the morphologies of the clones from various samples of iPS cells. The first number after 'iPS-MEF' indicates how many candidate factors were transduced to produce that clone. For example, iPS-MEF4-7 indicates that this particular clone was a result of a combination of four candidate factors. Likewise, iPS-MEF10-6 was a result of a combination of ten factors, while iPS-MEF3-3 was a result of a combination of only three factors. It is important to note in this figure that iPS-MEF3-3 had different morphology from that of iPS-MEF4-7 and iPS-MEF10-6. iPS-MEF3-3 showed a flatter, non-ES-cell-like morphology, with rough surfaces.
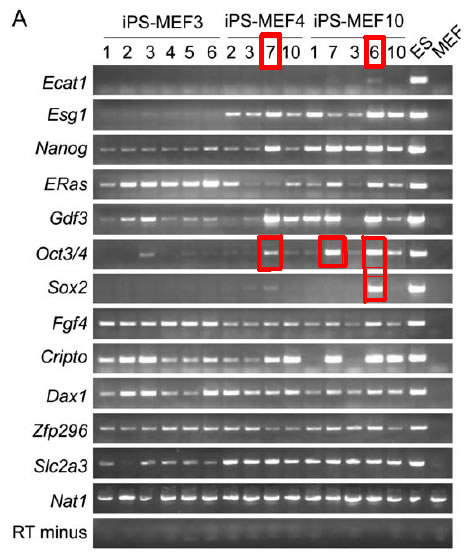
Figure 3A: This figure is similar to figure 1E, but an expanded version of the RT-PCR analysis with all three types of iPS cells (combination of three, four, and ten candidate factors). Again, the RT minus on the bottom row serves as the negative control, while the Nat1 just above RT minus serves as the positive loading control. ‘MEF’ in the rightmost column is the negative control for the ES marker genes, while ES cells are the positive control for all the marker genes. Notice that iPS-MEF4 and iPS-MEF10 express the majority of the marker genes, except for Ecat1. iPS-MEF3 express the majority of the markers except for Ecat1, Esg1, and Sox2. Notice in the diagram that the Oct3/4 expression in iPS-MEF4-7, iPS-MEF10-6, and iPS-MEF10-7 is much higher than the other clones, and that Sox2 is only expressed in iPS-MEF10-6. For the remainder of figure 3, Takahashi focuses on specifically iPS clones 4-7 and 10-6 since it seems they represent the most induced pluripotent state.
Figure 3A. RT-PCR analysis of iPS clones of combinations of 3, 4, and 10 marker genes. Notice that Oct3/4 expression is higher in clones of iPS-MEF4 and iPS-MEF10 (red). Also, Sox2 expression is only observed in iPS clone 10-6 (green). In the rest of figure 3, the authors will focus experiments on iPS-MEF4-7 and iPS-MEF10-6 (blue).
Figure 3B: This figure shows the results of a chromatin immunoprecipitation analysis, in which the intensities of the Oct3/4 and Nanog promoters are measured in ES, MEF, and iPS clones 4-7 and 10-6. The MEF signal intensity is used as the baseline to which the other signals are measured and compared. There is a significant decrease in the dimethylation of lysine 9 of histone 3 of both promoters. Furthermore, there is increased acetylation of histone 3 in both promoters, but only the Nanog promoter yielded significant values in the iPS clones.
Figure 3C: This figure shows bisulfate genomic sequencing for the DNA methylation status of iPS clones 4-7 and 10-6. The promoters of Oct3/4 and Nanog are only partially methylated in iPS clones 4-7 and 10-6, while the Fbx15 promoter is demethylated in the iPS clones.
Figure 3D: This figure shows the iPS-MEF clones 4-7 and 10-6 that are stained with a mouse monoclonal antibody against SSEA-1 and also an alkaline phosphatase kit. The top row is immunofluoresence of SSEA-1, which is a stage-specific embryonic antigen and a surface marker of stem cells. The bottom row is stained with alkaline phosphatase, which is a stem cell membrane marker. Usually, elevated expression of AP is associated with undifferentiated pluripotent stem cells. The positive results demonstrate that the clones of iPS-MEF4 and iPS-MEF10 are similar to ES cells.
Figure 4A: This figure shows global gene expression analysis through DNA microarray (more information on DNA microarray). The authors used nine different samples and over 10,000 probes to compare the gene expression profiles, and found that iPS cells are clustered quite closely with ES cells. It is clear that there are two separate groups of cells, as distinguished by the teal box (ES and iPS cells) and the magenta box (fibroblasts and its derivatives).
Figure 4B:In a second microarray analysis, the authors found that the cells could be split into three different groups according to which genes are more upregulated. Group 1 represents genes that were mostly upregulated in iPS and ES cells: Myb, Kit, Gdf3, and Zic3. Group II represents those genes that were more upregulated in ES, iPS-MEF4-7, and the iPS-MEF10 clones over iPS-MEF3 clones: Dppa3, Dppa4, Dppa5, Nanog, Sox2, Esrrb, Rex1. Group III represents those genes that were more upregulated in ES cells than in iPS cells: Dnmt3a, Dnmt3b, Dnmt3l, Utf1, Tcl1, LIF receptor.

Figure 4. DNA microarray analysis of global gene expression. Note that iPS cells and ES cells are closely related in part A (teal), and quite different from fibroblasts and its derivatives (magenta).
Figure 5A: Because teratoma formation is a hallmark of pluripotent stem cells, the authors explored the degree of pluripotency of iPS cells by subcutaneously injecting mice. This figure shows the histology of various samples of teratoma. Notice that the teratoma tissue has differentiated into all three germ layers, including cartilage, epithelium, adipose, muscle, and neural tissues.
Figure 5B: The authors chose to confirm differentiation of the teratomas into the three germ layers by immunostaining. The first panel is with a smooth muscle actin antibody, which represents a marker for myogenic soft tissue tumors and smooth muscle differentiation. The second panel is with glial fibrillary acidic protein antibody, which is a specific biomarker for neural glia and neural tissue. The third panel is of beta-3-tubulin antibody, which is a marker for neural tissue as well. Note that each panel is positive for the antibodies, indicating that the teratomas have indeed differentiated into all three germ layers.
Figure 5C: Embryoid body formation is another characteristic of embryonic stem cells. The authors found that all iPS clones (3, 4, 10 factors) formed embryoid bodies in vitro (top panel). However, only iPS-MEF4-7 and iPS-MEF10-6 differentiated into three germ layers, while iPS-MEF3-3 remained undifferentiated. Thus, iPS-MEF4 and iPS-MEF10 clones are confirmed as pluripotent stem cells while iPS-MEF3 clones are nullipotent.
Figure 5D: The authors chose to confirm differentiation of iPS-MEF4-7 and iPS-mEF10-6 through immunostaining. The first column uses a smooth muscle actin primary antibody, which fluoresced due to the Cy3 red secondary antibody applied to the sample; there is clearly SMA present in the tissue, indicating that the embryoid body differentiated into mesoderm. The second column shows alpha-fetoprotein, which is an endoderm marker. The secondary antibody used in iPS-MEF10-6 was Alexa488 (green), and it is apparent that the endoderm marker is present. Finally, the third panel uses a beta-3-tubulin antibody, which is an ectobderm marker. It is also clear that the embryoids have differentiated into ectoderm.
Figure 6A: This figure shows the morphology of the iPS cells when the four selected factors were introduced into tail-tip fibroblasts. Note that these cells are indistinguishable from ES cells.
Figure 6B: This shows an RT-PCR analysis of the clones generated when the four selected factors (Oct3/4, Sox2, c-Myc, Klf4) were introduced into tail-tip fibroblasts. Notice that only clones 3 and 7 express the majority of the marker genes at a high level, while the other clones express the marker genes at lower levels. It is interesting that Nanog is expressed at high levels in all the clones, yet isn't one of the four selected factors that contributes to induction of pluripotency.
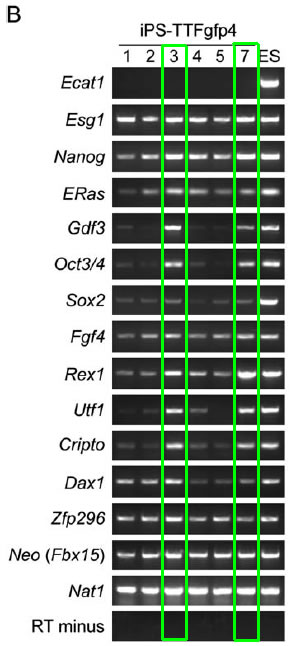
Figure 6B. RT-PCR analysis of iPS cells that were developed from tail-tip fibroblasts. Note that clones 3 and 7 (green) express the majority of the marker genes at high levels compared to the other clones.
Figure 6C: This figure shows the embryonic development of blastocysts that were microinjected with 2 clones of iPS-TTFgrp4 cells. The left panels show the appearance of the embryos under phase contrast, while the right panels indicate any GFP-positive iPS cells. Note that the presence of GFP-positive iPS cells in both samples indicate that the four selected factors can induce pluripotent cells from adult mouse fibroblast cultures.
Figure 6D: As a further step, the authors used the chimeric embryo iPS-TTFgfp4-3 to confirm differentiation into all three germ layers. This figure shows the histological analysis of cross sections of the tissue stained with anti-GFP antibody (brown) and eosin (blue). There is a clear presence of GFP-positive cells in the various tissues of the chimeric embryo.
Figure 7A: This figure shows a Western blot of the various iPS lines generated and the expression of the marker genes. Beta-actin serves as the loading control. Note that the expression of the four selected factors (Oct3/4, Sox2, Klf4, c-Myc) were of similar amount to ES cells. It is interesting that the protein expression of Nanog is not nearly as high in iPS cells as in ES cells, considering that previous RT-PCR analyses indicate that Nanog is expressed in all iPS clones. It is also intriguing that c-Myc is expressed in MEF cells, yet MEF cells do not express any other marker genes.
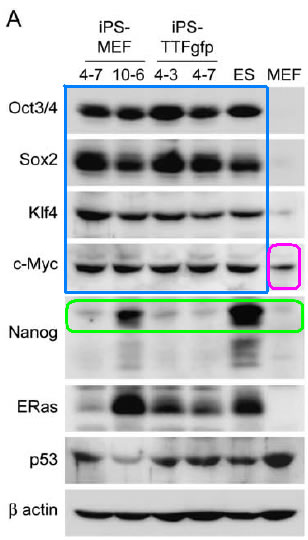
Figure 7A. Western blot of marker gene protein expression in iPS clones, ES cells, and MEF cells. Note that the protein express of the four selected factors is similar in amount to that of ES cells (blue). It is interesting that the Nanog gene does not have much protein expression considering its mRNA expression through RT-PCR analysis was relatively strong (green). Note that there is an unexplained c-Myc protein expression in MEF cells (magenta).
Figure 7B: This figure shows the quantification of the mRNA and protein expression of Oct3/4, Sox2, and Nanog. The quantification of mRNA was done through RT-PCR, while that of protein was done through Western blot. It is apparent that upon differentiation in vitro, there is a decrease in the total mRNA expression levels of Oct3/4 and Sox2. Furthermore, the mRNA expression of both Oct3/4 and Sox2 were higher than that of ES cells. The protein levels of Oct3/4 and Sox2 upon differentiation also decreased, but to relatively the same amount as ES cells.
Figure 7C: This is a Southern blot of various iPS clones using the Klf4 probe. This figure illustrates the unique integration patterns of the transgenes into the iPS clones. Notice that no two iPS cells have the same banding pattern for the Klf4 probe
Figure 7D: Karyotype analysis of iPS-TTFgfp4-2 clone. Note that the normal karyotype is 40XX.
Figure 7E: In order to dispel the notion that the iPS cells were created due to contamination from pre-existing ES cells, the authors grew the iPS cells without feeder cells and looked for differentiation. They also used LIF, which is leukemia inhibitory factr, which has the ability to induce differentiation of different types of target cells. They found that with or without LIF, the iPS cells stayed differentiated, which helped dispel the notion of contamination.
I believe this paper provides a strong convincing argument for the induction of pluripotent stem cells from mouse embryonic or adult fibroblasts. Takahashi and Yamanaka provided a coherent and thorough presentation of their data, with a fluid story to support their claims. Their approach in selecting the four candidate factors began as a broad characterization of 24 marker genes. They created a fail-safe assay system in which they could detect induction of pluripotency through two positive results - presence of colonies and blue colonies. In addition, they provided morphological and histological proof that the iPS clones they created were indeed physically similar to embryonic stem cells. Furthermore, they provided definitive and distinctive evidence through both mRNA and protein methods. I was most impressed with how the authors systematically narrowed their search of 24 marker genes to only four factors. In addition, I liked how for every result, the authors validated and supported it with another positive result. Figures 5C&D show additional immunostaining to validate and confirm the differentiation that they claim has occurred in part C. Ffigures 6C&D provide histological samples to validate the differentiation of chimeric embryos into the three germ layers. But despite their coherent results and explanations, I still felt there were additions which would have made their evidence even stronger.
In the RT-PCR analysis in figures 1E and 3A, it seemed that there were several rows of data which had a clear difference in the background color, indicating that there were varied exposure times. Longer exposure times might create a brighter and more detectable band and vice versa, which may detract from the believability of the data. In addition, in figure 3B, I was initially misled by the data where it shows the intensities of the Oct3/4 and Nanog promoters because the y-axis labeling was different. While they are different promoters, the different values on teh y-axis on the top panel did not allow comparison of the Oct3/4 and Nanog promoters against each other. I would have liked to see the ES and MEF controls in figure 3C of the bisulfite genomic sequencing. They show these controls in figure 1F, which helps provide baseline data on what might be significant in the experimental samples. Also, I would like to see larger views of figure 3D. Rather than only seeing the diagram of one cell, I believe seeing a larger view would provide a bigger sample size. In addition, I had a lot of trouble understanding the purpose of figures 7C-E. While I understand that they wanted to observe the transgene insertion pattern and the karyotype, it seems that these three figures do not flow with the rest of the article. They seem to be more miscellaneous data that was thrown in as an afterthought.
Lastly, in figure 7C, I was initially confused as to why the authors only used a Klf4 probe for the Southern blot. Why not include more probes, especially those of the other three selected factors, which would provide more data on the integration patterns of the transgenes.
There is no question that this article is groundbreaking in every aspect - it is directly generating pluripotent cells without using any embryonic material. Induced pluripotent stem cells offer an unparalleled potential for disease research amd regenerative medicine, especially since iPSCs are genetically identical to their derived cells so they would avoid immune rejection.
In the discussion, Takahashi and Yamanaka speculate that high amounts of the four factors are required in the initial stage of iPS cell generation. I believe that it would be advantageous to try and find the exact amounts or concentrations necessary to induce the pluripotent state so that future experiments may be more efficient in producing iPSC lines. In this paper, only a small portion of the transduced cells showed the appropriate transgene expression. If researchers were able to efficiently produce iPSC lines without the hassles that Takahashi and Yamanaka had to go through, there would be no limits to further disease and regenerative research in mice.
Even though Takahashi and Yamanaka show in figures 2A-C that the four selected factors for induction of pluripotency are Oct3/4, Klf4, Sox2, and c-Myc, I find it interesting that in the subsequent RT-PCR and Western blot analyses, there are other factors that are still being expressed at the same or even higher amounts than those four selected factors. The authors implicate Ecat1 as a possible additional important factor. I would also like to see Fgf4 and Cripto tested further since they are detectable in all the iPSC clones of every RT-PCR presented. To go about this, I would perform a Western blot for Ecat, Fgf4, and Cripto since this might give further insight into possibilities as a necessary factor for iPSCs. If any of these factors are important in the induction of pluripotency, we might see bands that are equal in amount to the ES cell control. In that case, it would be necessary to include these factors along with the four selected factors and observe any formation of iPS cells in their double-positive assay system.
The authors would like to have tested if the four factors from the transgenes were only required for maintenance of the iPS cells. They initially intended to test this through flanking loxP sites around the transgenes, but they ran into problems when the cells contained multiple loxP sites on multiple chromosomes. To test their theory, it would be necessary to use a conditional expression system mediated by tetracycline where only certain factors would be expressed at a certain time. If the four factors are required for the maintenance of the iPS cells, and we do not express any of the four factors, we might see loss of pluripotent function or maintenance of undifferentiated cells.
While it seems that induction of pluripotent stem cells was successful in this paper, we would need further research to produce iPSCs as closely related to ES cells as possible. This study lacked the proper DNA methylation patterns and viable chimera formation, so these would be the immediate next steps in confirming iPSC creation. For chimera formation, it would be necessary to try to introduce the iPSCs into blastocyst formation, and allow the chimera to fully develop. With the data we’ve seen so far in figure 6C, I believe that viable chimera formation would be possible.
Because induction of pluripotent stem cells was successful in mice, the million-dollar experiment would be to see whether the four factors can generate pluripotent cells from human somatic cells. To go about this, researchers would use the same system as in mice – transforming human fibroblast cells with the four factors using a retroviral system. I believe this has already been done in 2007 by Yamanaka, and it was just as successful as in mice. One caveat that the authors bring up in the discussion is the use of c-Myc as one of the four factors. c-Myc is a proto-oncogene and is capable of inducing tumors; this would be something to monitor closely in the future experiments with human iPSCs.
Please direct questions or comments to Teresa Wang