*This website was produced as an assignment for an undergraduate course at Davidson College
Review of:
Induction of Pluripotent Stem Cells from Mouse Embryonic and Adult Fibroblast Cultures by Defined Factors
Kazutoshi Takahashi and Shinya Yamanaka
Department of Stem Cell Biology, Institute for Frontier Medical Sciences, Kyoto University, Kyoto 606-8507, Japan
Cell Vol 126: 663-676. August 25, 2006.
Goal:
In general, embryonic stem (ES) cells are pluripotent stem cells, meaning they have the ability to grow indefinitely and to differentiate into all three germ layers (endoderm, ectoderm, and mesoderm). Because of the ES cell’s ability to self-renew indefinitely, these cells can be very useful in the medical world for things such as regenerative medicine and tissue replacement. Unfortunately, to obtain embryonic stem cells an embryo must be destroyed, causing many ethical concerns. It has been found that somatic cells can be reprogrammed to act like ES cells by transferring their nuclear contents into oocytes or by fusion with ES cells. This indicates that there must be some set of factors in both the oocyte and ES cell that induce pluripotency in somatic cells. Takahashi et al. conducted a study to look at what specific transcriptional factors are needed to induce true pluripotency in somatic cells. This knowledge could potentially eliminate the ethical controversy associated with the use of embryonic stem cells by eliminating the need to destroy embryos.
Summary of Results:
Figure 1
Figure 1.A shows a cartoon drawing of the strategy used to test the role of the 24 transcription factor candidates in inducing pluripotency. A fusion of β-galactosidase and neomycin (termed a βgeo cassette) was inserted into the mouse Fbx15 gene (specifically expressed in mouse ES cells and early embryos) by homologous recombination. When the transcription factors are introduced to the mouse embryonic cells, the Fbx15 locus can be activated and transcription of the βgeo cassette can occur, producing G418 resistance brought on by the transcription of the neomycin gene. This, then, allows for colony selection in a G418 rich environment.
Figure 1.B shows the result of growing mouse embryonic fibroblasts (under ES cell culture conditions) from Fbx15 βgeo/βgeo embryos retrovirally transduced with one or all of the 24 transcription factor candidates. No drug-resistant colonies were obtained when only one of the 24 transcription factors was transduced in the cells (left petri dish) indicating no single transcription factor was enough to activate the Fbx15 locus. When all 24 candidates were transduced into the cells however, 22 G418-resistant colonies were obtained (right petri dish).
Figure 1.C compares the morphology of wild type ES cells, one of the clones selected from the 22 colonies produced from the transduction of all 24 transcriptional factors seen in Figure 1.B, and regular mouse embryonic fibroblasts (MEFs) that were not transduced. The iPS-MEF24-1-9 clone (pluripotent stem cells induced from MEFs by 24 factors) shows very similar morphology to the ES cells (as do 4 other clones), most visibly the round shape of both the cells. The regular MEF cells are nothing like the ES or iPS cells.
Figure 1.D shows the growth curves (cell number vs. number of days) of ES cells, 4 iPS-MEF24 clones and MEF cells. The ES and iPS-MEF24 clones exhibit very similar linear growth patterns. All five cell lines increase in cell number at a rapid pace over time. The MEF cells stop growing a little before day 40. The graph shows iPS cells are very similar to ES cells based on growth rate.
Figure 1.E is a RT-PCR analysis of ES cell marker genes in ES cells, iPS-MEF24 cells, and MEFs. As expected, none of the ES cell markers were found in the MEF cells and all of the ES cell markers were found in ES cells. Three of the iPS-MEF24 clones (5, 9, and 18) were looked at with RT-PCR. The figure shows that the iPS-MEF24 clones expressed ES cell markers including Nanog, E-Ras, Oct3/4, Sox2, Fgf4, Cripto, Dax1, and Zfp296.
Figure 1.F shows the bisulfite genomic sequencing of the promoter regions for Oct3/4, Nanog, and Fbx15 in iPS, ES, and MEF cells. Bisulfite genomic sequencing treats DNA with bisulfite in order to determine the pattern of methylation. Treatment of DNA with bisulfite converts cytosine residues to uracil, but leaves S-methylcytosine residues unaffected. Dark circles indicate methylated CpGs, while open circles indicate unmethylated CpG dinucleotides. The methylation pattern of the Nanog and Fbx15 promoters are similar in the iPS-MEF24 clones and ES, but the iPS clones exhibit high methylation in the Oct3/4 promoter much like the MEF cells (which exhibit high methylation in all three promoter regions). This indicates that these iPS-MEF24 cells are similar to ES cells but not exactly.
Figure 2
Figure 2.A highlights the effects of removing individual transcription factors from the 24 total transduced factors on the formation of G418-resistant colonies. The colony number was counted after 10 days and after 16 days. The individual removal of factors 14, 15, and 21 showed no colony growth at all, while the individual removal of factors 3, 4, 5, 11, 18, 21, and 22 showed no colony growth after 10 days and little colony growth after 16 days. This graph indicates that these 10 transcription factors play an important role in inducing pluripotency in somatic cells.
Figure 2.B is a graph very similar to Figure 2.A, but instead of looking at the removal of one factor from the pool of 24, this figure examines the formation of colonies after withdrawal of individual factors from the 10-factor pool (found to be important in the previous figure) transduced into MEFs (iPS-MEF10). The figure shows that the removal of factors 14 (Oct3/4), 15 (Sox2), and 20 (Klf4) did not produce any G418-resistant colonies, indicating that these three factors are most important for inducing iPS cells from MEFs. The authors also found that the removal of c-Myc (factor 22), produced some G418 resistant genes, but those colonies did not exhibit ES cell-like morphology. It is interesting to note that the removal of one factor (not including the four mentioned) led to higher colony formation than when all 10 factors were present.
Figure 2.C employed the same method as Figures 2A and 2B, but instead of looking at a combination of 24 factors and 10 factors respectively, this graph looks at the combination of the four factors found to be extremely important in colony growth from the last figure. All four factors together produced a high number of colonies, about the same number of colonies when all 10 factors are present. Different combinations of three of the factors were analyzed and the graph shows that the combination of Klf4, Sox2, and Oct3/4 without c-Myc still produced G418-resistant colonies. The combination of Klf4, Oct3/4, and c-Myc without Sox2 also produced G418-resistant colonies. No combination of two factors could induce the formation of G418-resistant colonies.
Figure 2.D looks at the morphology of three different iPS cells. The combination of Oct3/4, Klf4, and Sox2 (minus c-Myc) from part C indicated colony growth but the colonies exhibited non-ES-cell-like morphology, so that strain was not under investigation. The combination of Oct3/4, Klf4, and c-Myc (minus Sox2) showed the formation of 54 G418-resistant colonies. The morphology of these iPS-MEF3 colonies was compared with the morphology of an iPS-MEF4 clone and a iPS-MEF10 clone in this figure. The iPS-MEF3 colony does not exhibit the exact same morphology as the other two colonies. The iPS-MEF3 colonies exhibit rough surfaces, as opposed to smooth, round surfaces characteristic of standard ES cells and iPS-MEF4 and iPS-MEF10 colonies. This shows that although the combination of Oct3/4, Klf4, and c-Myc can activate the Fbx15 locus, the change is different from that of iPS-MEF4 and iPS-MEF10 cells.
Figure 3
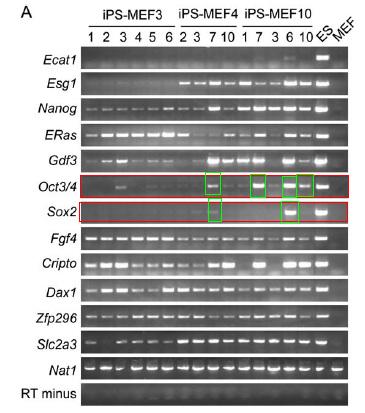
Figure 3.A is a RT-PCR analysis of ES marker genes in different iPS cells, ES cells, and MEFs. The authors also note that they used primers that would amplify transcripts of the endogenous gene but not transcripts of the transgene. The RT-PCR was done on 6 iPS-MEF3 clones, 4 iPS-MEF4 clones, and 5 iPS-MEF10 clones along with ES and MEF cells as controls. The iPS-MEF4 cells and iPS-MEF10 showed the most expression of ES marker genes. Based on previous figures, it is important to focus on the expression of Oct3/4 and Sox2 marker genes. Oct3/4 appears to be somewhat higher in certain iPS-MEF4 clones and iPS-MEF10 clones, but not all. Sox2 appears in high concentrations only in one clone of iPS-MEF10 cells (iPS-MEF10-6). Previous findings indicate that Oct3/4 and Sox2 are two of the more important ES marker genes responsible for inducing pluripotency in somatic cells.
Figure 3A: RT-PCR analysis of ES marker genes in iPS, ES, and MEF cells
Figure 3.B highlights the results of chromatin immunoprecipitation analyses of Oct3/4 and Nanog promoters for acetylation of histone H3 and dimethylation of lysine 9 of histone H3. The graphs in this panel show the promoters of Oct3/4 and Nanog had increased acetylation of histone H3 and decreased dimethylation of lysine 9 of histone H3. Looking at the graphs that compare the signal intensity for the immunoprecipitation among ES cells, MEF cells, an iPS-MEF4 clone, and an iPS-MEF10 clone, it is clear that the iPS-MEF4 and iPS-MEF10 cells follow the ES cell pattern, not the MEF cell pattern.
Figure 3.C looks at the methylation patterns found in the promoters Oct3/4, Nanog, and Fbx15 using the bisulfite genomic sequencing protocol (also found in Figure 1.F) for iPS-MEF4-7 and iPS-MEF10-6 cells that showed indication of Oct3/4 in the RT-PCR in panel A and were also analyzed with chromatin immunoprecipitation analyses. This figure is a continuation of Figure 1.F indicating that the iPS-MEF4 cells and iPS-MEF10 cells are similar to ES cells in that the Fbx15 promoter is not methylated, but different in that the Oct3/4 and Nanog promoters are partially methylated when they are not in ES cells.
Figure 3.D looks at the staining patterns of the iPS-MEF4-7 and iPS-MEF10-6 clones with mouse monoclonal antibody against SSEA-1 and with alkaline phosphatase. SSEA-1 is a glycoprotein expressed on embryonic stem cells and high levels of alkaline phosphatase are associated with undifferentiated pluripotent stem cells (for more on stem cell markers click here). Both iPS-MEF4 and iPS-MEF10 cells were positive for both stains, indicating their similarity to ES cells.
Figure 4
Figure 4.A compares the global gene-expression profiles of ES cells, iPS cells, Fbx15βgeo/βgeo MEFs, Fbx15βgeo/βgeo MEFs in which the four factors had been introduced without G418 selection, immortalized MEFs expressing K-RasV12, and NIH 3T3 cells transformed with H-RasV12 using a DNA microarray to pinpoint the differences in gene expression among the different types of cells (to view the methodology behind DNA microarrays click here). Over 10,000 probes were used to cluster these different cells. The red indicates increased expression and green means decreased expression. The result of the DNA microarray here indicates that the iPS cells are much more closely related to ES cells than to the different MEF cells.
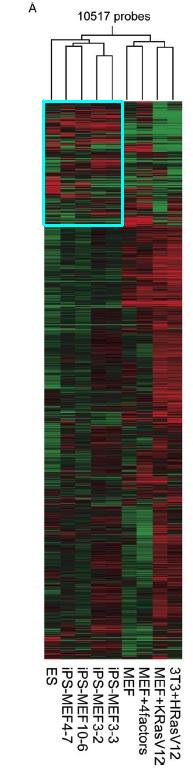
Figure 4A: Pearson correlation analysis of 10,517 probes to cluster ES cells, iPS cells, and MEF cell derivatives. The blue box highlights the region that looks most similar between ES and iSP cells and most different from MEF cells.
Figure 4.B is another global gene-expression analysis by DNA microarray. This DNA microarray is much more focused in that it looks at genes upregulated in ES and/or iPS cells. 183 probes were used to cluster the different cell types together. The genes are separated into 3 groups. The genes in group 1 are genes that appear to be upregulated in ES cells and iPS cells. The genes in group 2 seem to be upregulated more in ES cells and iPS-MEF4 and iPS-MEF10 cells than in iPS-MEF3 cells. Genes in group 3 seem to be upregulated more in ES cells only. It is clearer in this figure that iPS-MEF4 and iPS-MEF10 cells are closer to ES cells than iPS-MEF3 cells and MEF cells, but not necessarily identical.
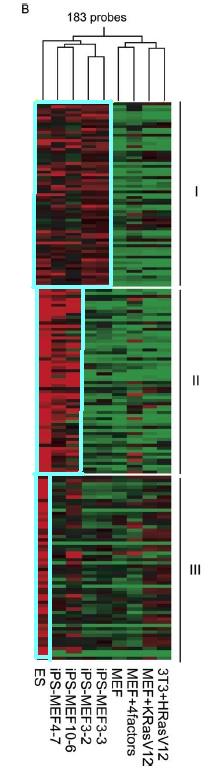
Figure 4B: DNA microarray that highlights genes upregulated in ES and/or iPS cells. Highlighted areas indicated upregulation.
Figure 5
Figure 5.A looks at the various tissues present in tetratomas from iPS-MEF4-7 cells that were subcutaneously injected into nude mice to examine the pluripotency of iPS cells. A teratoma is an encapsulated tumor with tissue or organ components resembling normal derivatives of all three germ layers, indicating pluripotency. Here the authors show that the teratomas contain cartilage tissue, CNS tissue, muscle tissue, adipose tissue, and epithelial tissue, indicating three germ layers did indeed form.
Figure 5.B is an immunostain that differentiates between neural and muscle tissue. There is a positive stain for smooth muscle actin characteristic of the mesodermal layer, glial fibrillary acidic protein (GFAP) characteristic of the CNS and more specifically the ectodermal layer, and βIII tubulin, also characteristic of the ectodermal layer. This figure confirms differentiation into neural and muscle tissues in teratomas from iPS-MEF4-7.
Figure 5.C shows embryoid body formation in iPS-MEF3 cells, iPS-MEF4, and iPS-MEF10 cells. Embryoid body formation is used to examine the differentiation potential of the embryonic stem cell line. All three cell lines formed embryoid bodies in noncoated plastic dishes (top row). Only iPS-MEF10 and iPS-MEF4 cells showed differentiation when grown in tissue culture dishes (lower row).
Figure 5.D is a compilation of immunostains to detect differentiation of mesoderm, endoderm, and ectoderm in both iPS-MEF4 and iPS-MEF10 embryoid bodies that exhibited differentiation in the first place. Antibodies for smooth muscle actin, a-fetoprotein, and bIII tubulin were used to differentiate between the three germ layers. Secondary antibodies were labeled with Cy3, except for a-fetoprotein in iPS-MEF10 cells, where Alexa 488 was used. Both embryoid bodies from iPS-MEF4 and iPS-MEF10 cells showed positive immunostains for the three different germ layers.
Figure 6
Figure 6.A shows a picture of the morphology of iPS-TTFgfp4 cells. These cells were created by introducing the four selected factors (Oct3/4, Klf4, c-Myc, and Sox2) into tail-tip fibroblasts. The morphology of these cells was indistinguishable from ES cells (seen in Figure 1.C).
Figure 6.B is an RT-PCR analysis of ES marker gene expression in 6 iPS-TTFgfp4 cell clones. The results show that clones 3 and 7 of iPS-TTFgfp4 express the most ES cell marker genes at high levels, while the other clones express most of the ES cell marker genes at low levels.
Figure 6.C shows the contribution of iPS-TTFgfp4-3 and iPS-TTFgfp4-7 to mouse embryonic development when they were introduced into mouse blastocysts. A fluorescent microscope was used to observe the GFP pattern contributed by the iPS-TTFgfp4-7 (top right panel) and iPS-TTFgfp4-2 (bottom right panel). Both pictures show a contribution of GFP-positive iPS cells, indicating that the four factors are sufficient for inducing embryonic development.
Figure 6.D is an immunostain of the different sections of the chimeric embryo microinjected with iPS-TTFgfp4-3. The sections were stained with anti-GFP antibody (that appears brown) and counterstained with eosin (which is blue). All the different tissues (heart, liver, GI tract, gonad, neural tube, and skin) indicate some presence of GFP, indicating that the iPS cells contributed to all three germ layers further confirming that the four selected factors could induce pluripotent cells from adult mouse fibroblasts.
Figure 7
Figure 7.A is a western blot analysis of the expression of the four transcription factor proteins and other proteins in the different iPS cell lines. The total protein amounts of the four factors in iPS cells seem to be comparable to those in ES cells. It is interesting to note that Nanog protein levels vary between iPS cell lines and ES cells.
Figure 7.B shows the changes in RNA (left panels) and protein (right) levels of Oct3/4, Sox2, and Nanog in iPS cells and ES cells that were undifferentiated on STO feeder cells (U) or induced to differentiated in vitro through embryoid body formation. RNA levels were determined by real-time PCR with primers specific for endogenous transcripts (white columns) or primers common for both endogenous and transgenic transcripts (white and black columns) and protein levels were determined by a Western blot normalized with b-actin. The graphs show that upon differentiation in vitro, the total mRNA expression levels of Oct3/4 and Sox2 decreased but were still higher than the level of mRNA in ES cells. Protein levels of Oct3/4 and Sox2 also decreased with differentiation, but the iPS cells and ES cells had comparable levels of protein.
Figure 7.C is a southern blot analysis of different iPS clones. Genomic DNA isolated from different iPS cells and ES cells was digested with two restriction enzymes and hybridized with Klf4 cDNA probe. Each lane shows a different result, indicating that each iPS clone has a unique transgene integration pattern.
Figure 7.D is a normal karyotype of iPS-TTFgfp4-2 clone. This clone shows a normal karyotype of 40XX.
Figure 7.E shows the morphology of ES cells and iPS cells cultured without feeder cells with the presence of LIF (top pictures; LIF is a leukemia inhibitory factor that has the ability to promote growth and cell differentiation of different types of target cells) or without LIF (bottom pictures). These photographs show that iPS cells could not remain undifferentiated when cultured in the absence of feeder cells, even with the presence of LIF. For the researchers, this allows them to exclude the possibility that iPS cells are merely contamination of pre-existing ES cells.
Critique:
Overall, I think this paper is very strong in that it provides a lot of visual and textual support indicating that iPS cells can be generated from somatic cells with the presence of four transcription factors characteristic of ES cells. The researchers do not overstate their findings, in fact they are conscious of the uncertainties in their findings and clearly state that while iPS cells are very similar to ES cells, they are not completely the same. They also are aware that the origin of their iPS cells is uncertain since there was a low frequency of cells that actually became iPS cells. They realize there are still many variables that have gone unaccounted for, but the fact that they address the uncertainties makes their paper more credible and sets it up for a good foundation for continuing research.
Yet there were a few problems I encountered with some of the figures. Figure 1.E stood out to me as one of the weaker figures included in the paper. Takahashi et al. stated that the RT-PCR analysis revealed that the iPS-MEF24 clones expressed ES cell markers, including Oct3/4, E-Ras, and Dax1, yet these three marker genes had the least consistent band pattern among the three clones. I believe it is somewhat of a stretch to confidently say Oct3/4 is found in iPS-MEF24 clones at that point. Because of the number and strength of some of the other figures, the weakness of this figure doesn’t bring down the rest of the paper.
I also had an issue with Figure 2, panels A, B, and C. The way the graphs are set up differently in each of the three panels is a little deceiving to readers. At a closer look, the scale for the number of colonies produced when all 24 factors were transduced in mouse embryo cells for Panel A only goes up to 40. Panel B on the other hand has a scale up to 300. It looks like when all 10 factors are present there are not very many colonies at all, but in reality it is probably a similar amount to the number of colonies found on the higher end in panel A. Panel C yet again has a different scale, and it is also interesting to note why there is a difference between the number of colonies formed when all 10 factors were transduced in panel C versus panel B. I wish the authors had provided an explanation for this discrepancy, or at least repeated these experiments multiple times in order to produce error bars.
I also found Figure 5 somewhat confusing only because the readers were not given any kind of control to compare to the tissues from iPS cells. I wasn’t exactly sure what I was supposed to be looking at, so it would have been nice to compare the pictures we were given to some sort of wild-type directly next to it. This would have made it easier to claim that iPS cells do indeed mimic ES cells in that the cells differentiate to form all three germ layers.Future Experiments:
The next logical step with this information would be to see if the same results can be seen in humans. I would try to carry out this exact same experiment but with human cells instead of mice cells. The only concern with carrying out this experiment would be, besides the ethical issues, the presence of c-Myc, a gene that can cause tumor formation. It would be interesting to see if another transcription factor could replace c-Myc so human cells could be investigated. Adult human somatic cells would be able to be transformed into iPS cells, which could then be used for treating certain diseases that involve tissue degeneration among other things. The ethical issue involving embryonic stem cells would all but be eliminated.
Another aspect of this study that could be investigated further would be looking at varying the amounts of the four factors to determine how that affects pluripotency and the efficiency of transformation. For this, I would look at finding a way to control how much of the four transcription factors was injected into the marker embryonic cells. Figure 7 in the Takahashi et al. study looks at the relationship between mRNA and protein levels in the iPS cells, so I would want to continue that further by looking how different levels of injection might affect transcription and translation of the ES marker genes. A simple Northern and Western blot could be used to detect those levels. I would then continue much like Takahashi and look at the developing iPS cells with varying levels of the 4 transcription factors to see how they compare to normal ES cells in shape, growth, and differenetiation.
Most importantly, I think it would be necessary to look at the function of each of the four factors individually in different cells and to look at how the proteins interact. This might give an inclination of the role of each of the four factors in inducing pluripotency. It also might lead to understanding the interactions between the four proteins that allow the induction of pluripotency in somatic cells to occur. Takahashi et al. mention protein-protein interactions multiple times, especially when talking about c-Myc and Klf4 protein interaction. A co-immunoprecipitation could be performed to detect any protein-protein interactions.
References:
Takahashi K, Yamanaka S. Induction of pluripotent stem cells from mouse embryonic and adult fibroblast cultures by defined factors. Cell 2006; 126: 663-676.
Please direct questions or comments to Abbey Webb