This web page was produced as an assignment for an undergraduate
course at Davidson College.
Expression of CMD1 in S. cerevisiae
As noted on the website created for
my second assignment, CMD1 encodes for the protein calmodulin in Saccharomyces
cerevisiae. Calmodulin is a ubiquitously expressed Ca2+ binding protein
that interacts with the components of numerous cellular processes. Some of
the processes that CMD1 is involved with are cytoskeleton organization, cell
growth, cell division, and budding.In order to learn more about the role of
CMD1 in yeast, I have consulted the Saccharomyces Genome Database's
Expression
Connection Search. Expression Connection is a powerful site that summarizes
the expression profiles of genes as observed in a number of DNA microarrary
experiments. Another interesting feature is that Expression Connection groups
the expression profile of your gene with a number of other genes that have
similar expression profiles.
Following the discussion of CMD1's expression, there is a similar
discussion of an unannotated ORF, named YBR108W.
This is the scale used throughout the following figures
for repression and induction:
(SGD, 2002; <Expression
Connection>)
Expression in response to alpha-factor
for CMD1/YBR109C (Rosetta Impharmatics)
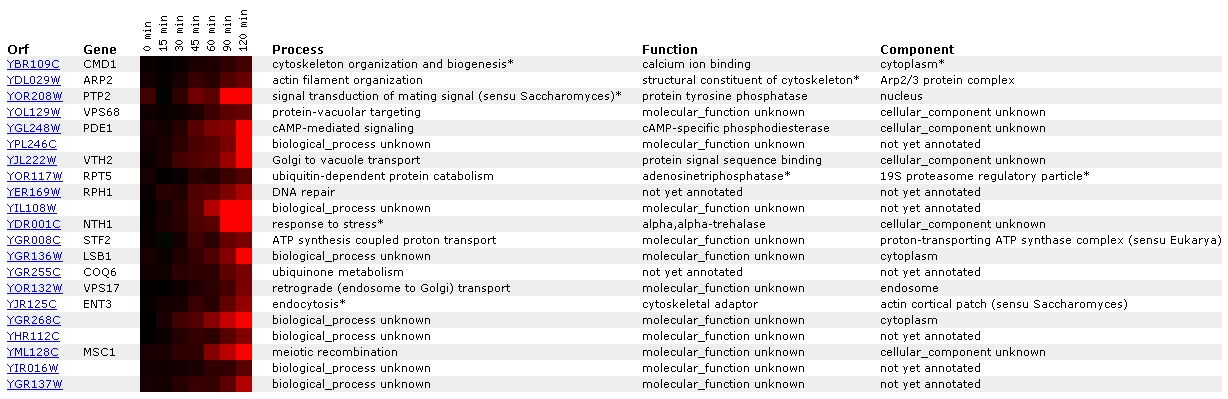 Figure
1. Screen capture from alpha-factor exposure experiment (SGD, 2002;
Expression
Connection)
Figure
1. Screen capture from alpha-factor exposure experiment (SGD, 2002;
Expression
Connection)
In this experiment, CMD1 becomes increasingly induced as it
is exposed to a constant amount of alpha-factor over a duration of time. It
is most closely grouped with the gene ARP2, a gene involved in actin filament
organization. Gene ontology lists the function of ARP2 as a structural constituent
of the cytoskeleton. This pairing is interesting because one of the many processes
that CMD1 is involved in is organization of the cytoskeleton. CMD1 has also
been grouped with PTP2, a gene involved in signal transduction of mating signal.
Mating signal is a peptide pheromone that binds to a particular G-protein
receptor which begins a cascade that results in induction of mating process-related
genes (SGD, 2002; <Gene
Ontology: Signal transduction of mating signal>). CMD1 participates
in several transduction pathways including stress and pheromone response,
so it not a surprise that these two have similar expression profiles (SGD,
2002; <Function
Junction>; Cyert, 2001). Another noteworthy gene is ENT3, a cytoskeletal
adaptor that acts in endocytosis. CMD1 has been shown to have some role in
endocytosis, as some types of CMD1 mutants have exhibited defects in that
process (Cyert, 2001). Figure 2provides a graphical depiction of CMD1 induction
in this experiment, as the dark red can be hard to see. It is understandable
that alpha-factor exposure could bring about the induction of CMD1, since
alpha-factor is a mating pheromone and CMD1 is known to be involved with pheromone
signal transduction (Cyert, 2001).
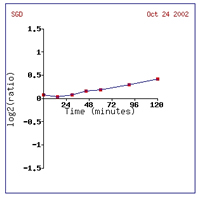
Figure 2: Increased expression of CMD1 due to alpha-factor
exposure over 120 minutes (SGD, 2002; Expression
Connection).
Expression during the diauxic shift for
CMD1/YBR109C (Stanford University)
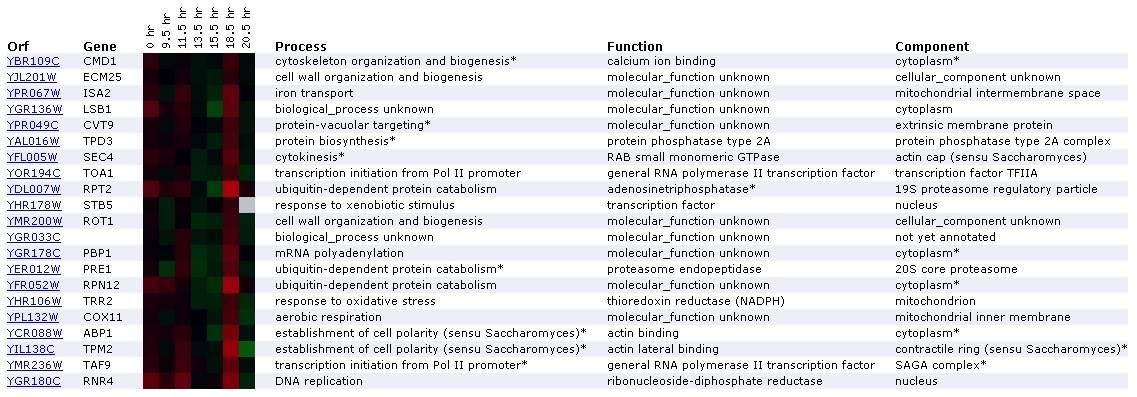 Figure
3. Screen capture diauxic shift experiment (SGD, 2002; Expression
Connection)
Figure
3. Screen capture diauxic shift experiment (SGD, 2002; Expression
Connection)
The diauxic shift is the transition from anaerobic to aerobic
respiration. In this experiment, the increase in expression of CMD1 remains
nearly imperceptible until the 18.5 hour mark, where it is expressed very
slightly. It has been grouped with two genes involved in cell wall organization
and biogenesis: ECM25 and ROT1. Another aspect of this profile that interests
me is the presence of 3 genes involved in ubiquitin-dependent protein catabolism:
RPT2, PRE1, and PRN12. In addition to appearing on the diauxic shift expression
profile, proteins for ubiquitin-dependent protein catabolism are grouped with
CMD1 in the expression profiles for exposure to alpha-factor, exposure to
DNA-damaging reagents, and expression during sporulation. CMD1 is grouped
again with RPT2 in the DNA-damaging reagents experiment. There is no mention
of a relationship between CMD1 and ubiquitin-dependent catabolism in the Cyert
paper or on Function Junction. However, the fact that CMD1 is repetitively
grouped with ubiquitin-related genes suggests that a relationship might exist.
Since processes involving ubiquitin and calmodulin are both very common in
yeast cells, it is plausible that their paths might cross at some point. One
gene that Function Junction directly links to CMD1 is MYO2, which is involved
in establishment of cell polarity. APB1, TPM2, located towards the bottom
of the list, both encode for actin-binding proteins that participate in establishment
of cell polarity. According to SGD, the diauxic shift experiment should identify
genes that are involved in the anaerobic-aerobic transition (SGD Help, 2002;
<Expression
Help>. CMD1's lack of profound induction is consistent with the fact
that involvement in diauxic shifts are not mentioned in the Cyert paper. However,
the fact that induction occurs slightly over time suggests that it might be
involved to some extent.
Expression in response to DNA-damaging
agents for CMD1/YBR109C (Stanford University)
 Figure
4. Screen capture from DNA-damaging agent experiment (SGD, 2002;
<Expression
Connection>)
Figure
4. Screen capture from DNA-damaging agent experiment (SGD, 2002;
<Expression
Connection>)
Here, the expression profile for CMD1 in response to various
DNA-damaging agents shows that CMD1 is induced very subtly throughout, especially
in response to methyl methane sulfonate. The feature of highest induction
is labeled 'mec1 mutant - log phase (irradition time=0 cells).' It has been
grouped with four genes whose processes have been classified as ubiquitin-dependent
protein catabolism. One of these, RPT2, was seen in the diauxic shift experiment
above. Repression appears to be occurring at 'mec1 mutant + mock irradiation
(5 min).'
Expression in response to environmental
changes for CMD1/YBR109C (Stanford University)
 Figure
5. Screen capture from environmental change experiment (SGD, 2002;
<Expression
Connection>)
Figure
5. Screen capture from environmental change experiment (SGD, 2002;
<Expression
Connection>)
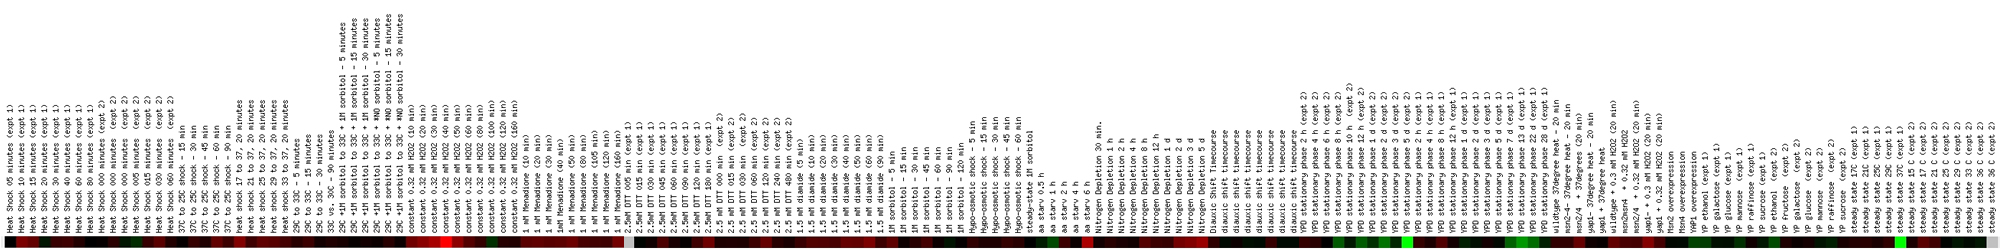
This profile shows expression of CMD1 with respect to a number
of different environmental stresses, including heat shock, temperature shifts,
amino acid starvation, and exposure to chemicals like hydrogen peroxide, menadione,
and DTT. Since CMD1 is known to play a part in the yeast cell's response to
environmental stress, one would expect that CMD1 would exhibit induction during
the various treatments. This indeed seems to be the case, although the induction
was identified by bright red in only one instance. The color bar shows that
induction of CMD1 occurred because of heat shock, menadione exposure, DTT
exposure, diamide exposure, and after six hours of amino acid starvation.
The greatest induction occurs throughout exposure to hydrogen peroxide, with
the most profound induction occurring at the 40 minute mark. Repression also
occurred, particularly after 100 minutes of hydrogen peroxide exposure, after
one hour of amino acid starvation, during the phase labeled 'YPD Stationary
Phase,' and when the YP medium was altered with ethanol and mannose as the
carbon source.
This experiment looks at the expression of CMD1 throughout the
cell cycle. At several points, it is induced or repressed, but ultimately,
the score of 0.09 indicates that CMD1 is most likely not cell cycle regulated
(Yeast Cell Cycle Analysis Project, 2000; <YCCAP>).
Here is a link to a list of genes that were known to be cell cycle regulated
prior to this experiment: Known
Regulated Genes (Microsoft Word document). Use the find feature to search
for CMD1, and you will see that it is not on this list.
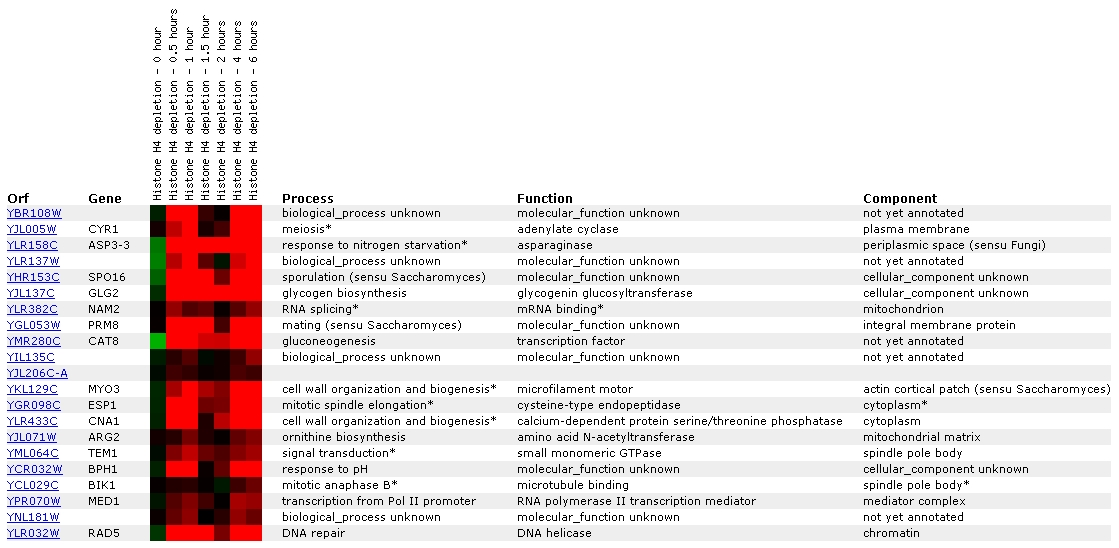
Expression in response to histone depletion
for CMD1/YBR109C (The Whitehead Institute)
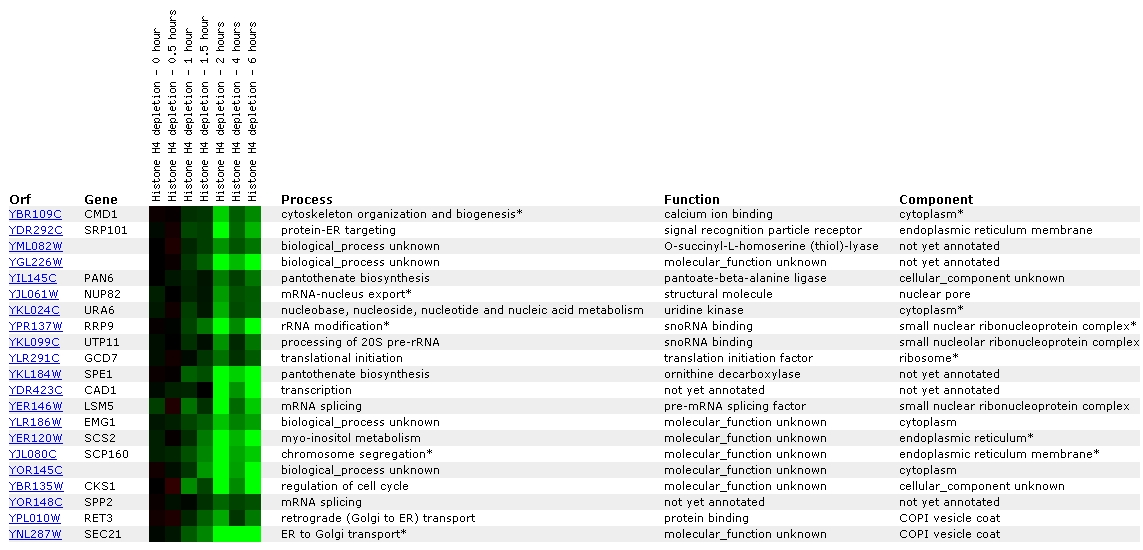 Figure
7. Screen capture from histone depletion experiment (SGD, 2002; <Expression
Connection>)
Figure
7. Screen capture from histone depletion experiment (SGD, 2002; <Expression
Connection>)
Histone depletion experiments identify genes whose transcription
patterns are disrupted by histone depletion (SGD Help, 2002; <Expression
Help>). The profile for CMD1 shows that repression has begun to occur
at one hour, reaches peak repression at two hours, decreases at 4 hours, and
then is on the increase again at 6 hours.
Expression during sporulation for CMD1/YBR109C
(UCSF, Stanford University)
 Figure
8. Screen capture from sporulation experiment (SGD, 2002; <Expression
Connection>)
Figure
8. Screen capture from sporulation experiment (SGD, 2002; <Expression
Connection>)
This experiment shows the expression of CMD1 with respect to
the occurrence of sporulation. CMD1 has been grouped with a gene of unknown
ontological process and function called MLC2. Their similar expression patterns
suggest that they might be related in some way. At the SGD
site for MLC2, I learned that the putative protein product of MLC2, Mlc2p,
is most likely the light chain for Myo1p, type II myosin (SGD, 2002). MYO1
is involved in a many of the same processes as CMD1: cell growth, cell division,
cell polarity, and organization of the cytoskeleton (SGD, 2002; <Function
Junction: MYO1>).
Expression of YBR108W in S. cerevisiae
For our second assignment, we
were asked to take an unannotated ORF, located near our annotated gene, and
use public databases to discover as much as possible about the role of the
unannotated ORF in S. cerevisiae. Although I found some interesting
information about the ORF I chose, YBR108W, the data did not provide any conclusive
evidence for its function, process, or cellular component, other than the
fact that it might encode a globular protein.
Using Expression Connection, just as above, it is my hope that
this might shed further light upon YBR108W, and its role in the life of S.
cerevisiae.
I have reproduced the scale again for your convenience:
(SGD, 2002; <Expression
Connection>)
Expression in response to alpha-factor
for YBR108W (Rosetta Impharmatics)
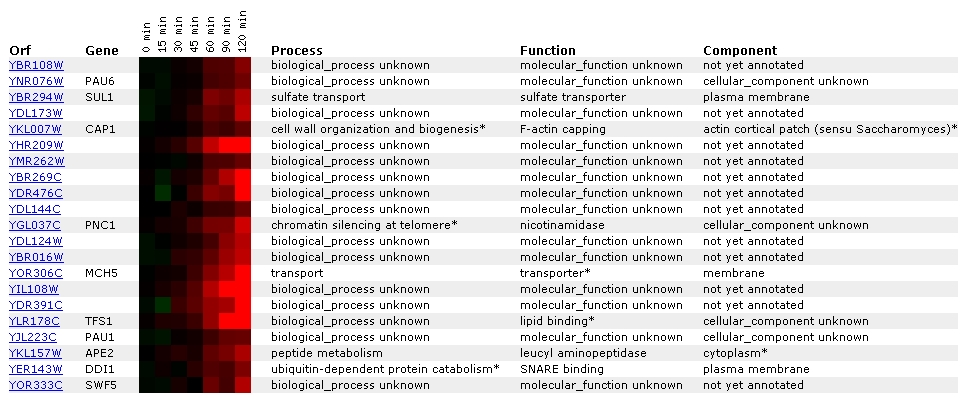 Figure 9. Screen capture from alpha-factor experiment (SGD, 2002;
<Expression
Connection>)
Figure 9. Screen capture from alpha-factor experiment (SGD, 2002;
<Expression
Connection>)
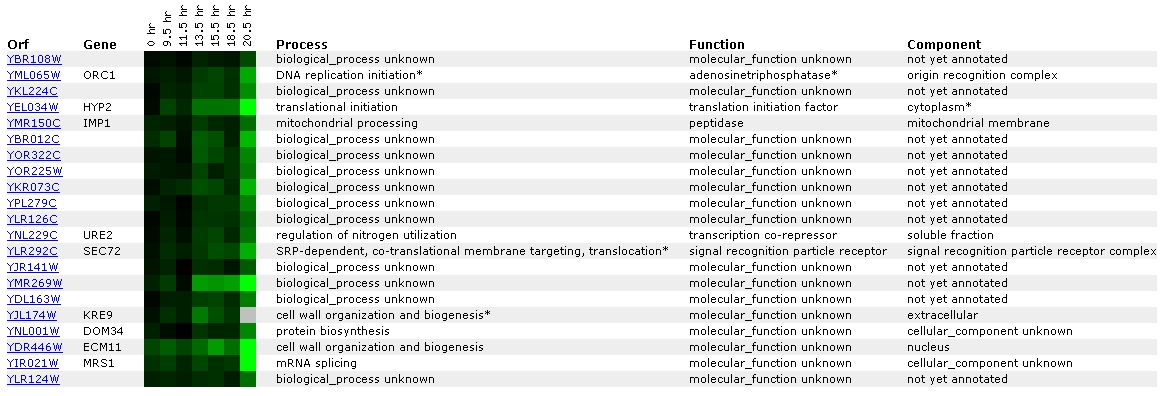
In response to alpha-factor exposure, YBR108W becomes increasingly
induced over time. Predominantly, YBR108W is grouped with unannotated genes.
It has been grouped with another gene of unknown process, function, and
cellular component. However, this particular gene, unlike YBR108W, has a
specific gene name: PAU6. SGD describes PAU6 as a member of the seripauperin
protein/gene family (2002; <SGD: PAU6>).
I searched SGD for PAU1-5, and they all have the same nebulous description.
A search of the SGD for 'seripauperin' turned up no results, so I tried
PUBMED.
This search also yielded no hits. Finally I tried Google,
where a number of hits came up. Although most of the hits gave any more
information than SGD, some of the hits referred to the PAU genes as possible
cell wall proteins (Fowlkes, 2002; <http://www.cs.berkeley.edu/~fowlkes/bio/clusters/final1/depth4/gcluster2.html>).
Interestingly enough, 3 lines down from PAU6 is CAP1, whose process is listed
as cell wall organization and biogenesis. Throughout the various experiments
below, YBR108W is grouped with other cell wall organization genes, but as
closely as in this experiment.
Expression during the diauxic shift
for YBR108W (Stanford University)
 Figure
10: Screen capture from diauxic shift experiment (SGD, 2002; <Expression
Connection>)
Figure
10: Screen capture from diauxic shift experiment (SGD, 2002; <Expression
Connection>)
During the shift from anaerobic to aerobic respiration, it
appears that YBR108W is increasingly repressed. Once again, it is mainly
grouped with unknown genes. In this list of similar genes, there are 2 genes
listed whose processes are cell wall organization and biogenesis.
Expression in response to DNA-damaging
agents for YBR108W (Stanford University)
 Figure
11. Screen capture from DNA-damaging agents experiment (SGD, 2002;
<Expression
Connection>)
Figure
11. Screen capture from DNA-damaging agents experiment (SGD, 2002;
<Expression
Connection>)
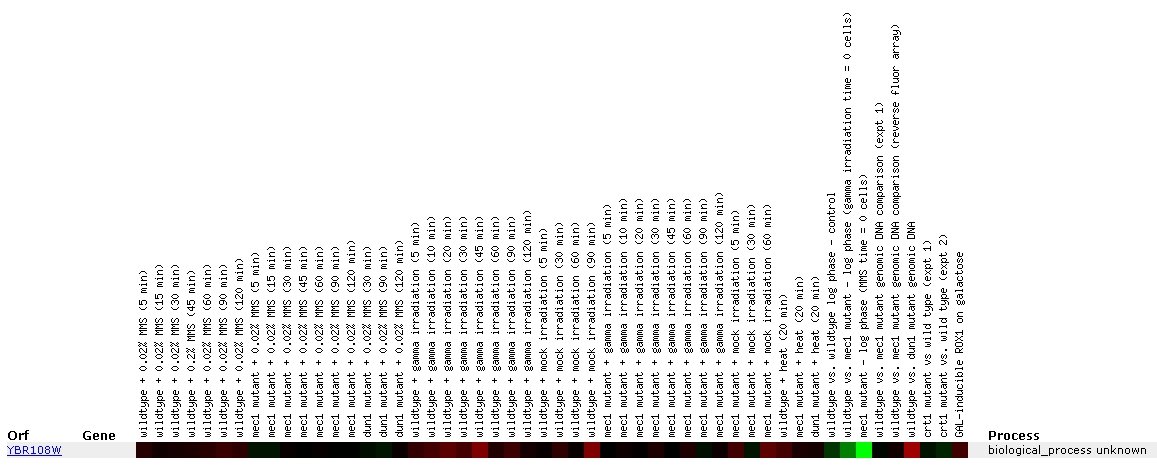
Throughout the exposure to the various DNA-damaging agents,
expression of YBR108W remains unchanged, as designated by the black portions
of the color bar. Induction can be seen during exposure to gamma irradiation,
with peak induction at the 45 minute mark. There also appears to be induction
after 90 minutes of mock irridiation of wildtype cells, although it is unclear
to me what exactly constitutes mock irradiation. The MEC1 mutant exhibited
no induction of YBR108W throughout the 120 minutes of gamma irradiation.
Expression in response to environmental changes
for YBR108W (Stanford University)
 Figure
12: Screen capture from environmental stress experiment (SGD, 2002;
<Expression
Connection>)
Figure
12: Screen capture from environmental stress experiment (SGD, 2002;
<Expression
Connection>)
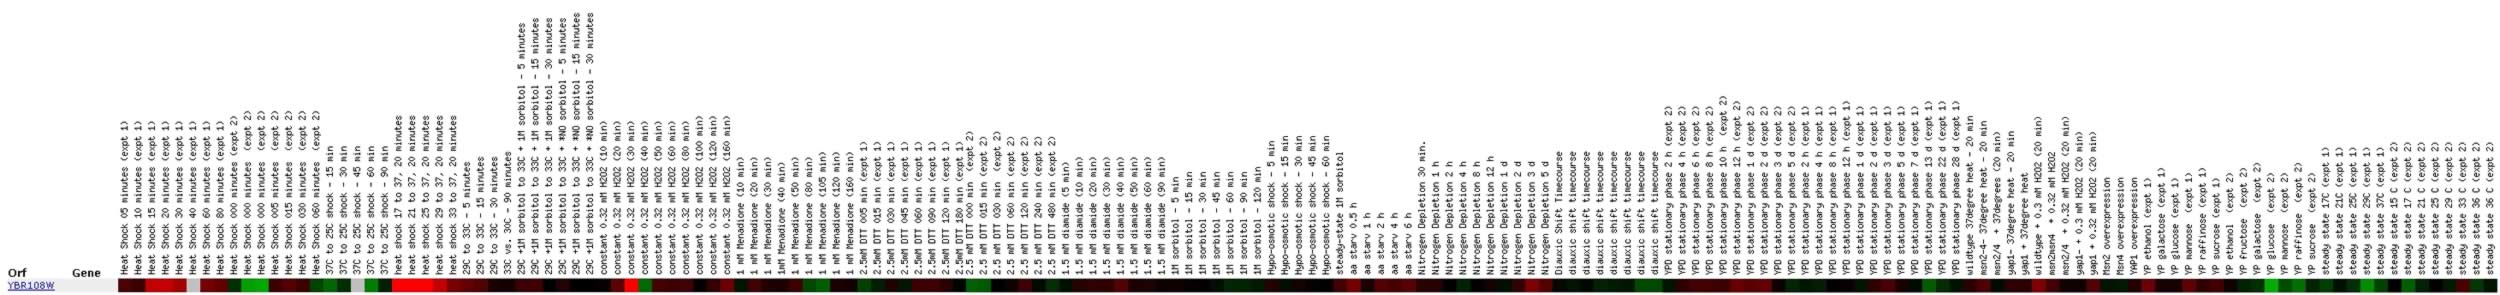
Exposure to various environmental stresses seems to elicit
a number of responses in YBR108W expression. The different heat shock experiments
resulted in slightly more induction than repression, but it still seems
like it should be more consistent. After 30 minutes of exposure to hydrogen
peroxide, YBR108W is induced, but ten minutes later it is repressed. I would
like to know more about what could cause such a turnaround. One thing about
this profile that I found interesting was the extent of repression and induction
that the ORF exhibits. The brightness of the color bar is much more pronounced
than that of my annotated gene, CMD1. This is contrary to my expectations.
CMD1 is known to be a component of signal transduction in response to environmental
stress. Although it appears consistently induced in this same experiment,
I would have expected it to exhibit larger amounts of induction. The red
signals for YBR108W are much brighter, so perhaps it plays some part in
response to environmental stress.
Expression during the cell cycle for YBR108W (Stanford
University, Cold Spring Harbor)
 Figure
13: Screen capture from cell cycle experiment (SGD, 2002; <Expression
Connection>)
Figure
13: Screen capture from cell cycle experiment (SGD, 2002; <Expression
Connection>)
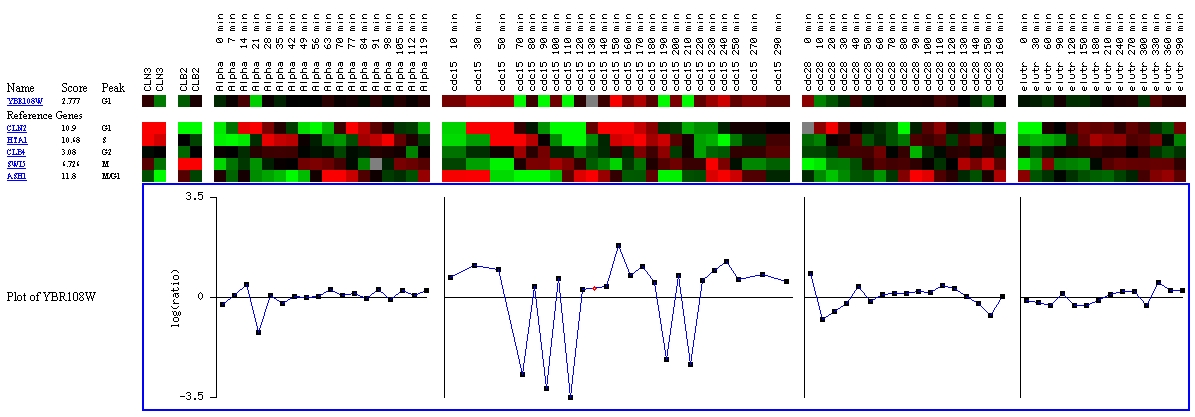
In looking at expression with regards to the various stages
of the cell cycle, it appears that YBR108W's expression might be regulated
by the cell cycle. Although a score of 2.777 is not very high, there is a
better chance of YBR108W being regulated by the cell cycle than CMD1, which
received a score very near to zero.
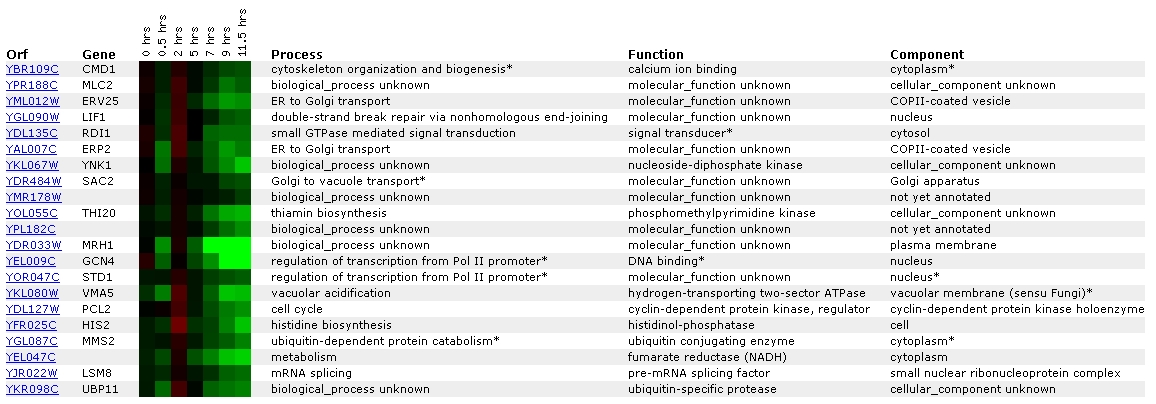
Expression in response to histone depletion
for YBR108W (The Whitehead Institute)
 Figure
14: Screen capture from histone depletion experiment (SGD, 2002;
<Expression
Connection>)
Figure
14: Screen capture from histone depletion experiment (SGD, 2002;
<Expression
Connection>)
The level of YBR108W transcription appears to be disrupted by
histone depletion, as the color bar shows that induction on a scale of nearly
2.8x is occurring. YBR108W has been grouped most closely with CYR1, a gene
which is apparently involved with meiosis. YBR108W has also been grouped with
two more cell wall organization genes: MYO3 and CNA1.
In conclusion, it seems that CMD1 was consistently grouped with
genes to which it could plausibly be related. Although it was never linked
to any of the genes that Function Junction and Pathcalling list as direct
points of interaction (Fig. 15), in several instances it was grouped with
genes related either closely or distantly to them. Finally, I also learned
that GenomeNet places CMD1 in the phosphatidylinositol signaling system of
yeast. Although the Cyert paper discusses some of CMD1's interactions with
signalling pathways, this particular name never came up. Here is a link to
a diagram of the pathway on the GenomeNet website: Phosphatidylinositol
signaling system (GenomeNet, 2002; <GenomeNet>).
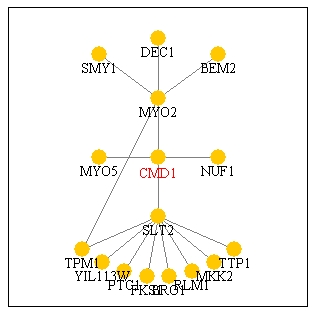
Figure 15: Screen capture of Pathcalling interactions
of CMD1. According to this picture, it directly interacts with MYO2,
NUF1, MYO5, and SLT2 (Genescape Portal Website, 2000; <Function
Junction>).
At the conclusion of Assignment 2, I was unsure about the unannotated
ORF YBR108W, but I predicted that if it did encode for something, it was probably
a globular protein. From Expression Connection, I learned that YBR108W is
expressed fairly often in response to various conditions imposed upon yeast
cells. In fact, the intensity of the color bars were often more brilliant
than the darker expressions that CMD1 tended to produce. YBR108W, over all,
seemed to be most commonly grouped with unknown genes or genes involved in
cellular organization and biogenesis. Therefore, it seems that YBR108W must
play some role in the life of S. cerevisiae. However, I can only
speculate that it might be either a cell wall protein or involved in the organization
of the cell wall at this time.
References
"CMD1/YBR109C." Saccharomyces Genome Database. Last
Update: 2002. <http://genome-www4.stanford.edu/cgi-bin/SGD/locus.pl?locus=cmd1>
Cyert, Martha S. "Genetic analysis of calmodulin and its
targets in Saccharmoyces cerevisiae." Annual Review of Genetics. 35:
647-672 (2001).
Expressin Connection Search. Saccharomyces Genome Database.
<http://genome-www4.stanford.edu/cgi-bin/SGD/expression/expressionConnection.pl?query=CMD1&noSearch=1>
Expression Help. Saccharomyces Genome Database. <http://genome-www4.stanford.edu/Saccharomyces/help/expression.html>
Fowlkes, Charless. "Clustering of Rosetta Dataset."
Genecut Homepage. 2002. <http://www.cs.berkeley.edu/~fowlkes/bio/clusters/final1/depth4/gcluster2.html>
Function Junction Search. Saccharomyces Genome Database. <http://genome-www4.stanford.edu/cgi-bin/SGD/functionJunction?locus=CMD1>
Genescape Portal Website. Curagen Corporation Website. 2002.
<http://portal.curagen.com/>.
"Phosphatidylinositol signaling system." GenomeNet
Home. <http://www.genome.ad.jp/>
"PAU6." Saccharomyces Genome Database. Last Update:
2002. <http://genome-www4.stanford.edu/cgi-bin/SGD/locus.pl?locus=pau6>
"YBR108W." Saccharomyces Genome Database. Last Update:
2002. <http://genome-www4.stanford.edu/cgi-bin/SGD/locus.pl?locus=ybr108w>
Back to John Kogoy's Home Page
© Copyright 2003 Department of Biology, Davidson College,
Davidson, NC 28035
Send comments, questions, and suggestions to: jokogoy@davidson.edu
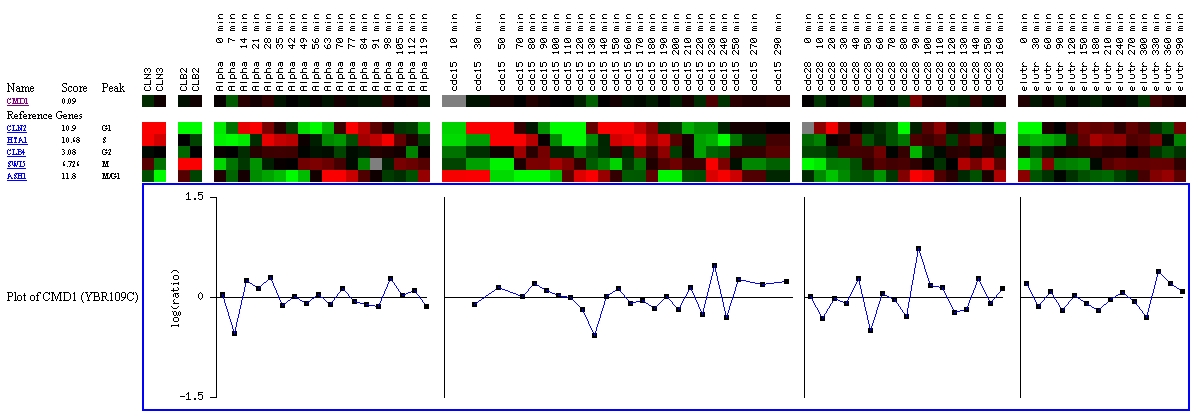 Figure
6. Screen capture from cell cycle experiment (SGD, 2002; <
Figure
6. Screen capture from cell cycle experiment (SGD, 2002; <