
As discussed in Assignment 2, SER2 is a gene which codes for a protein that is responsible for serine and glycine biosynthesis in yeast, and YGR210C is a gene near the locus of SER2 that currently has an unknown function, but is predicted to code for a zinc finger-like protein. By examining data from experiments using microarrays in cells undergoing different types of stresses and under many different types of experimental conditions, the mRNA expression of these genes can show when and under what conditions the genes are expressed. Knowing when they are expressed can provide support to the gene's suggested function or give clues to the unannotated gene's function.
SER2's expression has been reported in 15 databases under varying experimental conditions in an Expression Connection search. By comparing the databases' quantitative results of the amounts of gene repression or induction, it was determined that the greatest amount of repression and the greatest amount of reduction of SER2 was contained in the same experiment by Gasch, et al., under the same experimental conditions: Expression in response to environmental changes, YPD stationary phase experiment two (labeled "expt 2"). As shown in the image below, the greatest repression of SER2 in all the experiments (6.7-fold repression) occurred at 6h during the stationary phase, and the greatest induction of the gene occurred at day 5 of the same experiment. Included with the image is YPD stationary phase experiment one (labeled "expt 1") (Gasch, et al., 2000, <http://db.yeastgenome.org/cgi-bin/reference/reference.pl?dbid=S000059106>.)
This scale will be used for all expression ratio figures throughout this website.


This image was reproduced with permission from SGD. <http://db.yeastgenome.org/cgi-bin/expression/expressionConnection.pl?dataset=stressResponse&id=21&type=enlarge&expts=174>
Comparison of the two experimental outcomes shows how different the two results are. In experiment one, SER2 was gradually repressed over the course of 28 days. In experiment two, SER2 was very strongly repressed starting at hour 6, and was induced 8.9-fold at day 5. More testing will be required to determine which result is more accurate. In the meantime, this is only one of many examples of the discrepancies of microarray testing. However, given that SER2 is believed to be involved in amino acid biosynthesis, it stands to reason that the SER2 gene would be repressed over time because there is less need for amino acid synthesis when the cell is in a stationary phase.
Because it is believed that SER2 products are involved in serine and glycine biosynthesis, it would be beneficial to look at expression of the gene under conditions when the cells are amino acid starved. Gasch et al. also tested for amino acid starvation over time. As shown in the image below, at about 1h, SER2 was greatly induced, and following that over the course of 6 hours it became more repressed. This pattern was followed under other conditions as well, including nitrogen depletion over time and a diauxic shift over time, also shown below (Gasch et al. 2000, <http://db.yeastgenome.org/cgi-bin/reference/reference.pl?dbid=S000059106>.)


This image was reproduced with permission from SGD. <http://db.yeastgenome.org/cgi-bin/expression/expressionConnection.pl?dataset=stressResponse&id=21&type=enlarge&expts=174>
The data does not stop here. Using Gasch et al.'s web supplement, Segal et al. categorized the expressions of all the different genes in the environmental microarray into 50 different hierarchical groups of predicted gene regulators (Segal et al. 2003, <http://www.ncbi.nlm.nih.gov:80/entrez/query.fcgi?cmd=Retrieve&db=PubMed&list_uids=12740579&dopt=Abstract>.) Segal et al's data, available publicly here, classified SER2 as being a part of the TFsII regulated group, but a specific regulating gene was not found for the TFsII module under which SER2 was categorized. (Segal et al. 2003, <http://robotics.stanford.edu/~erans/module_nets/index.html>.)
However, according to SGD, SER2 is regulated under different environmental conditions by APG1, GZF3, ADR1, SUM1, IME4, and GAT2 proteins in a hierarchical regulation pattern with APG1 at the top of the hierarchy. Clustering of the environmental stresses according to the expression similarity of the gene led to some discrepancies. YPD stationary phase experiments were regulated on two different branches of the hierarchy. Amino acid starvation was regulated by GZF3 at all times except by SUM1 at hour four. Nitrogen depletion and diauxic shift was also regulated by two genes in the hierarchy: GZF3and ADR1 , and, IME4 and SUM1 , respectively (Segal et al. 2003, <http://db.yeastgenome.org/exp_modules/stressResponse/cluster_469.html>.) Intuitively, one would think that there would be one regulator for each environmental stress. The data, however, disagrees, and presents an alternative with the exception of amino acid regulation, which suggests hour four was an outlier. Both nitrogen depletion and diauxic shift regulation was dependent on the time course of the experiment. For example, in nitrogen depletion over time, GZF3 regulated the early hours, while ADR1 regulated days later. In the diauxic shift, IME4 regulated the earlier hours, while SUM1 regulated later hours. This type of regulation suggests that not only are there different regulators for different environmental conditions, but there may be more than one gene regulator for each condition. It seems that the more factors involved, such as stresses and times exposed to stresses, the more complicated the regulation of the gene is.
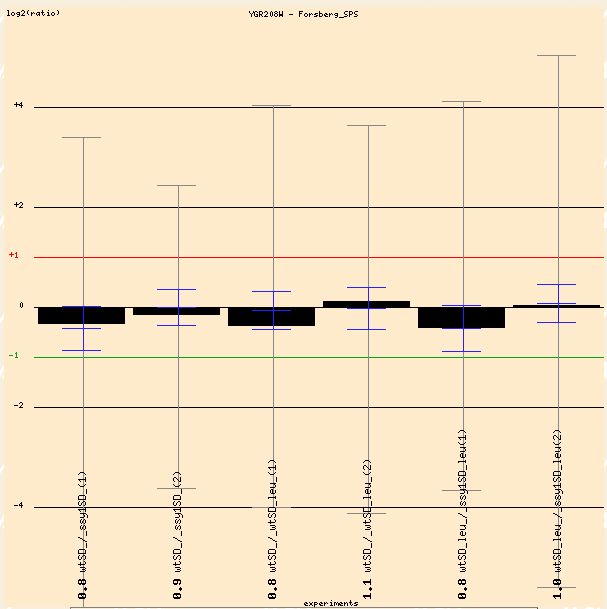
To see all the Microarray Global Viewer results, click here. Two experiments dealing with amino acids will be discussed from the Function Junction database. The first experiment by Forsberg et al. is entitled: "The role of the yeast plasma membrane SPS nutrient sensor in the metabolic response to extracellular amino acids." Forsberg et al. created a null mutation of one of the extracellular amino acid sensors in order to see how the yeast cells adjusts metabolism in the presence of amino acids, but with reduced extracellular sensitivity (Forsberg 2001, <http://www.ncbi.nlm.nih.gov/entrez/query.fcgi?cmd=Retrieve&db=PubMed&list_uids=11679080&dopt=Abstract>.) As you can see below, the expression of SER2 for each of the three experiments repeated twice comes up with little variation for the gene's expression. This may because leucine was used as an extracellular amino acid, and not serine or glycine, which SER2 is involved in synthesizing.
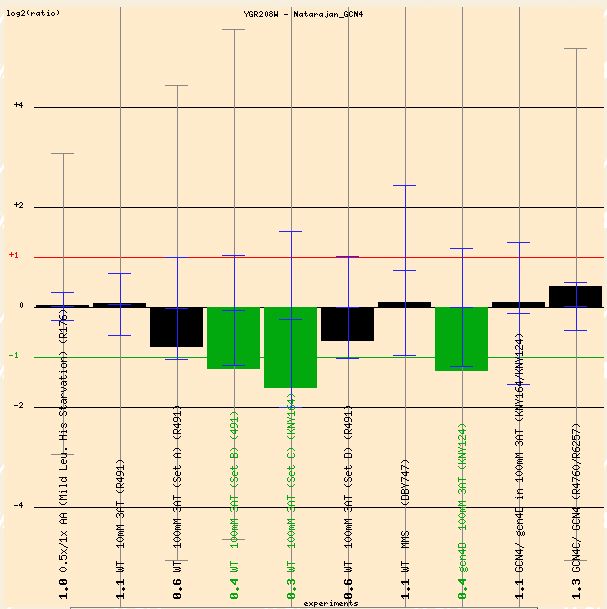
The second experiment tested GCN4 - a regulatory gene - deleted yeasts under histidine starvation, and concluded that "genes in every amino acid biosynthetic pathway except cysteine... were all identified as Gcn4p targets" (Natarajan 2001, <http://www.ncbi.nlm.nih.gov:80/entrez/query.fcgi?cmd=Retrieve&db=PubMed&list_uids=11390663&dopt=Abstract>.) As shown in the image below, SER2 was repressed. Natarajan does not account for this counterintuitive result, but the data suggests that while GCN4 is a regulator, it does not directly regulate SER2 because SER2 was repressed when GCN4 was deleted.
As outlined in Assignment 2, YGR210C is predicted to code for a zinc finger protein, but the true function is yet unknown. In general, a zinc finger protein interacts with DNA and other proteins and is a transcription factor (Huskey 1998, <http://www.people.virginia.edu/~rjh9u/znfgr.html>.) Zinc fingers are also found in ribosomal subunits, interacting directly with the mRNA (Dresios et al. 2004, <http://www.eurekah.com/abstract.php?chapid=1720&bookid=124&catid=30>.) Using gene expression data, I will discuss the functional prediction of YGR210C.
Lyons et al. used varying amounts of zinc and a mutation strain with deleted ZAP1p, a transcription factor and gene regulator, to test gene expression (Lyons et al. 2000 <http://db.yeastgenome.org/cgi-bin/reference/reference.pl?dbid=S000049083>.) The image below is YGR210C's expression ratios in the experiment.
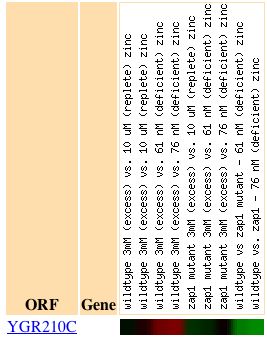
This image was reproduced with permission from SGD. <http://db.yeastgenome.org/cgi-bin/expression/expressionConnection.pl?dataset=zinc&id=4996&type=enlarge&expts=9>
Looking at the genes that produce similar expression levels in this experiment renders the following list, found here. In the list, there are loosely seven other gene's that bind to DNA or proteins , a function similar to that of a zinc finger protein. There are also genes involved with ribosomes, another functional similarity of zinc fingers. This supports the prediction that YGR210C has a function similar to that of a zinc finger protein.
Another experiment was chosen to be examined because it showed a pattern of general repression over the course of the timed experiment, and because the experiment tested histone depletion. Histones interact with the DNA to aid in chromosomal coiling and storage and cause gene repression because of the inability to translate coiled DNA. Depletion of histones in this experiment was thought to counteract the gene repression that histones cause, especially near the telomeric regions (Wyrick 1999, <http://db.yeastgenome.org/cgi-bin/reference/reference.pl?dbid=S000055640>.) As you can see here, YGR210C shows an increased repression over time. Genes with similar expression are shown around YGR210C. These protein functions include protein binding, protein biosynthesis, and ribosomal subunits, all consistent with functions of zinc fingers. Repression of a zinc finger protein in this condition would hypothetically decrease the amount of mRNA that is transcribed by ribosomes. This could counteract the gene induction caused by the absence of histones and attempt to balance the the amount of translation taking place within the cell.
A third experiment examined here is the amount of gene expression in yeast sporulation over time (Chu et al. 1998, <http://db.yeastgenome.org/cgi-bin/reference/reference.pl?dbid=S000055354>). The graph below shows the amount of repression of YGR210C over the course of the experiment. Notice that the amount of mRNA expressed decreases to about -1, and generally stays at this level for the remainder of sporolation. (Note: The Microarray Global Viewer uses this same paper in its database, but records YGR210C as being induced. Click here for data.) During sporolation, the cell is mainly replicating the genome, not synthesizing new proteins, so this expression is consistent with that of a zinc finger.
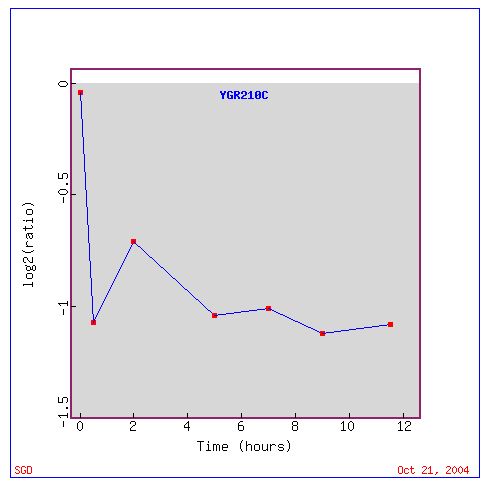
This image was reproduced with permission from SGD. <http://db.yeastgenome.org/cgi-bin/expression/expressionConnection.pl?id=4996&dataset=sporulation&type=graph>
However, when looking at genes with similar expressions, found here, four of the top ten similarly expressed genes are involved in gluconeogenesis. Using GPM1, the third most similar expressed gene, to sort expression, YGR210C became the most similar expressed gene, and more genes involved in gluconeogenesis made the list. These results indicate a lack of similar expression with genes that would function similarly as a zinc finger, and more of a similarity with genes that are involved in glucose synthesis. However, this single experiment is not enough evidence to dismiss the functional hypothesis of YGR210C.
From the data, especially from examining genes with similar expression patterns, I propose that YGR210 is involved with protein synthesis, possibly as a ribosomal subunit, or as a protein that interacts directly with DNA, such as a transcription factor. This hypothesis is very soft, as there was some contradictory data, and a cluster of similar genes expressed that are involved with pathways very much unlike those that zinc fingers and ribosomal units are involved in.
Chu S et al. 1998. The transcriptional program of sporulation in budding yeast [abstract]. In Science 282(5389):699-705. SGD Database <http://db.yeastgenome.org/cgi-bin/reference/reference.pl?dbid=S000055354>. Accessed 2004 Oct 21.
Dresios J et al. 2004 May. Ribosomal zinc finger proteins: the structure and function of Yeast YL37a [abstract]. <http://www.eurekah.com/abstract.php?chapid=1720&bookid=124&catid=30>. Accessed 2004 Oct 21.
Forsberg H. et al. 2001 Oct. The role of the yeast plasma membrane SPS nutrient sensor in the metabolic response to extracellular amino acids [abstract]. In Mol Microbiol. 2001 Oct;42(1):215-28. PubMed Database <http://www.ncbi.nlm.nih.gov/entrez/query.fcgi?cmd=Retrieve&db=PubMed&list_uids=11679080&dopt=Abstract>. Accessed 2004 Oct 21.
Gasch, AP, et al. 2000. Genomic expression programs in the response of yeast cells to environmental changes [abstract]. In Mol Biol Cell 11(12):4241-57. SGD Database <http://db.yeastgenome.org/cgi-bin/reference/reference.pl?dbid=S000059106>. Accessed 2004 Oct 20.
Huskey RJ. 1998 Nov 10. Model of Interaction of Zinc Finger Protein with DNA. <http://www.people.virginia.edu/~rjh9u/znfgr.html> Accessed 2004 Oct 21.
Lyons TJ et al. 2000. Genome-wide characterization of the Zap1p zinc-responsive regulon in yeast [abstract]. In Proc Natl Acad Sci U S A 97(14):7957-62. SGD Database <http://db.yeastgenome.org/cgi-bin/reference/reference.pl?dbid=S000049083> Accessed 2004 Oct 21.
Natarajan K, et al. 2001, Jul. Transcriptional profiling shows that Gcn4p is a master regulator of gene expression during amino acid starvation in yeast [abstract]. In Mol Cell Biol. 2001 Jul;21(13):4347-68. PubMed Database <http://www.ncbi.nlm.nih.gov:80/entrez/query.fcgi?cmd=Retrieve&db=PubMed&list_uids=11390663&dopt=Abstract>. Accessed 2004 Oct 21.
Segal E, et al. 2003 Jun. Module networks: identifying regulatory modules and their condition-specific regulators from gene expression data [abstract]. In Nat Genet. 2003 Jun;34(2):166-76. PubMed Database <http://www.ncbi.nlm.nih.gov:80/entrez/query.fcgi?cmd=Retrieve&db=PubMed&list_uids=12740579&dopt=Abstract>. Accessed 2004 Oct 20.
Segal E, et al. 2003. Module Networks: Discovering Regulatory Modules and their Condition Specific Regulators from Gene Expression Data. <http://robotics.stanford.edu/~erans/module_nets/index.html>. Accessed 2004 Oct 20.
Segal E, et al. 2003. Model 31 (50 Genes) - Stress Analysis. <http://db.yeastgenome.org/exp_modules/stressResponse/cluster_469.html>. Accessed 2004 Oct 20.
Wyrick JJ et al. 1999. Chromosomal landscape of nucleosome-dependent gene expression and silencing in yeast [abstract]. In Nature 402(6760):418-21. SGD Database <http://db.yeastgenome.org/cgi-bin/reference/reference.pl?dbid=S000055640>. Accessed 2004 Oct 21.
Contact Megan at mecastle@davidson.edu