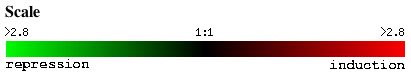
Fig. 1: This is the color scale used by Expression Connection, which is an online database that was used in collecting the majority of this information (SGD, 2004; http://db.yeastgenome.org/cgi-bin/expression/expressionConnection.pl#evolution).
My Favorite Yeast Expression
Annotated vs. Non-Annotated
This web page serves as a follow-up to the previous assignment, which provided a description of two genes from Chromosome I of Saccharomyces cerevisiae, commonly known as baker's or budding yeast. The information compiled on the previous assignment was obtained through searches of many different databases, which provided information about the molecular function, biological processes, and cellular component that these two genes are involved in. The information gathered from these searches was based primarily on the amino acid and nucleotide sequences of these two genes.
This assignment focuses on gathering information about how these two genes are expressed and utilizing this information to construct a hypothesis about the role(s) that these two genes play in the life of S. cerevisiae. As you will recall from the previous assignment FUN19 is a non-annotated gene, which means that very little information is known about this gene. A lot more information exists regarding KIN3. In evaluating the expression of these two genes the study of DNA Microarrays was utilized. DNA microarrays are created by amplifying a set of genes that you wish to examine with the use of PCR. Once the genes have been produced each individual gene is "spotted" on a microscope slide with each spot containing the DNA for a particular gene. The DNA of each spot is denatured such that it exists as single strands. Once the DNA has been denatured a set of probes are added. The probes are made by growing two sets of cells, one under control conditions and the other under the conditions wished to be explored, and harvesting the mRNA. The mRNA is separated and using cDNA complimentary strands are created with one being made of nucleotides containing a green dye named Cy3 and the containing a red dye Cy5. When these two probes are mixed with the DNA chip (the "spotted" slide) and the cDNA binds to those genes with complimentary sequence. A scanner is then used to detect which spots bound to which probes by keying in on the fluorescent dyes of the probes. The data collected by the scanner is then processed using a computer, which calculates a numerical ratio of green to red. This ratio is then converted into an image utilizing a color scale that shows induced genes in red and repressed genes in green. The more a particular gene is induced or repressed the brighter its particular color. Spots that are black indicate that the level of transcription was the same for the experimental conditions as it was for the control (Campbell and Heyer, 2003). To sum up, DNA microarrays are an important tool that allows a researcher to measure the changes in the level of transcription for a collection of genes. To see an animation of a microarray being created click on this sentence. An example of the color scale is shown below.
Fig. 1: This is the color scale used by Expression Connection, which is an online database that was used in collecting the majority of this information (SGD, 2004; http://db.yeastgenome.org/cgi-bin/expression/expressionConnection.pl#evolution).
A common technique used to analyze microarrays in hopes of determining the function of an unknown gene is the "guilt by association" method. This method allows you to predict the function of an unknown gene based on the fact that this gene is regulated in a manner that is very similar to a gene with a known function (Campbell and Heyer, 2004). I will be utilizing this method in analyzing a series of different microarrays from the Expression Connection database.
Annotated Gene: KIN3 / YAR018C
As you recall from the previous assignment KIN3 is responsible for encoding a nonessential protein kinase with an unknown cellular role. The molecular function of this gene involves protein kinase activity, catalyzing the transfer of a phosphate group from a triphosphate, typically ATP, to a protein substrate. The biological process of KIN3 involves chromosomal segregation, assisting in the separation of chromosomes into daughter cells during cell division. The cellular component for KIN3 has yet to be determined but based on the information that was collected during the previous assignment the hypothesis was developed that this gene acts somewhere within the nucleus.
Expression during Glucose Limitation (Ferea
TL, et al.) Click here
to view the entire article.
In this experiment a clonal population was used to develop three evolved
yeast populations by growing the founding population for 250 generations
in a glucose limiting media. The figure below shows the expression patterns
for the three evolved strands as well as the parental strain. Several hundred
genes exhibited altered levels of transcription within the evolved strain.
The researchers concluded that their results indicated an increased fitness
developed by adjusting their metabolism such that less glucose is fermented
and more is oxidized. In regards to the altered expression of KIN3 I was
not surprised to see that the gene was repressed in each of the evolved
strains. Since KIN3 is involved in the breaking down ATP it seems only
logical that it would be repressed seeing how with less glucose available
to produce ATP a cell would not want to use it up at a fast rate unless
a reliable method had develop to produce a continuing supply. The other
genes that exhibited similar expression patterns were involved in a varied
array of molecular functions, with many of the gene's functions unknown.
Without any consistency among the molecular function, cellular component,
or biological process of all the genes with similar expression patterns
it is impossible to associate any guilt in hypothesizing new information.
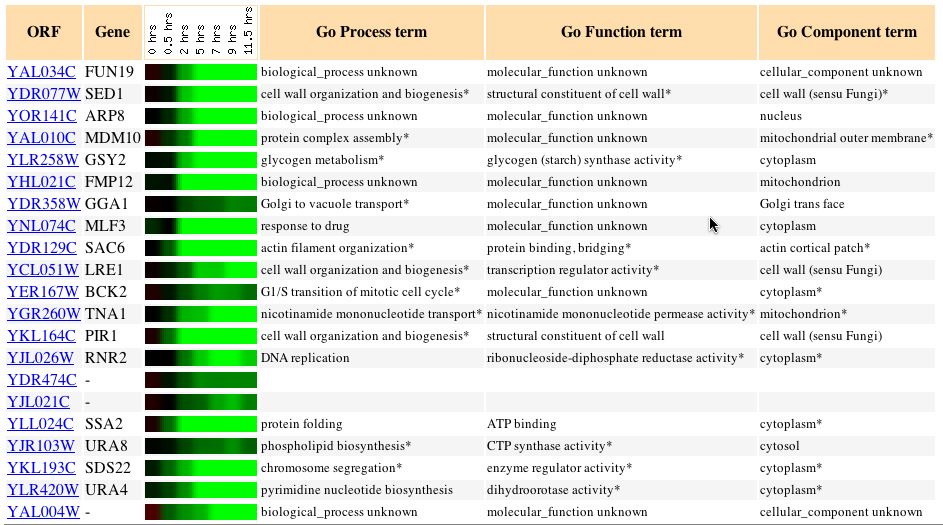
Fig. 2: The expression pattern for KIN3 during glucose limitation and
those genes with expression patterns that produced a Pearson correlation
> 0.8 (SGD, 2004; http://db.yeastgenome.org/cgi-bin/expression/expressionConnection.pl?orf=YAR018C&dataset=evolution&type=similar).
Expression during Sporulation (Chu S, et
al.) Click here
to view the abstract for this article.
In this experiment DNA microarrays containing just about every yeast
gene were assayed to evaluate their expression levels during sporulation,
a process by which diploid cells produce haploid cells through meiosis
and spore morphogenesis. The graph below illustrates the expression pattern
of KIN3 throughout the entire sporulation process. I was not surprised
that this gene was induced initially seeing how it is involved in chromosome
segregation but I would have expected it to be induced to a greater degree.
As for it being repressed at an increasing rate as the cell got further
along in sporulation I was also not surprised. Like before the genes that
exhibited expression patterns similar to that of KIN3 during sporulation
made up a group with very different molecular functions, biological processes,
and cellular components. Once again due to the varied genes with similar
expression patterns it is extremely difficult to derive any information
utilizingguilt by association.
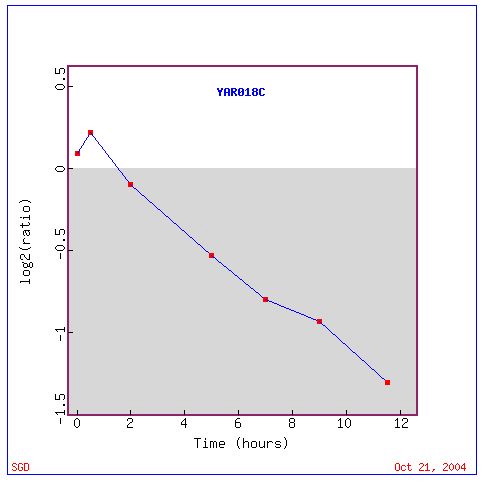
Fig. 3: Expression graph of the expression pattern of KIN3 throughout
the process of sporulation
(SGD, 2004; http://db.yeastgenome.org/cgi-bin/expression/expressionConnection.pl?id=21310&dataset=sporulation&type=graph).
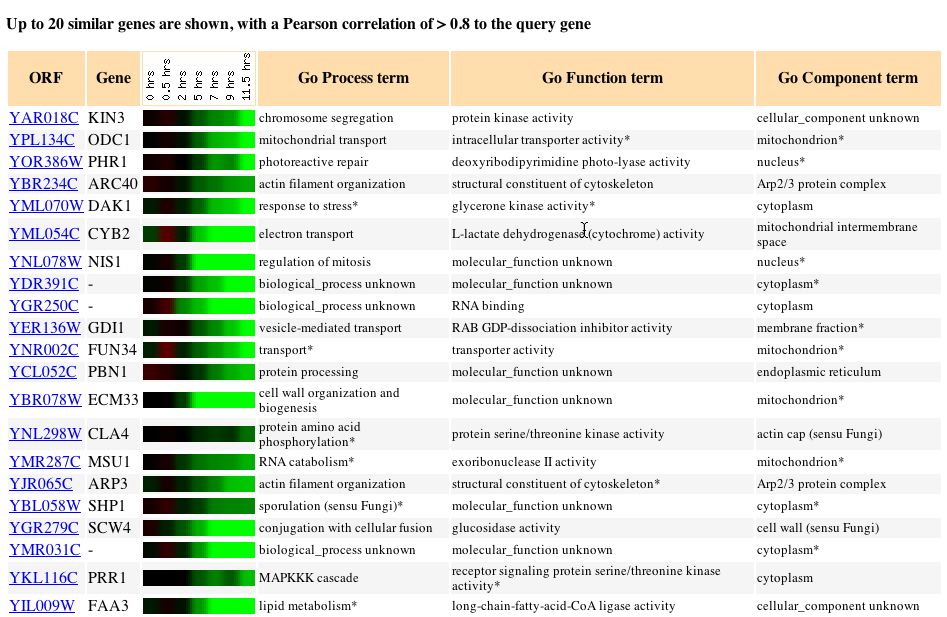
Fig. 4: The expression pattern for KIN3 during sporulation and those
genes with expression patterns that produced a Pearson correlation > 0.8
(SGD, 2004; http://db.yeastgenome.org/cgi-bin/expression/expressionConnection.pl?orf=YAR018C&dataset=sporulation&type=similar).
Expression during the Cell Cycle (Spellman
PT, et al.) Click here
to view the abstract for this article.
In this experiment three different methods were used to determine how
yeast genes varied their transcription levels throughout the cell cycle.
The three tests used were alpha factor arrest, elutriation (to purify,
separate, or remove by washing, decanting, or settling), and arrest of
a cdc15 temperature-sensitive mutant. It came as no surprise that KIN3
was initially repressed then later reduced as the cell prepared for mitosis,
during which KIN3 was induced. The return to repression most likely signified
the beginning of a new cycle. What was interesting was the repression and
induction of KIN3 seemed to closely mirror the repression and induction
of a gene that was involved in the initiation of DNA replication. Theoretically
DNA replication should precede the seperation of the chromosomes. The only
other gene that exhibited a similar expression level had an unknown molecular
function and was involved in an unknown biological process.
Click here to view the Microarray slide and the matches with a Pearson correlation of > 0.8. This image is better viewed as a link than trying to compress in this webpage.
Expression during Diauxic Shift (DeRisi
JL, et al.) Click here
to view the abstract for this article.
In this experiment DNA microarrays were used to assay the effects the
switch from fermentation to respiration has on a gene's level of transcription.
Also the varying level of expression that each gene exhibits provides evidence
as to what role a particular gene might play in this conversion. The figure
below shows the transcription of KIN3 and all the genes with similar expression
patterns. In this experiment I was unable to understand why the transcription
of KIN3 varied throughout this conversion in the manner that it did. The
four genes with the closest expression patterns each possessed a different
molecular function, cellular component, and were involved in different
biological process. Although these genes were of little help the gene that
ranked eighth in similarity was also involved in chromosome segregation
and is known to function in condensed nuclear chromosome kinetochores.
While this information does not prove the hypothesis that KIN3 functions
in the nucleus it does provide information that makes the hypothesis seem
more plausible.
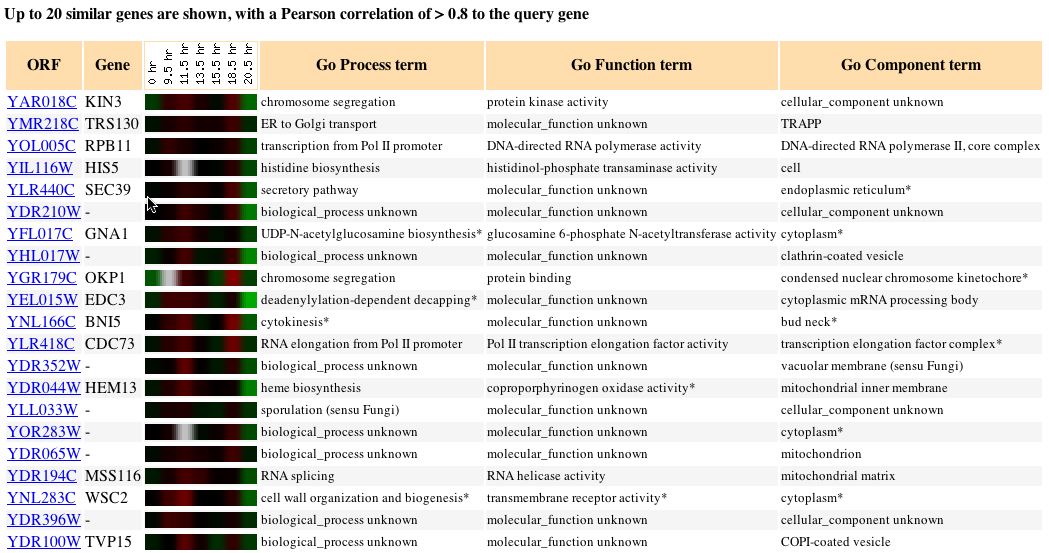
Fig. 5: The expression pattern for KIN3 during a diauxic shift and
those genes with expression patterns that produced a Pearson correlation
> 0.8 (SGD, 2004; http://db.yeastgenome.org/cgi-bin/expression/expressionConnection.pl?orf=YAR018C&dataset=diauxic&type=similar).
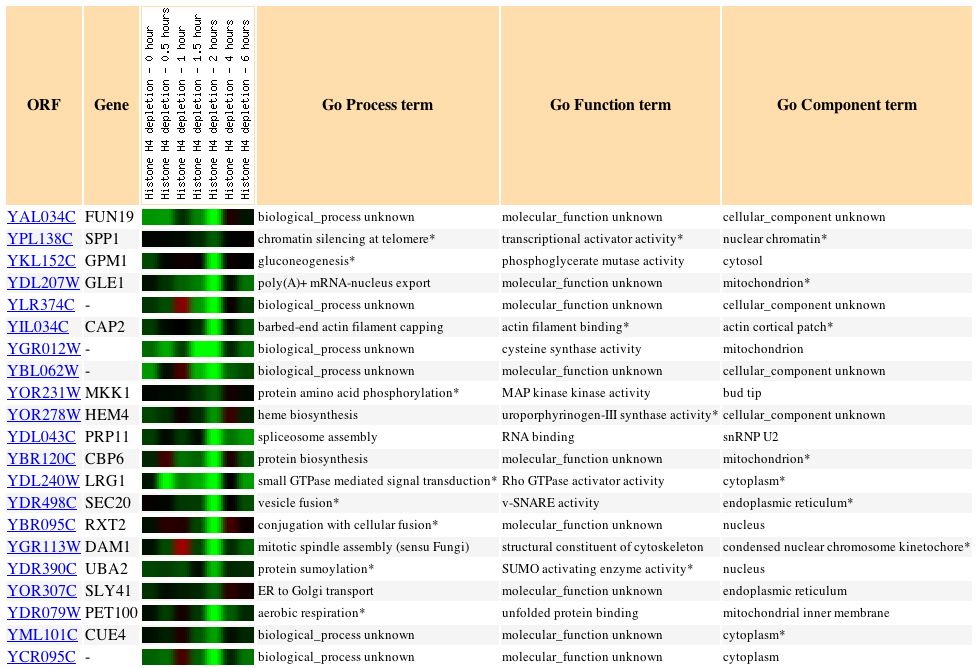
Expression during Histone Depletion (Wyrick
JJ, et al.) Click here
to view the entire article.
In this experiment the effects of histone depletion were measured by
depleting H4. Histones are responsible for packaging DNA. DNA is wrapped
around histones to form nucleosomes, which serve to modify the genes that
they store. Due to the fact that histones modify the expression of some
of the genes that are wrapped around it, it was not a complete shock that
the genes exhibiting expression patterns similar to that of KIN3 were extremely
varied. The prevelance of genes with unknown information was a little suprising
and made it difficult to draw any conclusions as to what effects histone
presence has on the expression of KIN3.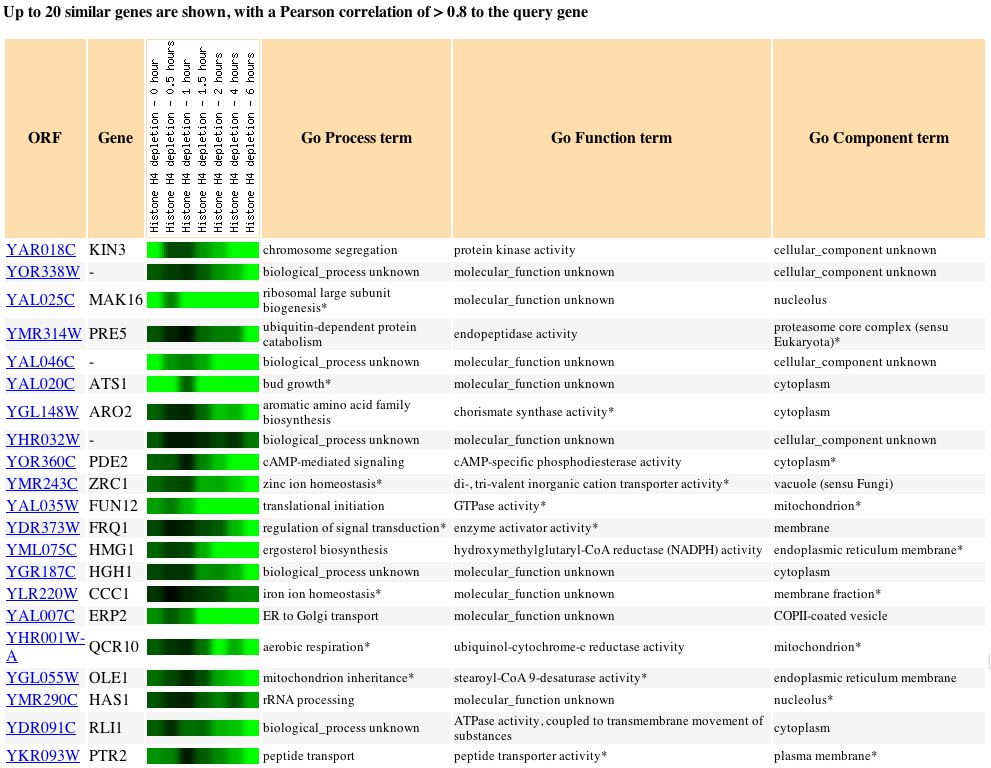
Fig. 6: The expression pattern for KIN3 during histone depletion and
those genes with expression patterns that produced a Pearson correlation
> 0.8 (SGD, 2004; http://db.yeastgenome.org/cgi-bin/expression/expressionConnection.pl?orf=YAR018C&dataset=histone&type=similar).
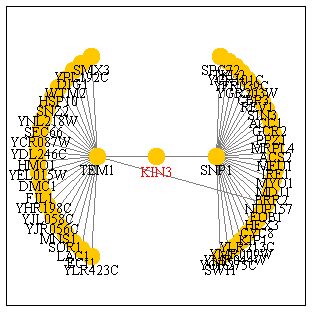
Gene Interaction
KIN3 is shown to interact with the SNP1 and TEM1 genes, each of these
genes interacts with a great many more genes. SNP1 is involved in the biological
process of nuclear mRNA splicing and functions this gene's molecular function
is binding mRNA. TEM1 is involved in the M phase of the cell cycle with
its molecular function being protein binding and GTPase activity. It makes
sense that KIN3 would interact with TEM1 seeing how both gene's functions
take place during mitosis, but KIN3's interaction with SNP1 seems somewhat
peculiar. Why would a gene that functions in chromosome seperation be involved
with a gene that functions following transcription? Perhaps SNP1 is involved
in the formation of proteins that serve to activate mitosis.
Conclusions
The data collected from examining these varying microarrays proved
showed genes with similar functions being expressed in similar ways compared
to that of KIN3. In following the "guilt by association" method this would
serve as further proof that the molecular function and biological process
of KIN3 was accurately described but at the same time these microarrays
also produced genes that were very different from KIN3. Results such as
these do not discredit the use of microarrays instead they highlight the
complexity that surrounds the human genome and the different studies microarrays
are capable of performing. as well as proving that the "guilt by association"
method should not be used as a definitive test for molecular function but
instead it should be used as a guiding light in the pursuit of determining
a function for an unknown gene. Ultimately, in the case of KIN3 the more
evidence existed in favor of the predicted molecular function than any
other particular function, which makes me confident that this gene has
been accurately described.
Non-Annotated Gene: FUN19 / YAL034C
As you recall from the previous experiment hardly any information exists concerning activity of FUN19. From the information that was collected in researching this gene I made the hypothesis that this gene was involved in transcription due to its seeming close relationship to other genes involved in the conversion of a strand of DNA to a complimentary strand of RNA.
Expression during Glucose Limitation (Ferea
TL, et al.) Click here
to view the entire article.
This experiment is the same as the one that was discussed above only
this time the focuses rests on the expression pattern of FUN19 and those
genes who exhibited patterns of expression similar to that of FUN19. Without
knowing for sure the biological process or molecular function of FUN19
it is difficult to gauge the gene's transcription pattern to provide proof
of its roles. By studying the genes that exhibit similar patterns of expression
a trend can be seen that a significant percentage of these genes are involved
in the regulation of transcription, initiation of translation and have
a cellular component in the nucleus. For the sake of clarification the
cellular component is the place in a cell where the gene product is active.
What was interesting about the expression of FUN19 is that it was not uniformly
expressed in each of the evolved strands; FUN19 was repressed the most
in the second strand followed by the first and in the third and founding
strand hardly any repression took place. I would have suspected DNA to
be transcribed at an increased rate when glucose levels began to drop so
that the yeast cell could adapt a new manner in which to produce energy.
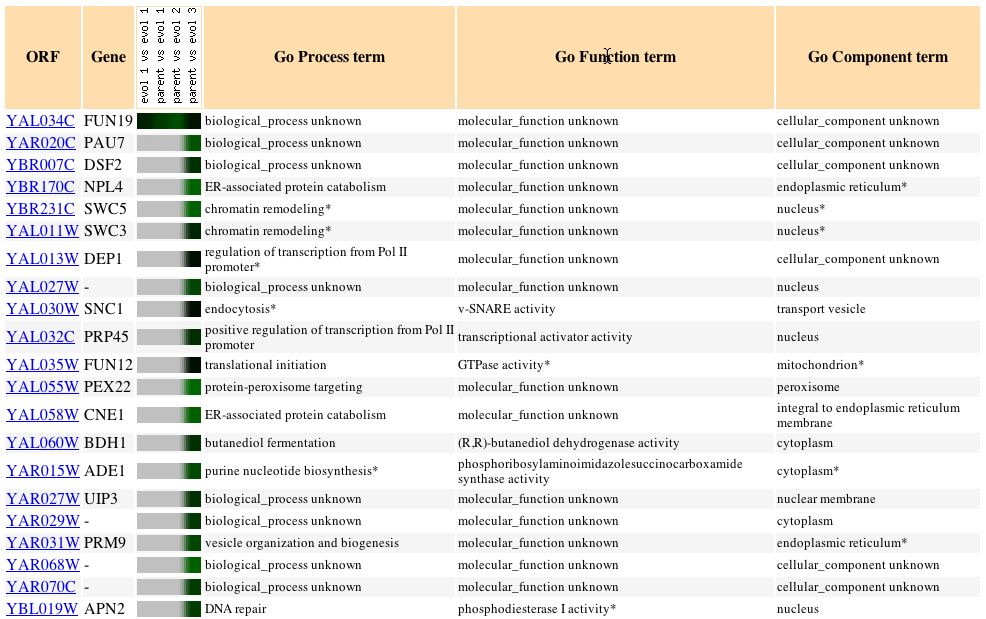
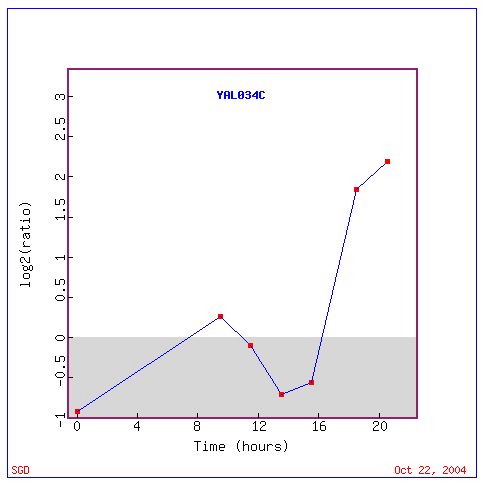
Fig. 8: The expression pattern for FUN19 during glucose limitation
and those genes with expression patterns that produced a Pearson correlation
> 0.8 (SGD, 2004; http://db.yeastgenome.org/cgi-bin/expression/expressionConnection.pl?orf=YAL034C&dataset=evolution&type=similar).
Expression during Sporulation (Chu S, et
al.) Click here
to view the abstract for this article.
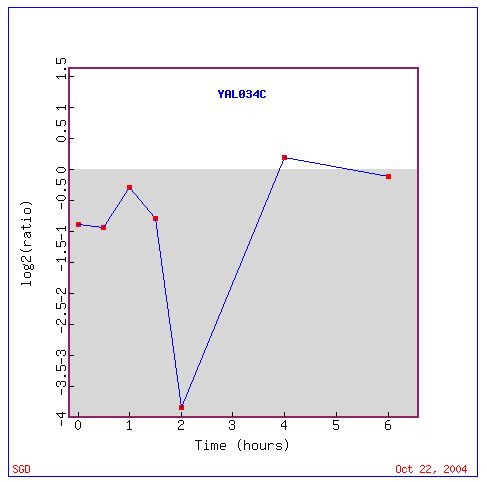
The results of this experiment showed that during sporulation FUN19
is repressed immediately with the greatest level of repression existing
at approximately 1.8. What was interesting about the genes that exhibited
similar expression patterns during sporulation was that the majority of
them had cellular components of the cytoplasm or cell wall. Seeing how
the formation of haploid cells does not a large amount of new protein to
be formed it makes sense that this gene is repressed but it does come as
a shock that no other genes involved in transcription exhibited similar
expression rates.
Expression during the Cell Cycle (Spellman
PT, et al.) Click here
to view the abstract for this article.
This experiment did not return any genes that exhibited expression
patterns similar to that of FUN19 making it impossible to infer anything
using the guilt by association approach. The varied levels of repression
and induction were not consistent for the three different tests. Whatever
the exact function of FUN19 is it seems to be involved in the cell cycle
at intermittent periods and hardly ever for periods greater than twenty
minutes.
Click here to view the Microarray slide and the matches with a Pearson correlation of > 0.8. This image is better viewed as a link than trying to compress in this webpage.
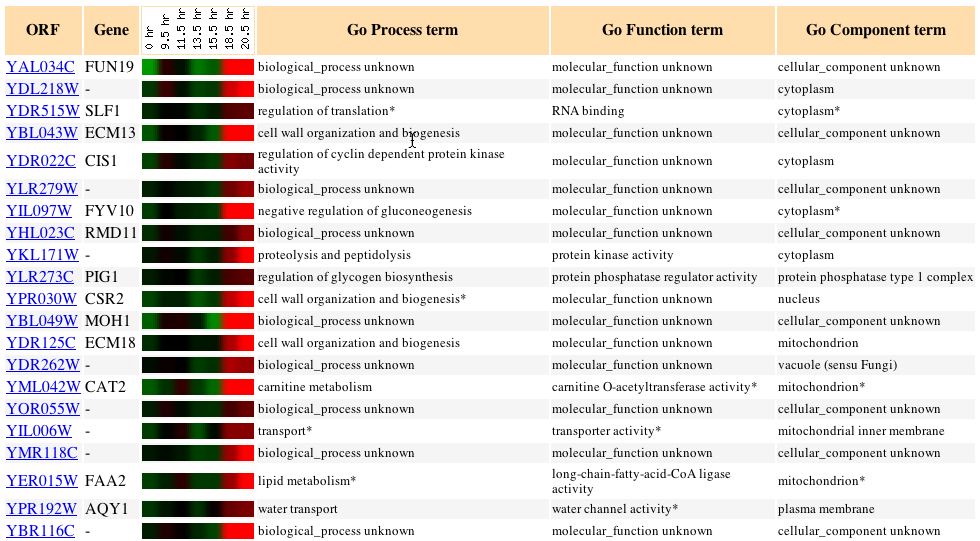
Expression during Diauxic Shift (DeRisi
JL, et al.) Click here
to view the abstract for this article.
This experiment is the same as the one that was discussed concerning
KIN3 except that in this instance the expression patterns of FUN19 will
be studied. In the conversion from fermentation to respiration FUN19 begins
the conversion repressed but it level of repression decreases and it begins
being induced after about 7 hours and continues being induced for about
four hours. After this point the gene becomes increasingly repressed only
to begin to be induced again 14 hours into the shift. This last period
of induction is the strongest with FUN19 being induced at a maximum ratio
of 2.25. I expected FUN19 to be induced in this situation as the cell alters
how it produces energy. I was somewhat surprised that FUN19 underwent a
period of repression only to be induced to a much greater extent about
six hours later. I was also surprised to see no other genes involved in
transcription. The prevelance of genes with their cellular component in
the mitochondria seemed appropriate but a much higher percentage of the
genes had components in the cytoplasm.
Expression during Histone Depletion (Wyrick
JJ, et al.) Click here
to view the entire article.
In this experiment FUN19 was once again repressed for just about the
entire time that the experiment was run. The gene was slightly induced
for a little over an hour but never at a ratio higher than 0.2. The genes
that exhibited similar expression patterns to FUN19 once again were too
varied to make any estimation about the role of the FUN19 gene.
Gene Interaction
No evidence exists that FUN19 interacts with any other proteins. Turns
out its not that fun to be FUN19 after all.
Conclusions
After all the research and study that went into this assignment I still
find myself exactly where I was at the conclusion of the previous experiment
without a definitive answer as to what the molecular function of the
KIN3 gene is. In examining the different microarray experiments available
through Expression Connection I was able to find some evidence that supported
my previous hypothesis that this gene operates within the nucleus playing
some role in the process of transcription. Although some evidence seemed
to back this hypothesis there was a lot of information that served only
to make the question seem more difficult than it had in the beginning.
Due to the large number of genes whose molecular functions and biological
processes were unknown it was difficult to utilize the "guilt by association"
method of making an educated determination as to what FUN19's role in the
life of yeast actually is. Perhaps a microarray test exists that will provide
the information necessary to ignite the determination if FUN19's role in
yeast cells but until that test is developed the only thing that can be
done is to analyze all the information that is available, study it from
every angle and under every different light until a new direction of investigation
is determined.
References
Campbell, A. Malcolm and L. J. Heyer. 2003. Discovering Genomics, Proteomics,
and Bioinformatics. Benjamin Cummings: San Francisco.
Chu S., DeRisi J., Eisen M., Mulholland J., Botstein D., Brown P.O., Herskowitz I. 1998. The transcriptional program of sporulation in budding yeast. Science 282: 699-705.
DeRisi J.L., Iyer V.R., Brown P.O. 1997. Exploring the metabolic and genetic control of gene expression on a genomic scale. Science 278: 680-686.
Ferea T.L., Botstein D., Brown P.O., Rosenzweig R.F. 1999. Systematic changes in gene expression patterns following adaptive evolution in yeast. Proc. Natl. Acad. Sci.96: 9721-9726.
[SGD] Saccharomyces Genome Database. 2003. Expression Connection. <http://genome-www4.stanford.edu/cgi-bin/SGD/expression/expressionConnection.pl>. Accessed 2004 Oct. 21.
[SGD} Saccharomyces Genome Database. 2003. Function Junction.<http://db.yeastgenome.org/cgi-bin/SGD/functionJunction>. Accessed 2004 Oct. 21.
Spellman P.T., Sherlock G., Zhang M.Q., Iyer V.R., Anders K., Eisen M.B., Brown P.O., Botstein D., Futcher B. 1998. Comprehensive identification of cell cycle-regulated genes of the yeast Saccharomyces cerevisiae by microarray hybridization. Mol. Biol Cell 9(12):3273-97.
Wyrick J.J., Holstege F.C., Jennings E.G., Causton H.C., Shore D., Grunstein
M., Lander E.S., Young R.A. 1999. Chromosomal landscape of nucleosome-dependent
gene expression and silencing in yeast. Nature 402: 418-421.