This web page was produced as an
assignment for an undergraduate course at Davidson College.
A Review of the Tax Interactome Article
This website will review a Retrovirology article published by Ramadan et al. in 2008. The article, which can be found here, describes a new technique for identifying functional protein-protein interactions through a combination of laboratory and computational methods. Specifically, the researchers looked at the interactome of Tax, a widely studied viral oncoprotein. Produced by Human T-cell Leukemia Virus type 1 (HTLV-1), this protein is believed to be involved in the onset of Adult T-cell Leukemia upon HTLV-1 infection.
Because of its clinical importance, a significant amount of research has been done to determine the functional interactions of Tax. As a result, many hypothetical Tax-protein interactions have been documented in the literature. As is often the case in genomics and proteomics, it has proven difficult to sort through this massive amount of data in order to gain a better understanding of how Tax directly affects leukemia patients. With so many candidate interactions having been identified by high throughput proteomics methods, it is difficult to even know where to start looking. It is likely true that many of the documented interactions are in fact false positives that have no biological significance. One of the goals of the Ramadan et al. paper was to introduce a generalizable system for sorting through long lists of protein interactions to highlight those of greatest importance. They chose Tax as a model protein in which to implement and demonstrate this system.
The scheme that they developed consisted of two parts that complement each other: one wet lab approach and one computational approach. For the wet lab approach, the researchers attempted to isolate and analyze all protein complexes that contained Tax. To do this, they fused an S-Tag to Tax. An S-Tag is a short peptide sequence that binds to S-agarose beads, thus allowing the fused protein to be isolated for further analysis. In addition to the S-Tag, Tax was also fused to Green Fluorescent Protein (GFP) so that the investigators could monitor Tax’s localization inside cells. The modified Tax gene was transfected into a strain of human embryonic kidney cells. After a brief incubation, the cells were lysed, and the Tax-containing protein complexes were purified with S-agarose beads. These complexes were then analyzed through Liquid Chromatography – Mass Spectrometry/Mass Spectrometry to determine what proteins were bound to Tax. The experiment was performed three separate times.
Based on the Mass Spectrometry results, the proteins were ranked based on 4 parameters. Essentially, these parameters (shown in Table 1) were intended to quantify the strength of the interaction between Tax and a given protein. Proteins that were bound at high frequencies and were predicted to be expressed at low levels in the cell received a high ranking. The proteins that scored the highest in this ranking system are shown in Table 1 and were identified as proteins of significant interest for further investigation based on the frequency of binding with Tax. The highest scoring Tax-bound protein was DNA Protein Kinase (PK), which, in the computational method described later, will again appear as an important player in the Tax interactome, which until now has yet to be studied in this context. It would have been helpful had the paper spent significant time discussing their ranking method, since this appeared to be the key aspect of their wet lab method for identifying important protein interactions. Unfortunately, however, only a few brief sentences were devoted to this topic.
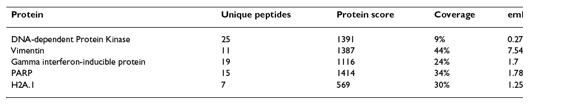
Table 1, above, shows the top 5 protein hits based on 4 parameters of the S-Tag screen. It is difficult to understand why these proteins received the 5 highest rankings, a question which is not fully explained in the text. Without this explanation, it is difficult to summarize the table other than to say that the parameters are calculated by “the number of peptides with sequence unique to the protein (unique protein), the sum of the relevant peptide confidence scores (protein score), the percentage of sequence coverage (coverage) and the relative abundance of predicted peptides from a protein (emPAI).” While the paper claims that these proteins are sorted based on the number of unique peptides, this does not appear to be the case.
Having created a ranked set of interactions through a new wet lab method, the researchers sought to complement these findings with an in silico method for analyzing preexisting data on the Tax interactome. Their method began with an intensive search through the literature. From this search, they identified any protein that previously had been documented to physically interact with Tax (67 total proteins). This list was then reduced to only those proteins that are involved in the DNA repair response, as this was the function of interest for the study. This left 4 proteins (labeled C1) on the list: Rad51, TOP1, Chk2, and 53BP1.
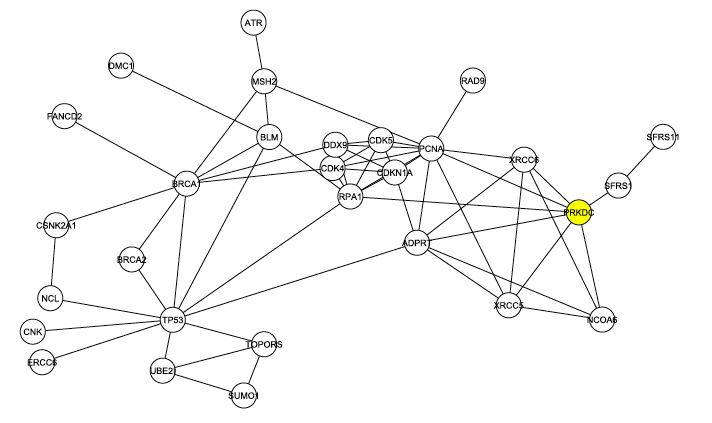
The goal for the researchers was to discover a protein candidate that both received a high ranking in the S-Tag screen and was highly linked to these 4 proteins, which are known to interact with Tax and are involved in DNA damage repair. To do this, they mined data from the Human Protein Reference Database. This allowed them to generate Figure 1 (click to enlarge).

Figure 1, above, shows the first neighborhood network graph for the C1 proteins identified in the literature search. Nodes represent proteins and lines represent protein-protein interactions. First neighborhood network proteins interact directly with at least one of the C1 proteins, shown in yellow. There are 50 total proteins shown, with 112 interactions between them. This figure highlights the location of the DNA-PK node, labeled here PRKDC and also colored yellow. The presence of DNA-PK in this initial interaction graph is significant given the results of the S-Tag screen. Furthermore, DNA-PK (PRKDC) interacts with many other proteins in the graph, ranking 8th in degree (number of edges). The node is also part of the second most connected group of nodes (called a core) in the graph. Many of the other proteins in its core were found in the S-Tag screen.
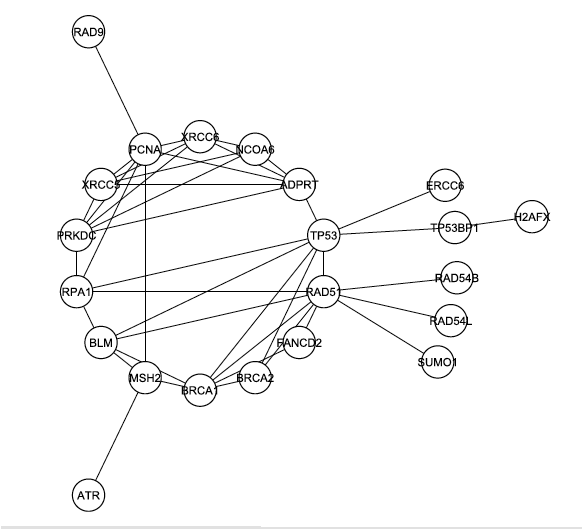
The investigators began to look more deeply at the interaction map shown in Figure 1. First they removed the 4 C1 proteins from the graph and analyzed the largest connected graph remaining. In this graph, Figure 2 below, there are 29 nodes with 60 edges. DNA Protein Kinase now ranks 6th in degree, demonstrating once again that it is likely one of the central proteins in this interaction map.
The graph from Figure 1 was modified again, this time by removing any proteins that were not documented to play a role in DNA repair. The resulting graph, shown in Figure 3 below, reveals that DNA-PK (labeled PRKDC and not colored yellow this time) is even more connected when the graph is filtered to focus on only DNA repair. In this graph, DNA-PK is in the largest core (group of intraconnected nodes) and ranks 4th in degree.
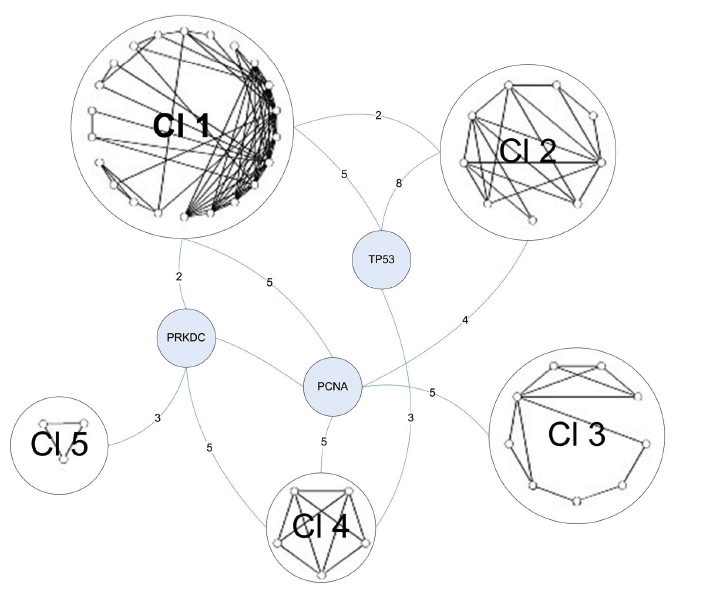
The final graph manipulation involved looking at the second neighborhood network of the C1 proteins. Second neighborhood network proteins interact with proteins that interact with C1 proteins. Six hundred and sixty-seven proteins existed in this graph, so it was trimmed down to only those proteins that were involved in DNA repair. This left 114 proteins, which were run through a novel clustering algorithm. The clustering algorithm first clustered the proteins by their core (group of intraconnected nodes). In Figure 4 below, the 3-core cluster is shown, meaning that all proteins in the graph (54 total) interact with 3 or more other proteins in the graph. Within the 3-core grouping, proteins were clustered based on similarities in their interactions. DNA-PK (labeled PRKDC) is one of three bridge proteins, meaning that it connects the various clusters together. The numbers on the edges represent the total number of connections between bridge proteins and the clusters. DNA-PK once again demonstrates a high degree of connectivity in the graph.
These graphs demonstrated a significant amount of connectivity between DNA-PK and the DNA repair response. The link between DNA-PK and Tax (aside from the evidence that they bind to each other) is less clear, however. A fairly significant jump was made when 64 of the Tax-interacting proteins were reduced to 4, simply by the justification that they were involved in DNA repair. There is insufficient justification in the paper for making this jump, suggesting the possibility that the researchers simply showed graphs that were highly connected to DNA-PK because that is the protein which showed up in the S-Tag screen. This possibility, combined with the somewhat illogical presentation of the data, makes me skeptical of the conclusions drawn by the in silico portion of this paper.
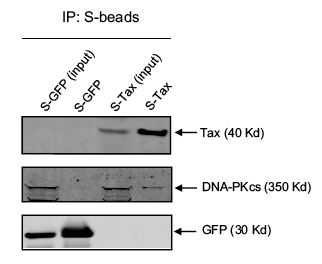
The investigators did a final experiment to confirm the interaction between Tax and DNA-PK. The affinity pull down results, shown in Figure 5 below, were obtained by expressing an S-tagged Tax and GFP (control) protein in mammalian cells. Cells were lysed and the extract was separated on SDS-PAGE (Lanes 1 and 3 below – labeled input). Some of the extract was also affinity purified with S-agarose beads, so that only the S-tagged proteins and their complexes were present. The bands from the purified extract are shown in lanes 2 and 4. Note the faint DNA-PK band in lane 4. The presence of DNA-PK in a sample of affinity purified S-Tax suggests that DNA-PK was bound to Tax. The GFP was used as a negative control to show that DNA-PK alone was not picked up by the S-agarose beads.
This paper was not written very cohesively, however it does convey a couple of important points. Firstly, physical binding between Tax and DNA-PK is demonstrated both through an affinity pull down experiment and the S-Tag screen. Additionally, DNA-PK is shown to interact with DNA repair response proteins. While, the link between these two points is not well explained or defended, the results described in this paper probably merit the further study of DNA-PK and its interactions with Tax. More importantly, the goal of the paper was to present a new method for identifying important protein-protein interactions given a large interactome. I was not thoroughly convinced that the two-pronged approach they presented was a generalizable way to accomplish this goal. I felt that a lot of the decisions about the in silico analysis were seemingly arbitrary and would find it difficult to reproduce this method on a data set of my own.
Will's Homepage
Genomics Page
Biology Home Page
© Copyright 2009 Department of Biology,
Davidson College, Davidson, NC 28035
Send comments, questions, and suggestions to: Will DeLoache