This page was produced as an assignment for an undergraduate course at Davidson College.
Lactobacillus bulgaricus Paper Summary
In April 2006, a team of 21 scientists announced in the Proceedings of the National Academy of Sciences that they had completed sequencing and annotating the Lactobacillus bulgaricus genome. Lactobacillus bulgaricus is one of two live cultures found in yogurt, and the scientists found that its genome was becoming specialized for the purpose of living in a high-lactose environment. The research team concluded, based on various observations, that the Lactobacillus bulgaricus genome was rapidly and reductively evolving. The three main pieces of evidence the scientists used included: 1. a high GC content at the third nucleotide of codons, 2. high numbers of rRNA and tRNA genes proportional to genome size, and 3. a 47.5-kbp inverted repeat in the region of replication termination. To understand how the scientists came to these conclusions, one must summarize their findings and analyze the four figures they include in their paper.
Sequence Characteristics: GC3 content
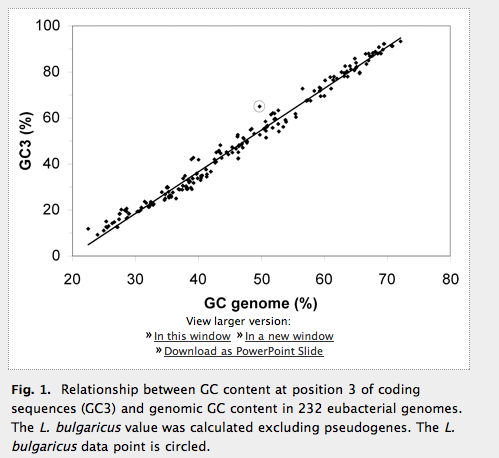
The first data one must consider are the characteristics of the Lactobacillus bulgaricus genome. Most of the inferences the scientists make are based on variations from the expected sequence. The L. bulgaricus genome is a circular chromosome 1,864,998 bps long, as determined after the completion of whole-genome sequencing. Its GC content is 49.7%, which the authors note is different from closely related species, which have GC contents of 34.6 and 34.7%. They determined that the difference in GC content is mainly due to the fact that in coding regions, the nucleotide that would be the third nucleotide in a codon in L. bulgaricus is a G or C 65.0% of the time, which is much greater than expected. The authors use figure one to illustrate their point.
|
|
Every dot in the figure represents a closely related species to L. bulgaricus, and the circled dot is L. bulgaricus itself. The x-axis represents the GC content of the entire genome, and the y axis represents the GC content of the third nucleotide in every codon. The black line is a line of best fit. Because the L. bulgaricus genome dot is above the line, the authors state that the "L. bulgaricus GC3 (65.0%) value strongly deviates from the expected value" of 54.0%. One must be wary of this statement, because the graph contains no error bars. One does not know if the differences in GC3 content in L. bulgaricus are statistically significant or just a coincedence. |
If one accepts that the GC3 content in the L. bulgaricus genome is strikingly different from L. bulgaricus's related species, then one might believe that because the codon position three evolves at a much higher rate than other codon positions in the genome (to understand why, it may be helpful to read about tRNA wobble), L. bulgaricus "is in an active phase of evolution toward a higher GC content". Scientists do not really understand why a high GC-content might be favorable or less favorable to an organism, all that is known is that GC content varies markedly from species to species. This GC3 argument is the basis for one of three reasons the authors state they believed the L. bulgaricus genome was rapidly evolving.
Sequence Characteristics: Coding Regions
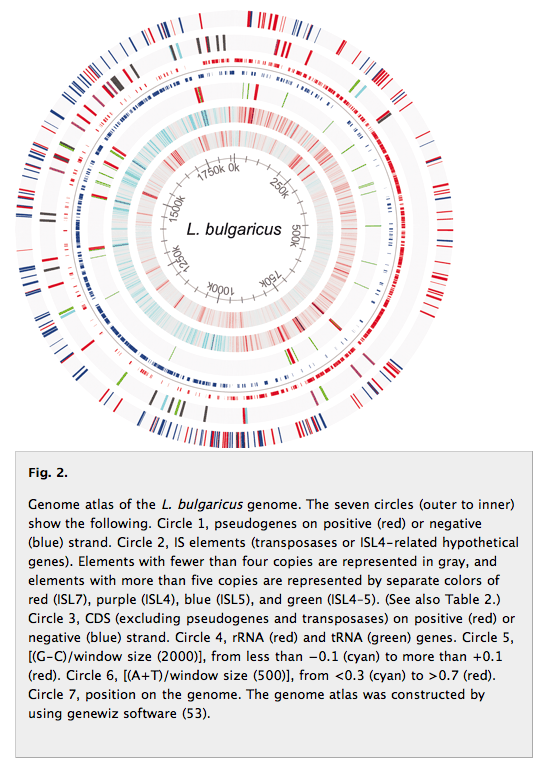
The authors analyzed where the coding regions were located throughout the L. bulgaricus genome. These findings are illustrated in figure 2.
|
|
Series of concentric circles represent different genome features of L. bulgaricus. The outermost circle shows the locations of pseudogenes and if they are on the positive (red) or negative (blue) strand. There are 270 pseudogenes regularly distributed over the genome, "with a slight underrepresentation in the region from 283 kbp to 672 kbp." The scientists claim that 270 pseudogenes is a lot, without showing data that would corrobrate this, like a graph of genome size versus amount of pseudogenes from different species. The next circle represents IS (insertion sequence) elements, color-coded based on the number of times they appear in the genome. The third circle represents putative coding sequences on the positive (red) or negative(blue) strand, not including pseudogenes. The L. bulgaricus genome is 73% coding sequences. The authors note a 2.5 kbp region starting at position 764 kbp that appears to be a CRISPR region (clustered regularly interspaced short palindromic repeats). CRISPRs may code antisence RNA that may assist the cell in fighting foreign DNA in the form of extrachromosomal elements. The fourth circle represents tRNA (green) and rRNA (red) genes. The fifth circle is the GC skew, with red being areas of positive GC skew. GC skew is helpful in determining where the origin of replication is located. The sixth circle is AT skew, with red being areas of high AT skew. The innermost circle represents the position on the genome. |
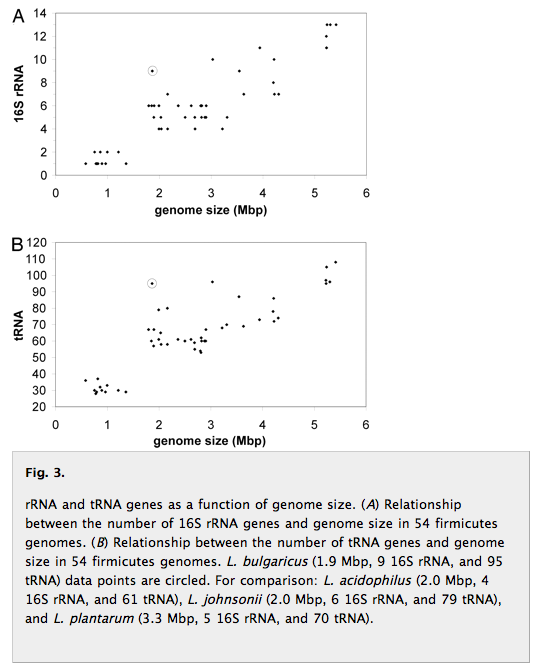
The authors note that L. bulgaricus has a relatively high number of tRNa and rRNA genes for its genome size compared to similar species, as illustrated in Figure 3.
|
|
Figure 3A illustrates genome size (x-axis) versus the number of 16S rRNA genes. The dot representing L. bulgaricus is circled. The same goes for Figure 3B, which illustrates genome size versus tRNA genes. L. bulgaricus has 50% greater tRNA and rRNA genes than would be expected for a genome of its size, and 20-30% greater tRNA and rRNA genes than the previous highest amount for a genome of its size. Genomes may have high tRNA (95 tRNAs) and rRNA (9 16S rRNA) copy numbers in order to have fast environmental response times, or, as the authors state, the high numbers of tRNA and rRNA genes "likely indicate that the genome has undergone a recent phase of size reduction." Therefore, the scientists believe that during this phase of size reduction, the genome preferentially excised non-tRNa and non-rRNA genes. This figure does not have a line of best-fit and may be harder to interpret than Figure 1. Be wary, once again, of the lack of error bars. Without error bars, one does not know if the differences are statistically significant. |
In short, the high amount of pseudogenes and high number of tRNA and rRNA genes in L. bulgaricus's genome indicate that it is rapidly and reductively evolving.
Genome Structure
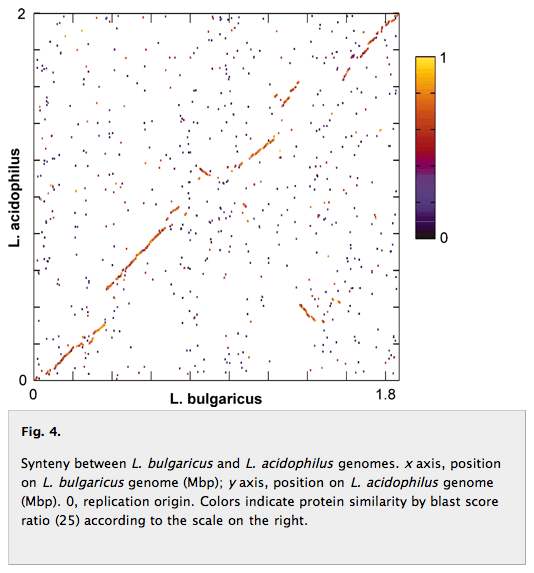
If one looks back at Figure 2, when the GC skew generally changes from red to blue (at about 920 kbp), there is an inverted repeat of 47.5 kbp, which is very rare in bacterial genomes. Its rarity may indicate that it is newly evolved, and thus that the L. bulgaricus genome as a whole is rapidly evolving. Also, in between 279 kbp and 694 kbp, there are no IS elements (this is also the region where there are less pseudogenes), while in the other 78% of the genome, IS elements are randomly distributed. This region is also where synteny is disrupted between L. bulgaricus and its closely related species L. acidophilus, as illustrated in Figure 4.
|
|
Figure 4 depicts regions of synteny between L. bulgaricus and L. acidophilus. Degree of synteny can be estimated using the scale at the right, which was determined by BLAST scores. Regions of high synteny (more alike regions) are represented by yellow. Around 55-60% of L. bulgaricus putative genes have orthologs in its two most closely related species, and 25-30% of L. bulgaricus putative genes are unique. Some of these genes are enzymes involved in the biosynthesis of purines and pyrimidines. |
Other special features of the L. bulgaricus genome include relatively few transcriptional regulators, which may reflect the fact that L. bulgaricus lives in a stable and nutritionally rich milk environment. A complete system for lactose, mannose/glucose, fructose, and glycerol transport are present. L. bulgaricus is missing many amino-acid synthesizing proteins, but does have genes for cleaving proteins in milk-rich environment and transporting those amino acids inside the cell. L. bulgaricus and S. thermophilus are the two species present as live cultures in yogurt, and they demonstrate protocooperation. This means that S. thermophilus likely uses some amino acids that L. bulgaricus cleaved, and L. bulgaricus uses CO2 and formate produced by S. thermophilus to stimulate its growth.
In conclusion, some data about the L. bulgaricus genome indicate that it is rapidly and reductively evolving, like the high GC3 content, the high proportion of tRNA, rRNA, and pseudogenes, and a large inverted sequence. This reductive evolution may be encouraged by the fact that L. bulgaricus lives in a stable, nutritionally rich environment and does not need many genes that would assist it in times of stress or environmental change.
Genomics Page
Biology Home Page
Samantha's Home Page
Email Questions or Comments.