A miRNA signature of prion induced neurodegeneration
This web page was produced as an assignment for an undergraduate
course at Davidson College.
Opinion
Most notably from this paper, I learned about methods employed for identifying transcriptional control mechanisms. Specifically control mechanism identification necessitates the use of both computational and microbiological tools to screen (ex. Microarrays and computational algorithms) and then experimentally evaluate (ex. qRT-PCR and luciferase reporter assay) control of a system. In my opinion, the authors of this paper did a good job of seeming together in silico predictions with wet lab experiments. This paper also reinforced my understanding that models are never perfect approximations of reality (as was the case of the luciferase reporter assay). I thought that the authors were honest in describing the limitations of their screening methods and predictive algorithms.
Secondly, I learned about the pathways involved in prion-related neurodegeneration. I found the closing inference about the pathology of scrapie to be interesting: scrapie may be caused by a cascade of compensatory alterations that ultimately lead to failure of neuronal function. I had not thought about the possibility that the pathology of a disease could be to simply act as a catalyst for disrupting regulatory mechanisms in the host- with the actual neurodegeneration being caused by the regulatory proteins of the host.
It is my opinion that the authors, at times, over interpreted their results. The authors made the claim that the experimentally determined and substantial induction of immune response genes could be due to indirect miRNA regulation of transcriptional factors, which in turn regulate the immune response genes. Their reasoning was that a quarter (1/4) of the putative targets of de-regulated miRNAs are involved in regulation of transcription. Their algorithm however only predicted that 20% (1/5) of the gene targets for differentially expressed miRNA are involved in transcription. Also, the largest group of differentially expressed genes was the immune response genes. Due to the ability of miRNAs to regulate multiple gene targets at once I am not convinced that the amount miRNAs that target transcription factors that only regulate immune response gene would be substantial enough to be the major inducer of the immune response genes (there is no evidence that suggest that the majority of the transcription factors targeted regulate immune response genes). The authors produced, in figure 6, an incomprehensible diagram meant to depict the degree of interconnectedness of transcriptional regulators and immune response genes induced in mouse scrapie; however they did not compare that complex diagram to a diagram of miRNA targeted transcriptional regulators and induced genes of another ontology. Thus I am not convinced that there is more miRNA indirect regulation of immune response genes than there is miRNA indirect regulation of genes of any other ontology. It is my opinion that the authors should have done a better job of stating that there is probably more underlying control of the system besides miRNAs.
Also I thought the authors could have done a better job of describing why they chose arbitration cut off points. For example how were the screening methods of qRT-PCR chosen (1.75 in 5 of 6 mice)? Also how were the 157 additional miRNAs that were subjected to qRT-PCR but not up-regulated in the in-house microarray chosen?
For the bullet points of the arguments presented by the authors click here.
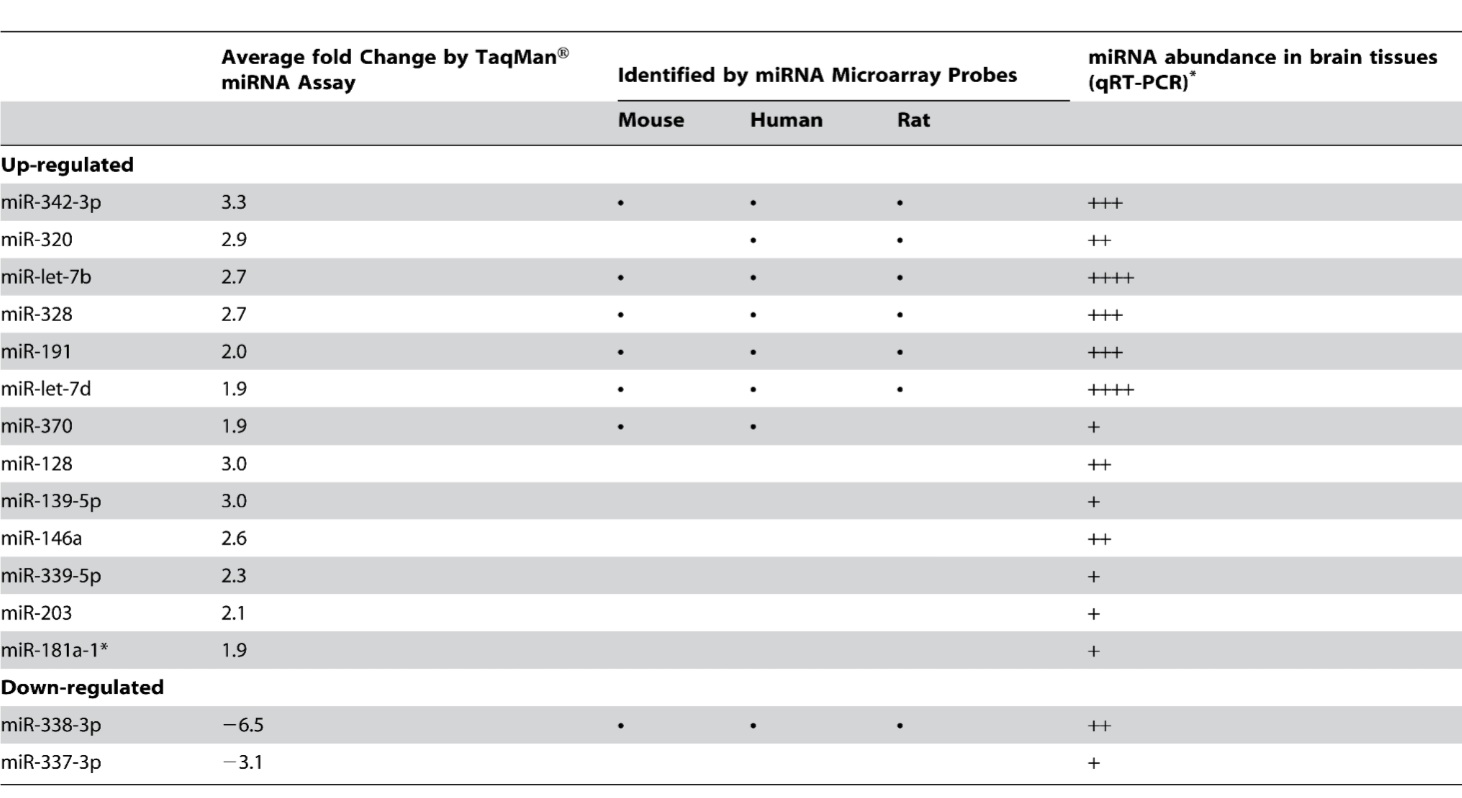
Table 1- Depicts the miRNAs identified as differentially expressed in the CNS tissues of scrapie infected mice. MiRNAs are separated into up-regulated and down-regulated groups. The first column depicts the average fold change of miRNA quantity as determined by qRT-PCR for each of the differentially expressed miRNAs. The second column depicts the species in which each differentially expressed miRNA was identified in using the in-house miRNA microarray platform technique. MiR 128, 139-5p,146a, 339-5p, 203,181a-1, and 337-3p were identified as differentially expressed solely by qRT-PCR and therefore do not present data in column 2. The third column presents the relative abundance of differentially expressed miRNA in brain tissues. More +’s correspond to a greater abundance of miRNA in brain tissues; no information is presented for the cutoff points or grouping methods used to attach the ordinal rankings.

Figure 1- Depicts the classification of prion disease-specific miRNA target genes into A) biological function and B) the canonical pathways in which they act. Pie graph A depicts that 20.3% of the differentially expressed miRNA gene targets are involved both transcription. Slightly less (18.9 %) are involved in apoptosis. 14.7% were involved in cell differentiation, 10.3% were involved in organ development, 11.1 % were involved in the death of the mouse. Growth of neurites, neurogenesis, and cell cycle progression genes made up 4.0%, 5.7% and 4.9% respectively. The determination of the biological function of the target genes were derived from the IPA database. Pie graph B depicts that the pathways in which the predicted target genes act. The pathway containing the most differentially expressed miRNA gene targets is axonal guidance signaling. Glucocorticoid receptor signaling represents the second largest group. Ephrin receptor signaling, G-protein coupled receptor, ERK/MAPK signaling, and PPAR/RXR activation contain approximately the same amount of target genes and represent the next largest group. Lastly PPAR signaling and PTEN signaling are pathways with slightly less of the differentially expressed miRNA target genes, however each pathway still contains a significant amount. (p-values depict probability that a type one error is committed in binning the target genes of the differentially expressed miRNAs into each biological function or canonical pathway)
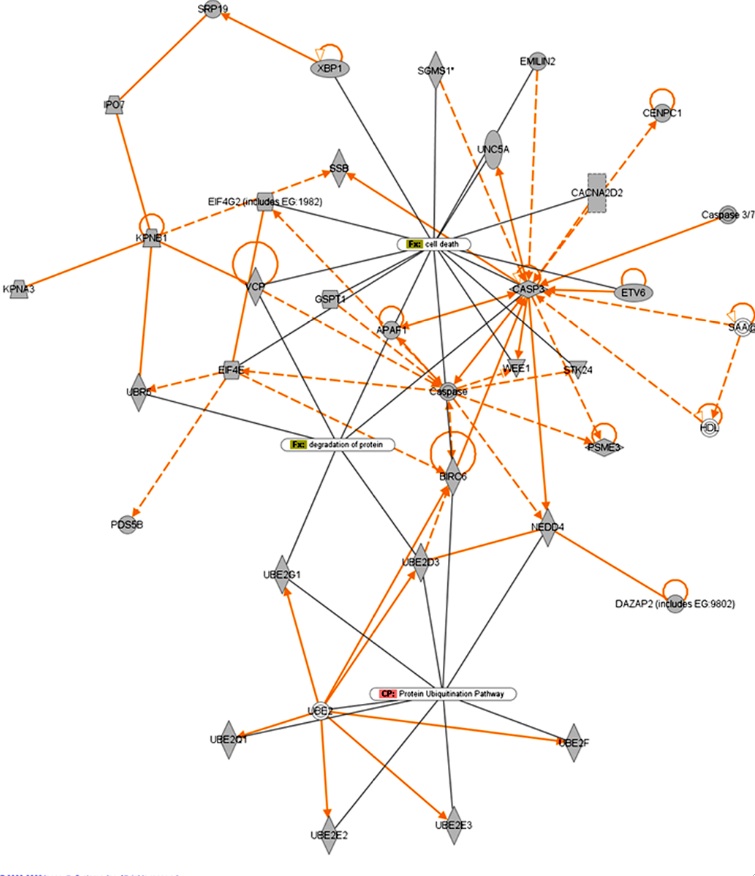
Figure 2- Depicts functional relationships of miRNA target genes involved in the UPS pathway/ unfolded protein response and cell death response. Solid lines indicate direct interactions while dashed lines indicate indirect interactions. Nodes represent putative target genes of miRNAs that are de-regulated in scrapie infection in mice. The diagram shows that there is a high degree of interaction between genes that are involved in the UPS and protein degradation pathways that are linked to cell death.
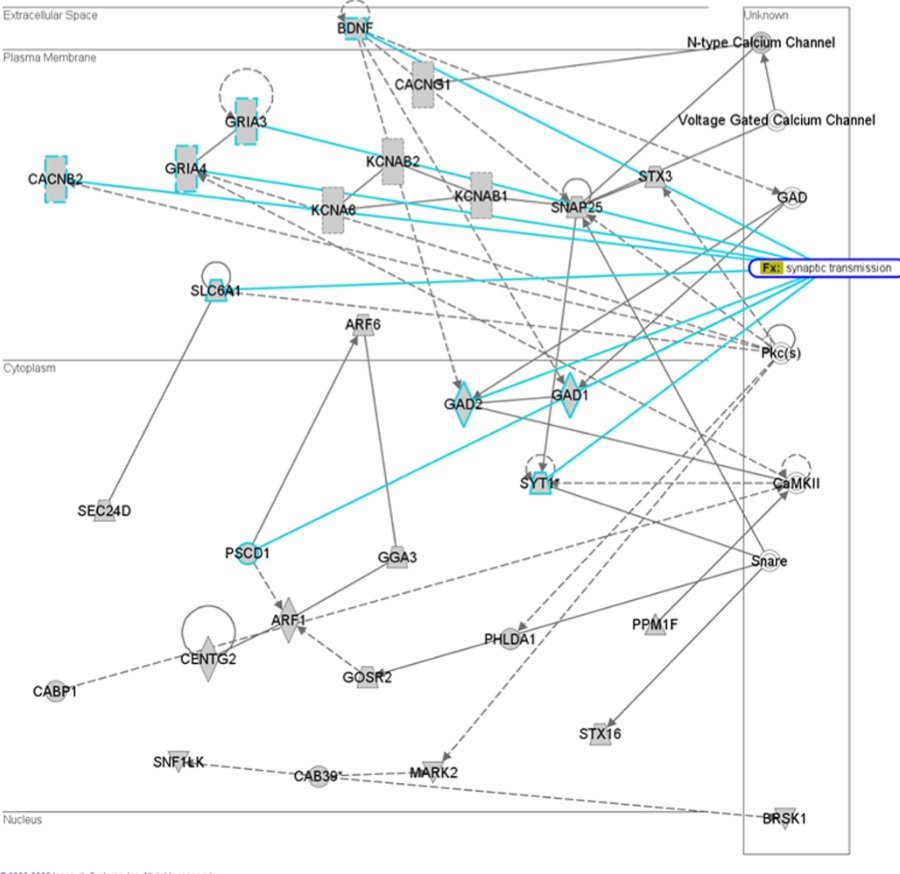
Figure 3- Depicts a network of 29 miRNA target genes that have a high probability of interacting within neuronal synapse. Solid lines indicate direct interactions while dashed lines indicate indirect interactions. The authors suggest that deregulation of these genes could result in synaptic dysfunction.
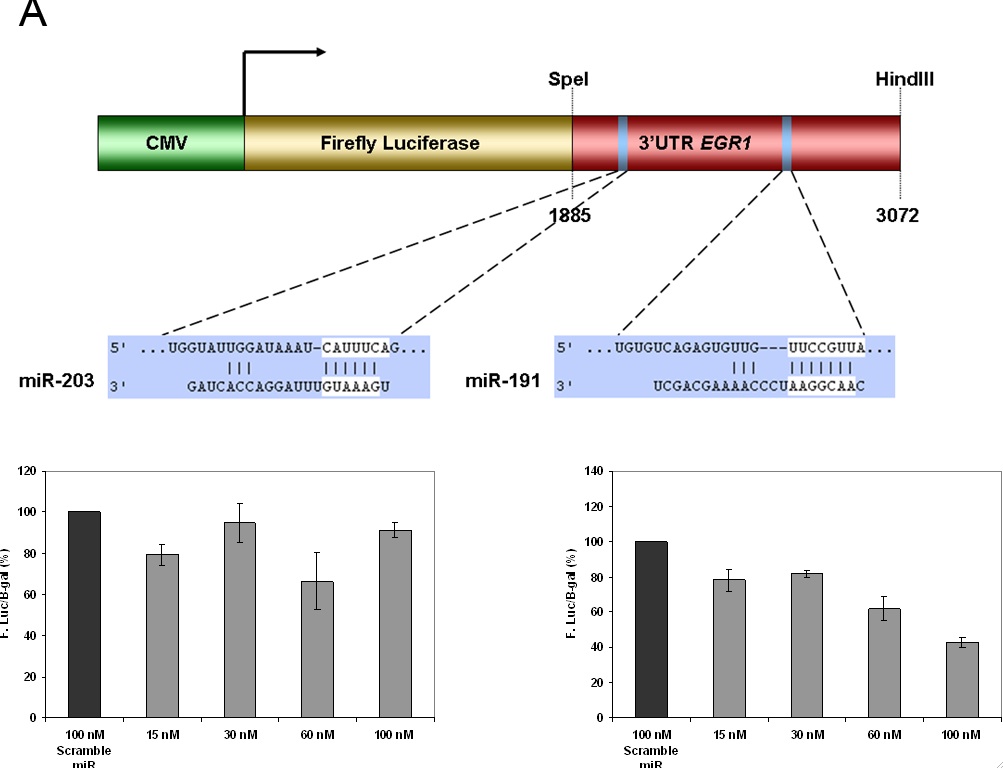
Figure 4- MiRNA target gene validation of EGR1 using a luciferase reporter gene assay. A) Represents the schematic representation of the luciferase construct used in the reporter assay. miR-203 and miR-191 are binding sites for the two predicted miRNA regulators of EGR1 in the 3 (prime) UTR region. Their respective positions in the construct are shown. B) Dose dependent reduction in the expression of luciferase activity when HeLa cells are co-transfected with miR-203. There is no statistical difference reported between the doses. C) Co-transfected with miR-191, there is a significant difference. The computer algorithm accurately predicted one miRNA regulator but incorrectly predicted one as well. Thus the algorithm is a useful as a screening tool but is not a perfect approximation of reality.
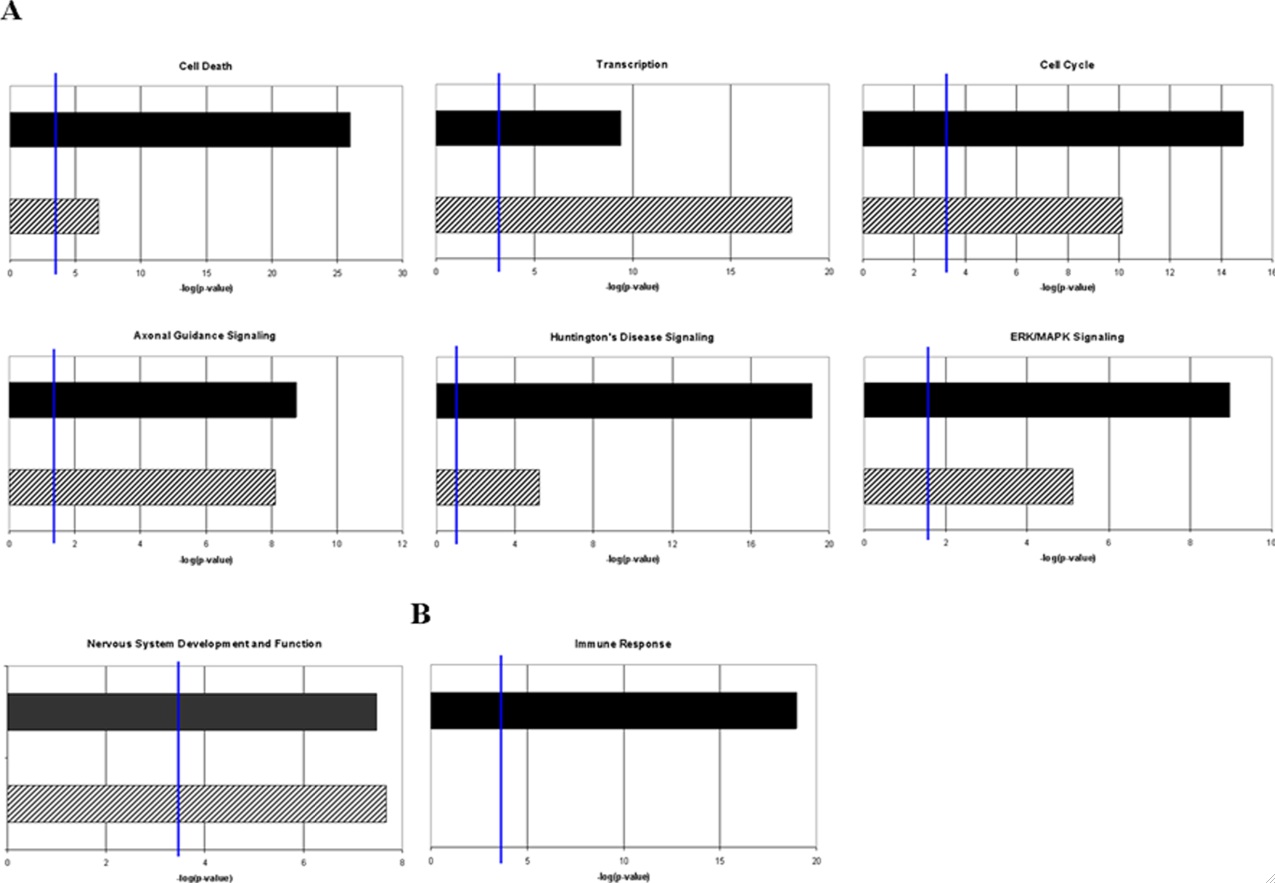
Figure 5- Comparison of the gene ontology assignments for the putative target genes of differentially expressed miRNAs, compared presented with genes identified to be differentially regulated in prion diseases. A) Deregulated genes that show a correlation with deregulated prion related genes B) Functionally related genes that are strongly de-regulated in mouse scrapie but have little or no representation among putative target genes of miRNAs that exhibit differential expression in prion disease. The figure shows that while some gene ontology assignments for miRNA targets correlate with differential miRNA expression, there is more complex biology taking place (as is the case with the induction of inflammatory immune response genes).

Figure 6- Functional relationships of de-regulated immune response related genes in the brains of mice infected with scrapie and the putative transcription regulator genes that are targets of miRNAs similarly deregulated. This figure depicts a high degree of interaction between the transcription factors that are targets of de-regulated miRNAs and de-regulated immune response genes in the brains of mice infected with scrapie. This figure attempts to explain the complex biology behind the induction of immune response genes in the CNS of mice infected with scrapie without any of the immune response genes being targets of differentially expressed miRNAs. Nodes colored in red denote up-regulated genes in mouse scrapie, green nodes denote down-regulated genes. Nodes with an orange border denote the putative targets of miRNAs deregulated in mouse scrapie.
Genomics Page
Biology Home Page
Email Questions or Comments. Do NOT contact the author for any other reason than questions or comments with respect to the webpage
© Copyright 2008 Department of Biology, Davidson College,
Davidson, NC 28035