This web page was produced as an assignment for an undergraduate course at Davidson College.
Tibetan Gene for High Altitude Adaptation
Review of Yi et al.'s 2010 paper "Sequencing of 50 human exomes reveals adaptation to high altitude"
The paper "Sequencing of 50 human exomes reveals adaptation to high altitude," by Yi et al. (2010), explains their study searching for genes selected for the high altidude living of Tibetan Plateau populations. It illustrates three main topics that I learned as a reader. For example, their discussion about the divergence between Tibetan populations and the somewhat lower elevation Han population explained the history of their separation (Yi et al., 2010). This information puts the comparison of gene frequency differences into perspective, while it also highlights the power of their methodology to examine gene frequency variation evolutionarily. Moreover, when coupled with evolutionary information, the article highlights the potential for sequencing techniques to find SNP's that lead to discoveries about functional genes (Yi et al., 2010). With the identification of genes through this method, the article also begins to explain a possible genetic foundation to previously seen heritable phenotypes from hypoxic environments.
Opinion of the Article
Roses:
I liked how this article showed the potential of Yi et al. (2010)'s methodology. They did a good job of showing the utility of their method on a large scale. However, they also touched on how their work can also yield more detailed information. Their case study approach with the gene EPAS1 does a good job of showing the steps and intricacy of how this type of data can be examined. In addition, including brief discussions of other candidate genes demonstrates how they could analyze those results in a similar way, supporting the broader implications of their methodology.
Thorns:
The main fault I found with this article was their conclusion about the timing of the Han-Tibetan divergence. They do not thoroughly explain how they got their result or even hint at why their methodology and data could provide this kind of result. At the same time, they continue to suggest that the speed of EPAS1's SNP evolved is exceptional and they highlight this result along with their other analyses as a major conclusion. Without more discussion, it seems that the timing result is too large-scale of a conclusion for just using the two population's data. When they use this result to further their data analysis, they propagate this possibly over-reaching conclusion.
Summary of the Article
Background:
The inhabitans of the Tibetan Plateau live at and above 4300 m with oxygen concentrations 40 percent less than sea level areas (Yi et al., 2010). Thus, the people with ancestry in the region have had to adapt to a hypoxic environment. The physiological adaptations to high altitude living include many phenotypes seen in the Tibetan populations such as hemoglobin levels and oxygen saturation in blood in certain situations (Yi et al., 2010). As these traits have been found to be heritable, Yi et al. (2010) capitalized on evidence of natural selection acting based on oxygen conditions to see if they could determine genes selected for in the population based on genome sequencing and SNP analysis.
Methodology:
For their population of interest, Yi et al. sequenced the genomes of 50 unrelated Tibetan individuals from two sub-populations both living above 4300 m (2010). They sequenced around 20,000 exons and nearby regions to a read depth of 18, at which point they aligned them based on the human reference genome and to look for SNP variationin each Tibetan population (Yi et al., 2010). Using the two Tibetan populations as one, they compared the SNP’s found to people of Han ancestry (mid-elevation) living in Beijing. Yi et al. chose the Han population because overall, they have not differentiated much from the Tibetans (2010). They calculated an approximate divergence time from the frequencies of similar sequences between the Han and Tibetan populations. Their data came from the 1000 Genomes project’s HapMap database (Yi et al., 2010).
In order to see patterns of SNP frequency differences better, Yi et al. compared the Han and Tibetans to a Danish population (2010). Yi et al. used population branch statistics (PBS), which measure the divergence of genes or SNP’s between populations over time based on in and out of group differences, to analyze the frequency differences (2010). This comparison allowed them to see which SNP frequencies the Tibetans and Hans differed in because of natural selection after Han and Tibetan divergence because the Danish population grounded the data. When they found an SNP and gene with a high PBS value, they confirmed their analysis by using a computer genome simulation to see how often random SNP’s show as outlier of PBS values (and thus divergence) as that candidate gene (Yi et al., 2010). Finally, they confirmed the candidate gene’s (EPAS1) SNP’s correlation to blood-related phenotypes with association testing.
Results:
From their sequence comparison with the reference genome, Yi et al. found 53 SNP’s in the Tibetan population, and both the Tibetan populations gave similar frequency results (2010). In addition, the Han and Tibetan populations had similar frequencies of most SNP’s, but an intronic SNP near EPAS1 had a much higher frequency in the Tibetans and was an outlier compared to the overall covariance result (Yi et al., 2010). This frequency data led Yi et al. to approximate the time of divergence of the Tibetans from the Han at 2750 years ago (2010). When they added the Danish population to their analysis, the high PBS value SNP’s included some genes already associated with oxygen regulation and transport (Yi et al., 2010). Of these, the EPAS1 SNP had the highest PBS value; thus, they determined it likely had changed the most since Han-Tibetan divergence than any other candidates (Yi et al., 2010).
The SNP associated with EPAS1 was intronic, and Yi et al. speculated that it has a role in regulating the gene (2010). Moreover, this SNP differed from previous SNP’s in EPAS1 related to exercise. In their association tests, Yi et al. found that the Tibetan EPAS1 allele correlates to low red blood cell count and low hemoglobin concentration in both populations (2010).
Figures Analysis:
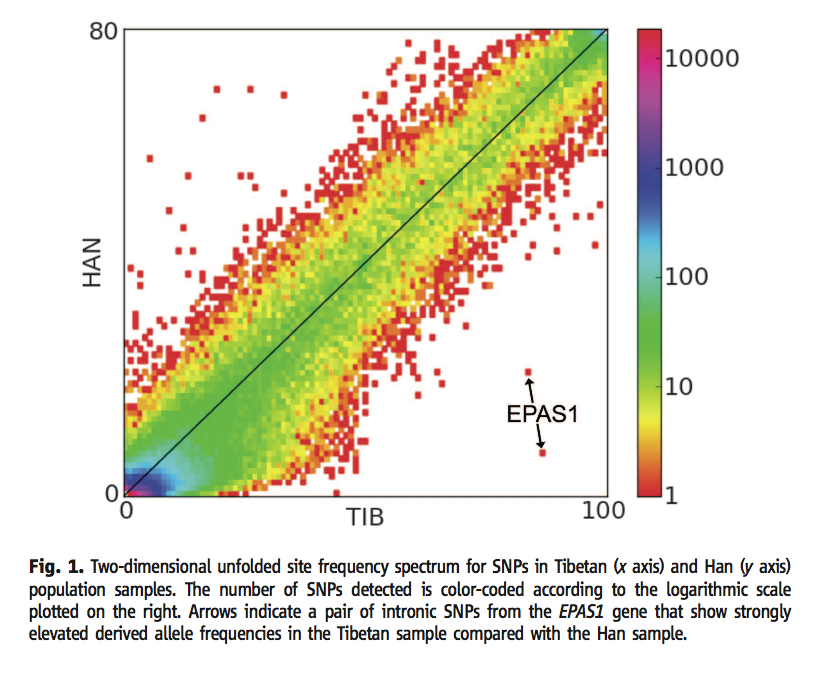
Figure 1 (Yi et al., 2010) shows the number of SNP's at varying frequencies in the Han and Tibetan populations. The color of each dot represents how many SNP's have that frequency ratio between the two populations. The x and y axes shows any difference in the frequency of the given SNP, and most of the SNP's had the similar frequencies in both populations. Any outlier dots from the overall covariance present more in the Tibetan population represent candidates for oxygen-related genes selected for living a region with an extremely low oxygen concentration. The two outlier dots on this figure are intronic SNP's around the EPAS1 gene. Permission to reproduce figure granted 28 February, 2012.
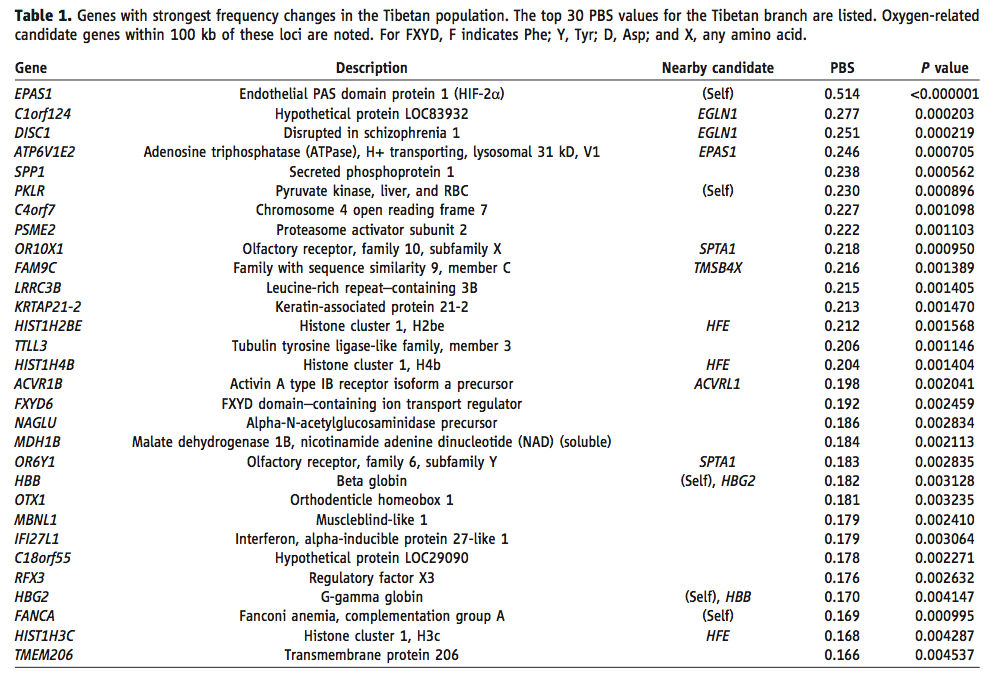
Table 1 (Yi et al., 2010) shows the statistically significant genes near SNP's with high PBS values found by sequencing. The second column on the right lists other, oxygen-related, genes near enough to the SNP and associated gene for the SNP to affect them. It highlights how high a PBS value and low a P value EPAS1 has when Yi et al. (2010) compared Tibetans with the Han and Danish populations. Only a few SNP's correlated directly with oxygen related genes like EPAS1's. The table also serves as a reference for the other candidate genes discussed at the end of the article. Permission to reproduce table granted 28 February, 2012.
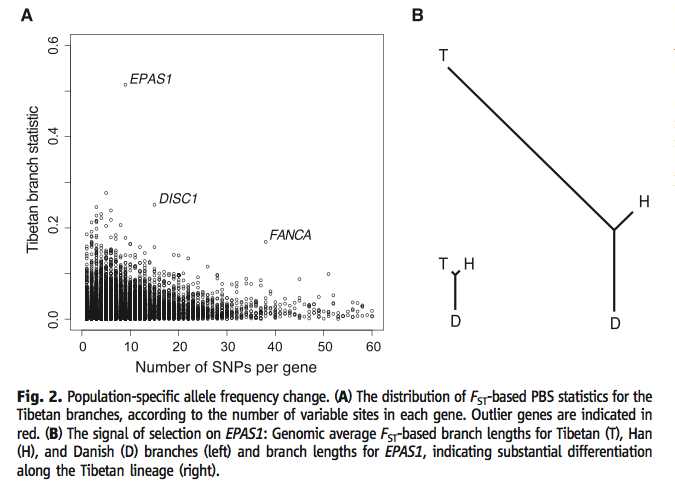
Figure 2 (a) (Yi et al., 2010) puts the PBS data from Table 1 into visual form, and it adds a representation of the amount of variation within each gene by clustering the data. The arrangement of the genes by amount of variation enhances how different the outlier genes are from the genes with otherwise similar variation. It highlights the frequency difference of SNP's between the Tibetan population and the others sorted by the total number of SNP's related to each corresponding gene. It also denotes some of the other genes discussed at the end of the article. EPAS1 has the highest PBS value of all. Figure 2 (b) (Yi et al., 2010) shows trees comparing PBS values (and thus frequency variation from the other branches). Branch length represents the relationship betwee the PBS values of each population. The left tree comes from an average for all genes, and shows that the Han and Tibetans are similarly different from the Danish. The right tree only uses EPAS1 data, and the much longer Tibetan branch illustrates the difference between the Han and Tibetans. At the same time, comparing the left and right trees to each other shows that EPAS1 SNP frequency differences are more than the average differences between genes. Permission to reproduce figure granted 28 February, 2012.
Discussion and Conclusion:
Looking at the function of the EPAS1 gene, Yi et al. (2010) explain that it is part of the hypoxia-inducible factor family of transcription factors, has narrow activity range, and is associated with an increased number of red blood cells (aka. erythrocytosis). From this known function, Yi et al. speculate that the SNP their study focused on likely affects the regulation of red blood cell production (2010). Along those lines, because the SNP focused on was associated with low levels of red blood cells, but an increase in red blood cell concentration is a typical response to hypoxic stress, Yi et al.’s data suggest the Tibetans have been selected to be able to deal with hypoxia without this response (2010). The evolution of this allele in Tibetans, based on Yi et al.’s analysis of the divergence timeline between Han and Tibetan populations, leads them to suggest that this allele has spread incredibly fast (2010).
While a majority of the article focuses on EPAS1, Yi et al. (2010) also discuss SNP’s related to other oxygen-related genes. The other candidate genes (high PBS values) for natural selection to have acted on in response to high elevation include an intronic SNP near adult and fetal hemoglobin genes HBB and HBG2, anemia-associated genes for red blood cell production and maintenance FANCA and PKLR, some disease genes linked to low oxygen during pregnancy (schizophrenia and epilepsy) or a gene part of the hypoxia response pathway (EGLN1), genes for red blood cell shape, and gene associated with iron storage (Yi et al., 2010). Of these candidates, other studies show that the high-altitude Andean population has selected variation in the fetal hemoglobin (HBG2) and EGLN1 genes (Yi et al., 2010).
The detailed analysis of EPAS1 SNP and the overview of other candidate SNP's of oxygen-related genes underlines the general success of the study: Yi et al. (2010) used the sequencing of genomes to find genes of a specific genre and to learn about the evolution of those genes.
Overall Opinion:
In general, I found this study's methodology to flow very well and fit the authors' purpose. Their results come across as trustworthy because of the detail they put into validating each result with a different method. They were able to add layers to their main methodology in order to make more conclusions and verify their earlier results. Moreover, their decision to follow one SNP and its associated gene highlighted the potential importance of the rest of their results. At the same time, it successfuly showed how their seemingly wide-ranged sequencing method can lead to new information about the genetic basis and the evolutionary path for previously observed phenotypes of a very specific category. The simple approach of sequencing exomes and comparing them to the established data from the 1000 Genomes Project highlights the power of using such broad databases when the research can be focused with information like phylogeny.
References:
Yi, X., Liang, Y., Huerta-Sanchez, E., Jin, X., Cuo, Z. X. P., Pool, J. E., Xu, X., Jiang, H., Vinckenbosch, N., Korneliussen, T. S., Zheng, H., Liu, T., He, W., Li, K., Luo, R., Nie, X., Wu., H., Zhao, M., Cao, H., Zou, J., Shan, Y., Li, S., Yang, Q., Asan, Ni, P., Tian, G., Xu, J., Liu, X., Jiang, T., Wu, R., Zhou, G., Tang, M., Qin, J., Wang, T., Feng, S., Li, G., Huasang, Luosang, J., Wang, W., Chen, F., Wang, Y., Zheng, X., Li, Z., Bianba, Z., Yang, G., Wang, X., Tang, S., Gao, G., Chen, Y., Luo, Z., Gusang, L., Cao, Z., Zhang, Q., Ouyang, W., Ren, X., Liang, H., Zheng, H., Huang, Y., Li, J., Bolund, L., Kristiansen, K., Li, Y., Zhang, Y., Zhang, X., Li, R., Li, S., Yang, H., Nielsen, R., Wang, J., Wang, J. 2010. Sequencing of 50 human exomes reveals adaptation to high altitude. Science 329: 75-77.
Genomics Page
Biology Home Page
Email Questions or Comments
© Copyright 2012 Department of Biology, Davidson College, Davidson, NC 28035