This web page was produced as an assignment for an undergraduate course at Davidson College
Song et al. Figure 1
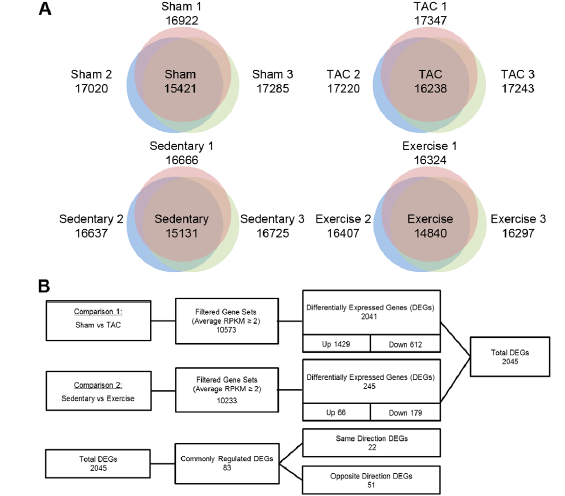
Figure 1. A) Venn diagrams show the number of genes detected at least once for models in each of four test conditions. TAC is the PAH induced treatment group and Sham is the control for TAC. Exercise is the PHH induced treatment group and Sedentary is the control for Exercise. N=3 models for each test condition (e.g. TAC 1, TAC 2, TAC 3). A gene is considered expressed in a certain test condition it is observed in all three models. B) Diagram shows how DEGs were determined and described. Genes considered expressed in TAC or Sham were filtered to exclude RNAseq results below a cutoff of 2 RPKM (reads per kilobase of exon model per million mapped reads). Then DEGs were identified and placed in one of two categories: up (i.e. up-regulated in TAC vs. Sham) or down (down-regulated in TAC vs. Sham). The same procedure was followed for Exercise vs. Sedentary groups. Total observed DEGs in PAH (TAC vs. Sham) and PHH (Exercise vs. Sedentary) were combined, then DEGs common to PAH and PHH were identified. Common DEGs were separated into those regulated in the same or opposite directions between PAH and PHH.
Image reprinted under a Creative Commons license from Song et al. 2012