This web page was produced as an assignment for an undergraduate course at Davidson College
Song et al. Figure 3
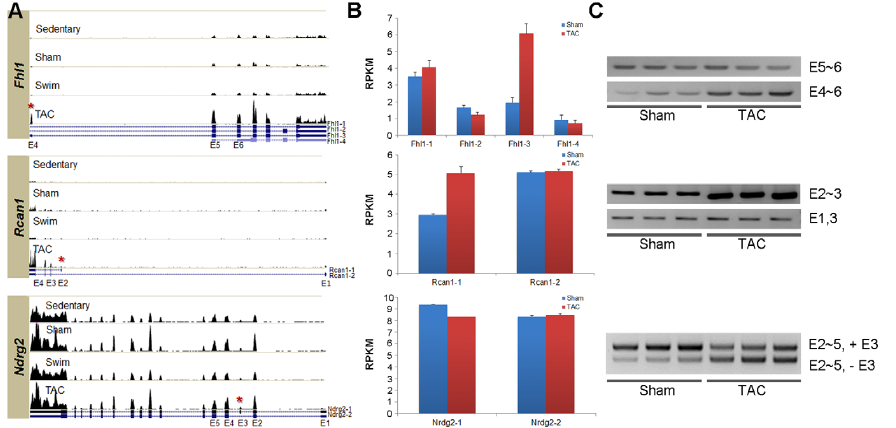
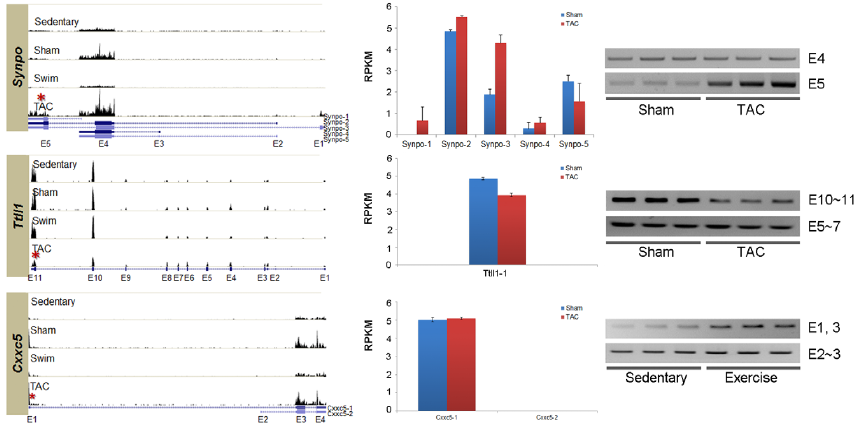
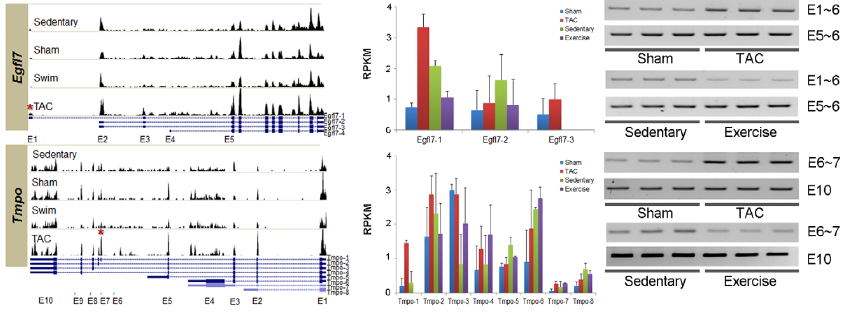
Figure 3. A) Histograms show relative gene expression levels in each test condition for 8 genes seen to experience AS in one or both hypertrophic conditions. UCSC gene structures below histograms show various isoforms, with exons as boxes. (UCSC shows only one isoform at Ttl1). Red asterisks show location of alternative splicing in the PAH condition. B) RNAseq measurements of gene expression in RPKM for each of the UCSC isoforms show different isoform distributions for different test conditions. Error bars show standard error. Isoform analysis was performed using NEUMA. C) Real-time PCR with isoform-specific prmers confirms RNAseq isoform distribution findings under the different test conditions. E.g. The TAC-specific histogram for Fhl1 is shown to contain more E4 (corresponding to isoform Fhl1-3), than other conditions; likewise RT-PCR shows that the sham only contained exons 5-6, whereas the TAC condition contained exons 4-6.
Image reprinted under a Creative Commons license from Song et al. 2012