This web page was produced as an assignment for an undergraduate course at Davidson College.
Julia Preziosi
The Origins of Europeans
1. The research project outlined in the Making of Europe unlocked by DNA article is about the identification of the genetic origins of Europeans via mutations in the mitochondrial haplogroup H, which is prevalent in modern European genomes (Rincon 2013).
2. The team was doing discovery science, with no prior hypothesis to analyze. They narrowed their genomic sequencing to samples of human remains with the haplogroup H mitochondrial DNA (mtDNA) because of their knowledge of the genetic makeup of modern Europeans, but they had no prior predictions about when or how the evolution of the population occurred.
3. The genomic technology used in this project was complete mtDNA sequencing and analysis of the mutations among the populations over time.
4. The team found that the genetic foundations for modern Europe were established in the Mid-Neolithic, and later modified by expanding cultures throughout the Late Neolithic. Their findings point to a population upheaval around 4000 BC, after which the genomic mtDNA sequences largely resemble those of modern European populations.
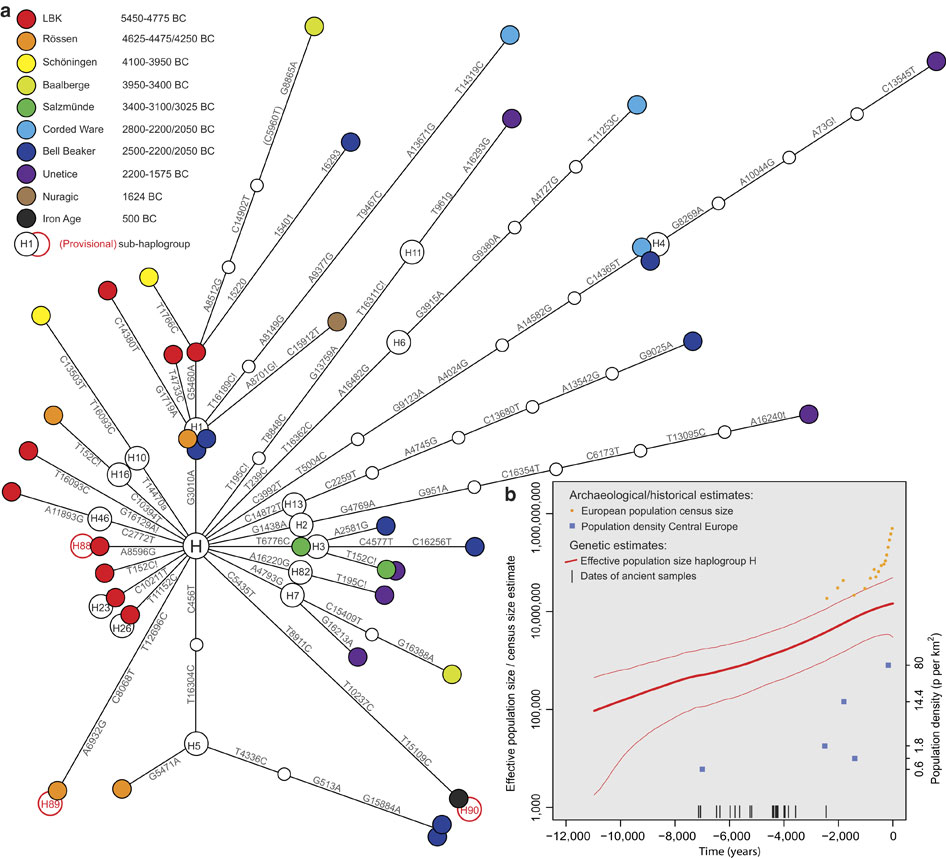
5. The project is an interesting blend of genomics and anthropology, as the team interpreted the genomic mutation trends they found using cultural histories of the migration of European populations (as the below Figure demonstrates). However, their findings also may influence anthropological studies, as the migration period they discovered had not been previously known, and will lead to investigation as to what populations the migrants came from.
Figure 1: Mitochondrial haplogroup H sequence evolution
a) Phylogenetic network of 39 prehistoric mitochondrial genomes sorted into two temporal groupings: Early Neolithic (left) and Mid-to-Late Neolithic (right). Node colours represent archaeological cultures. (b) A Bayesian skyride plot of 200 representative present-day and 39 ancient hg H mt genomes (the thick red line denotes the posterior median, thinner flanking lines denote the 95% credibility interval; note the logarithmic scale of the y axis). Prehistoric samples (18 radiocarbon and 21 mean archaeological dates) served as internal calibration points (black bars). For comparison, census size estimates for the European population are shown as orange dots. Population density estimates from the archaeological record for key periods in Central Europe are plotted as blue squares in chronological order: LBK, Iron Age, Roman period, Merovingian and Pre-industrial modern times (y axis on the right) (Brotherton et al. 2013).
References:
Brotherton P et al. 2013. Neolithic mitochondrial haplogroup H genomes and the genetic origins of Europeans. PubMed [Internet]. [cited 24 Jan 2016]; Available from: http://www.ncbi.nlm.nih.gov/pubmed/23612305
Rincon P. 2013. Making of Europe unlocked by DNA. BBC news [Internet]; [cited 24 Jan 2016]. Available from: http://www.bbc.com/news/science-environment-22252099
Email Questions or Comments: jupreziosi@davidson.edu
© Copyright 2016 Department of Biology, Davidson College, Davidson, NC 28035