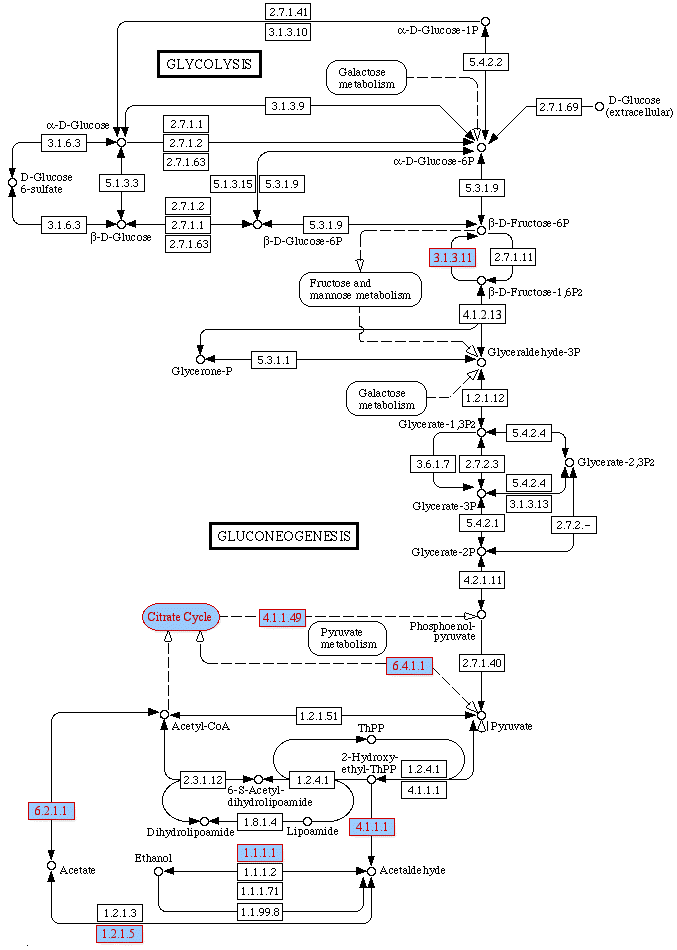
This circuit diagram illustrates many of the pathways affected as yeast consumes all of the available glucose. Enzymes have been highlighted (presented as EC numbers) if transcription of their encoding genes were substantially altered. Also highlighted is the citrate cycle which has been simplified to a single shape for clarity.
Affected enzymes include:
aldehyde dehydrogenase (Ald2; EC 1.2.1.5)
acetyl CoA synthase (Acs1; EC 6.2.1.1)
pyruvate decarboxylase (Pdc; 4.1.1.1)
pyruvate carboxylase (Pyc; EC 6.4.1.1)
phosphoenolpyruvate carboxykinase (Pck1; 4.1.1.49)
fructose 1,6-biphosphatase (Fbp1; EC 3.1.3.11)

aldehyde dehydrogenase (Ald2; EC 1.2.1.5)
acetyl CoA synthase (Acs1; EC 6.2.1.1)
pyruvate decarboxylase (Pdc; 4.1.1.1)
pyruvate carboxylase (Pyc; EC 6.4.1.1)
phosphoenolpyruvate carboxykinase (Pck1; 4.1.1.49)
fructose 1,6-biphosphatase (Fbp1; EC 3.1.3.11)
This figure was modified from the interactive KEGG circuit diagram of glucose metabolism hosted by GenomeNet at Kyoto University, Japan.
© Copyright 2002 Department of Biology, Davidson College,
Davidson, NC 28036
Send comments, questions, and suggestions to: macampbell@davidson.edu