How to deal with output from conserved/unique genome comparisons
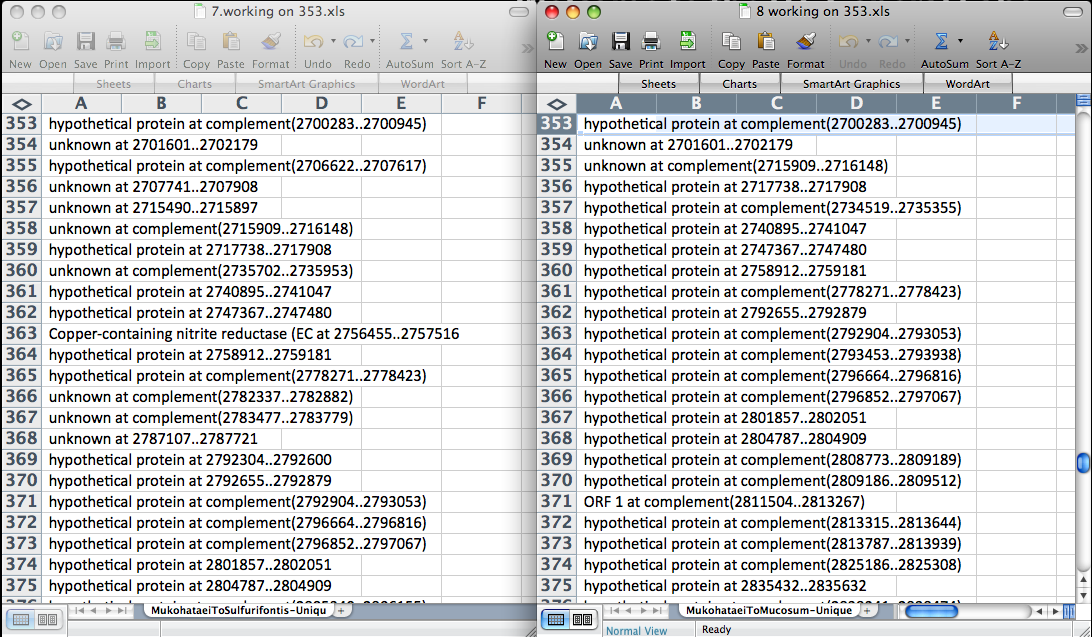
After using our Perlscript to determine conserved and unique amino acid sequences among different species, you are left with two excel files with a lot of data. For our project, we compared Halomicrobium makohataei to nine other halophiles. If comparing similar species, like our project, the conserved sequences file will have many more proteins than the unique files. In order to deal with the data we were left with after this comparison, we first decided to determine which genes were completely unique to our species. We did this by opening the excel files containing the names of the genes that were found to be unique from two separate comparisons. The output puts the genes in order based on their sequence number, so it was simple to go through both lists and delete any genes that were not contained in both files. We did this process pairwise until all nine unique lists had been evaluated. The screen shot below shows how we set up excel in order to compare these lists.
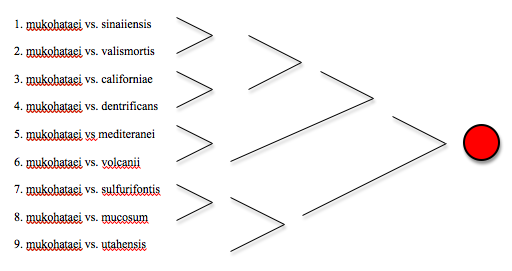
Below is how we compared all nine lists. Three of us, working together, compared each file containing unique genes pairwise until all nine lists had been compared. If a gene was not contained on both lists, it was deleted because it was not unique to mukohataei when compared to all nine species.
After completing these comparisons, we had a list of approximately 200 genes which were all either hypothetical proteins or unknown. This result makes sense because not much research has been centered on Halomicrobium mukohataei yet. The genes that make this species unique have not yet been characterized in a wet lab. Shortly after determining which genes were unique to mukohataei, we learned that there was a malfunction in the original Perlscript that determined which genes were unique and which were conserved. All comparisons had to be redone and rather than going through the labor intensive process described above again, Bill Hatfield created a program that would pull out the genes that were called unique in all nine comparisons. Also, this program was used to determine which proteins were conserved in all nine comparisons.
For the unique list of proteins, we tried to find any potential functions for these hypothetical proteins. In order to do this, we first obtained the sequence for an individual gene from RAST. To find the sequence, begin by browsing the genome using the SEED viewer. Hover over the 'Organism' tab and then click on 'Genome Browser.' Paste the number corresponding to the position of the start codon (will be contained in the name of the gene in the list) into the box labeled 'start base.' After entering the start codon, you must toggle the left and right arrows to force the genome browser to go to the location of interest in the genome. First, click on the arrow pointing right, next point on the arrow pointing left.
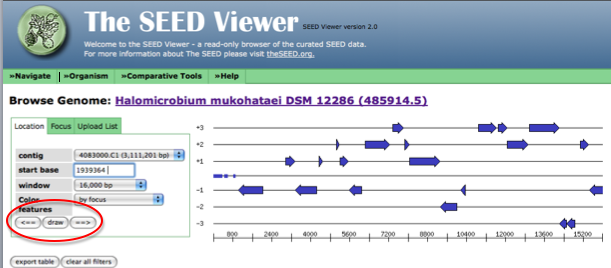
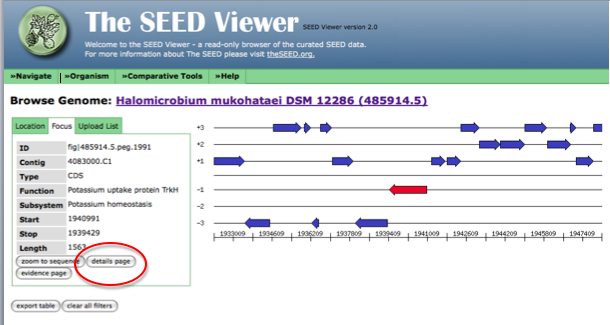
Now, the arrow in the genome diagram closest to the left of the page will represent the gene from the list that we are trying to find. Click on this arrow (it will turn red) and information about this gene, including a link to the gene details page (circled in red) will appear to the left of the diagram.
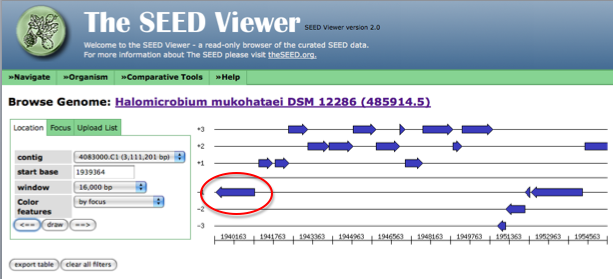
The following figure shows how the page looks after clicking on the arrow representing your gene of interest. Follow the link to the details page for more information on this gene.
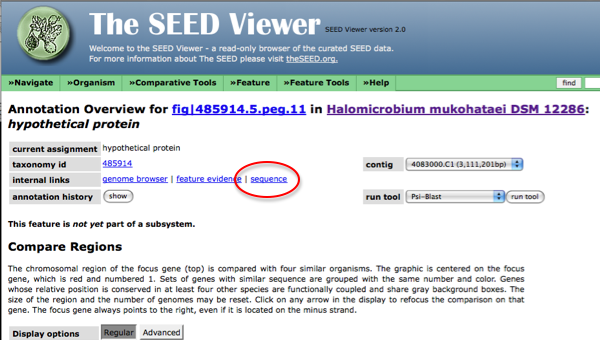
Once in the details page, follow the link to the sequence and copy this text.
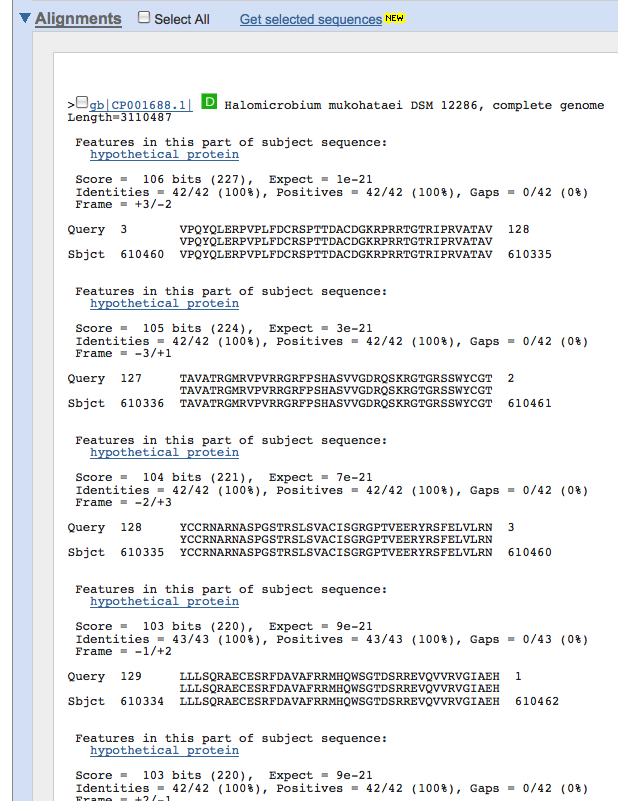
Next, you can tblastx this sequence to find any similarities to other genomes of other species that have been annotated. Tblastx will compare a translated version of the amino acid sequence given with amino acid sequences in other species. Because of the wobble effect in translation, we expect to see more conservation among amino acid sequences than nucleotide sequences. Since these are difficult genes to find, we want to do a search that will give us the most results to choose from making tblastx ideal. After obtaining results from this search, look for any matches that have good e values (<.001) that include names to proteins other than hypothetical or unknown. Results pages from tblastx will look like the screen shot below. Be sure to scroll down to the detailed portion of the results page that will show the names of the genes that share regions of similarity.
Because of inconsistencies in names of genes, Bill's program used the start and stop codon locations to determine if these genes were present in all nine lists of either conserved or unique proteins. The use of start and stop codons in this manner meant that the resulting list was in order of location in the genome. For the conserved gene list, this order made the list difficult to work with. In order to fix this problem, we dumped the list into an alphabetizing site. When you click on the link, scroll down until you see the part of the page that corresponds to the following screen shot:
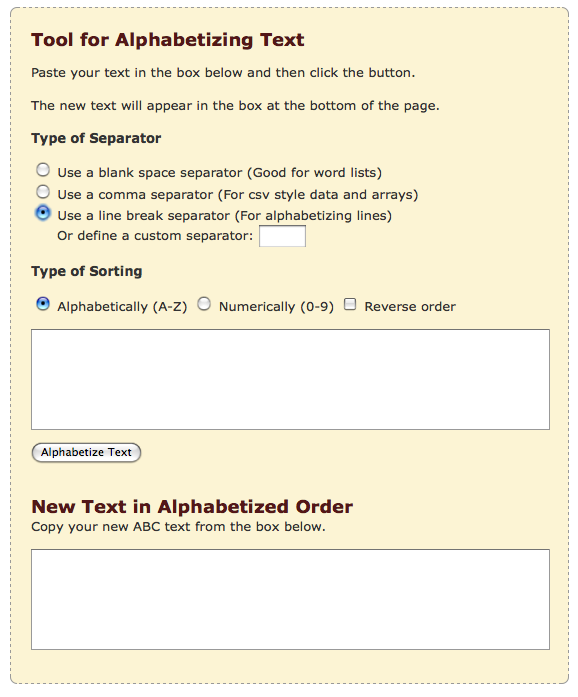
Make sure to change the 'type of separator' option to 'Use a line break...' before getting started. Next, simply paste the list of genes that resulted from Bill's program into the top field. Press the Alphabetize text button, and a sorted list will appear in the bottom box. One problem that we ran into with this method is that some gene names were contained within quotation marks. These genes were sent to the bottom of the list once alphabetized. Make sure to remove quotation marks from gene names prior to alphabetizing and always check the output of this site for mistakes! Generally, most problem names will appear at the bottom of the list.
After alphabetizing the list, we decided to look at specific KEGG pathways. We decided that the best way to determine which genes were conserved in these pathways or missing from our genome would be to work backwards. We started by each choosing a pathway of interest. For instance, I chose the TCA (citrate) cycle. The best way to choose a pathway is to go through RAST. Once in the SEED viewer, hover over 'comparison tools' and click on 'KEGG metabolic analysis.' Once here, you can click on any parts of the map to find a pathway of interest. After choosing a pathway, the screen should look like this:
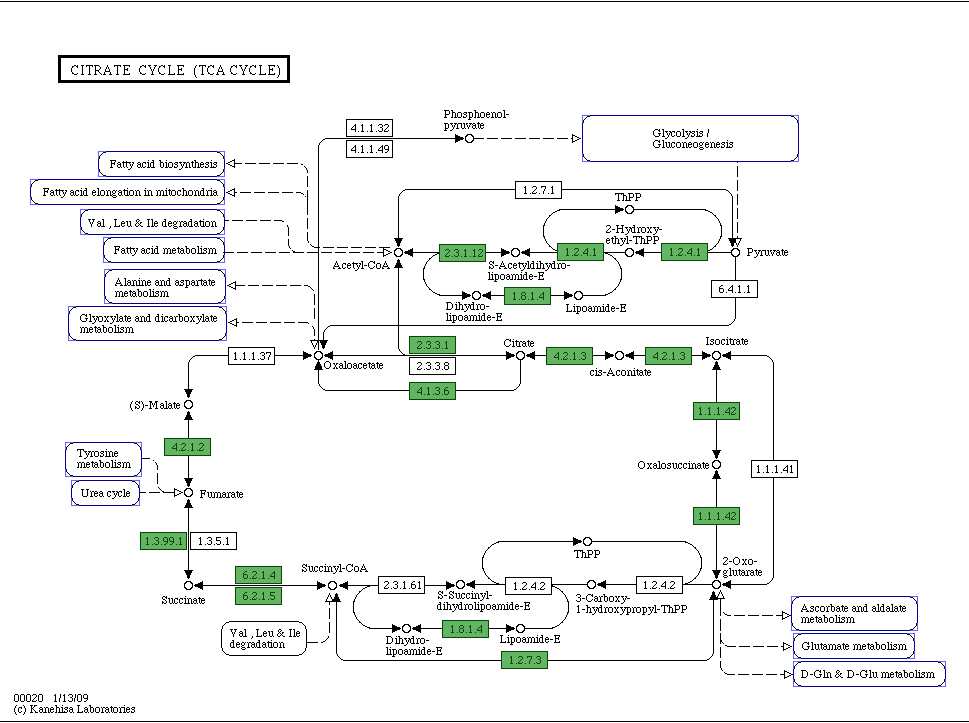
Green boxes containing EC numbers are genes in your species that RAST has found. White boxes signify genes that appear to be missing from your genome. To begin this comparison, I took the alphabetized list of conserved genes and tried to find the green genes that RAST has discovered in our species. I did this by clicking on the green boxes to determine the name of these genes and simply did a 'find' search in microsoft word with the list of conserved genes. Because it is possible that these genes are named slightly differently in our list than in RAST, it is important to try searching for only parts of the gene name as well. For instance, you can try searching for only the EC number or only the first portion of the name of the gene. If you find a similarly named gene, you can check to see if it is identical by comparing the start and stop codon called on RAST with the start and stop codons mentioned in the name of the gene from the list. I kept track of which genes were found in all ten species and which were not. If the gene was not found in all ten, I attempted to figure out which species did not have this gene by doing a 'find' comparison with individual lists of conserved genes. For example, the gene with EC 1.3.99.1 was not present in all ten species, so I opened each conserved list of proteins from the initial pairwise comparisons. Next, I did a search in each of these lists using the find function in excel to determine if this gene was present on the list. If the gene was present, I marked off this species and continued looking in the other lists. In this way, I was able to determine which species had the components for the citrate cycle and which did not. In order to organize this search, I used excel. Below is a spread sheet showing how I organized this data:
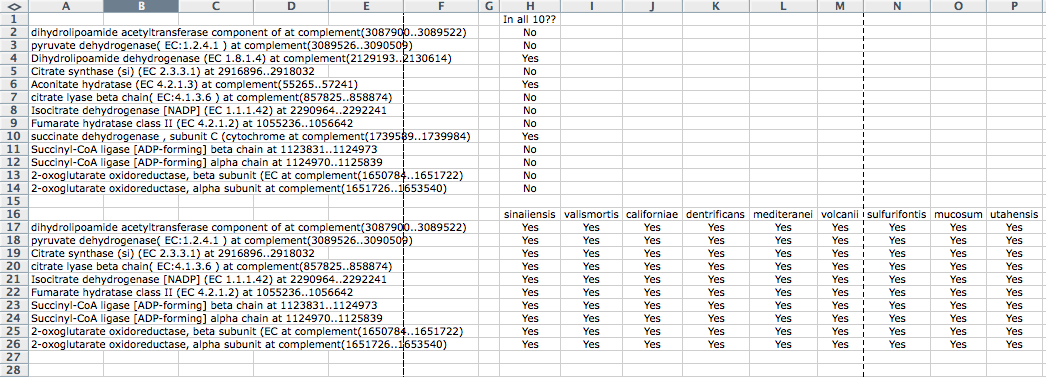
After doing this detailed search for these genes, I realized that something was clearly wrong with the program designed to find the conserved proteins. All of these proteins were conserved in all ten species yet they did not appear on the conserved list. To ensure that this mistake was not made when manipulating the conserved list, I returned to the original output list, but still found these nine genes missing from the list. Bill went back through the program and fixed the error. We then rechecked the list using a spot check like the one shown above and the error seemed to be corrected. Because of errors such as these, it is important to do a spot check like the one shown above when you first receive the list of conserved and unique proteins. By doing this thorough proofing of your results, you will not have to redo work when errors such as the one we encounter crop up.
After this step in the process, I decided to attempt to fill in the missing gaps in this pathway for our species. To do this, I followed the steps outlined in a previous tutorial by Megan Reilly which can be found by clicking here. After arriving at this website, click on the link titled 'Media:KEGG_pathway_tutorial.doc' under the section header called 'Tutorials for annotating genomes.'
This website was created by Karen Hasty as part of the Laboratory Methods in Genomics course at Davidson College, Fall 2009.