This web page was produced as an assignment
for an undergraduate course at Davidson College.
MacDNAsis Analysis of Troponin C
by Aaron N. Rice
Open Reading Frame (ORF) Search
MacDNAsis was used to analyze the cDNA sequence of Troponin
C (TnC) from the chicken, Gallus gallus. Using this sequence
analysis, the computer program was able to predict the open reading
frame for the sequence (Fig. 1).
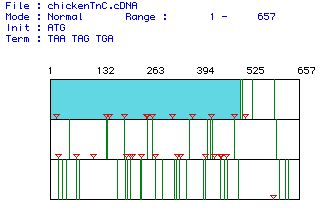 |
| Figure 1. A sequence analysis of Gallus
gallus cDNA for TnC. Red triangles mark start codons in the
sequence, green lines indicate stop codons, and the white portions
are open reading frames. The largest open reading frame (bases
1-504) is indicated in blue. |
This translated open reading frame produces a protein of 168
amino acids with a molecular weight of 18936.20 daltons.
Hydrophobicity
Kyte-Doolittle Analysis
The Kyte-Doolittle analysis is able to analyze the hydrophobicity
or hydrophilicity of a protein given amino acid (AA) sequence,
and predict whether that protein is a trans-membrane protein.
A threshold hydrophobicity value of 1.8 is suggestive of a transmembrane
protein.
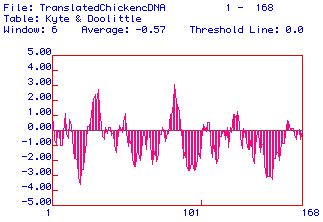 |
| Figure 2. A Kyte and Doolittle Hydropathy
analysis showing the hydrophobic (positive values) and hydrophilic
(negative values) regions of the168 AA protein from the ORF of
Gallus gallus TnC. There are two strongly hydrophobic
regions along TnC which suggest a possible trans-membrane domain.
|
The Kyte-Doolittle analysis shos that there are two domains
within the protein that have a hyrdophobicity of >1.8. However,
since TnC is part of the troponin
complex within the cell and binds to Troponin I and Myosin,
TnC is probably not a transmembrane protein.
Hopp and Woods Analysis
The Hopp and Woods analysis is another computer-based protein
analysis which looks at hydrophobicity and hydrophilicity. Unlike
Kyte-Doolittle, Hopp and Woods can be used to determine the antigenicity
of a protein: to what portion of the protein an antibody will
bind (the epitope). Usually, the most hydrophobic regions (positive
values) serve as the best epitopes.
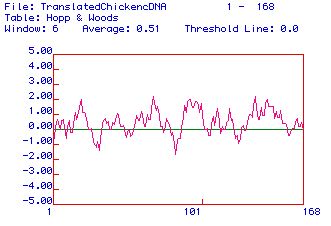 |
| Figure 3. A Hopp and Woods hydrophobicity
test also showing hydophilic (positive values) and hydrophobic
(negative values) regions of the 168 AA protein. The most hydrophilic
peaks can be used as possible domains for determining an antigen. |
In TnC, there are five domains of a hydrophobicity of >2,
which would probably make good epitope sites for and antibody.
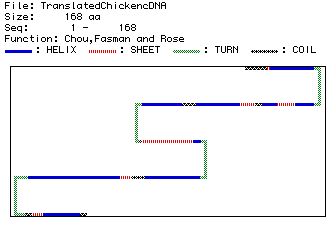
Secondary Structure of TnC
Knowing the primary structure of a protein allows computer
programs to predict the probably secondary structure of the protein,
taking into account the different properties of the individual
AAs or domains along the sequence. The secondary structrue consists
of a combination of sheets, helices, turns, and coils. The secondary
structure of TnC (seen in Fig. 4a and 4b) were predicted using
the Chou, Fasman and Rose analysis.
(a)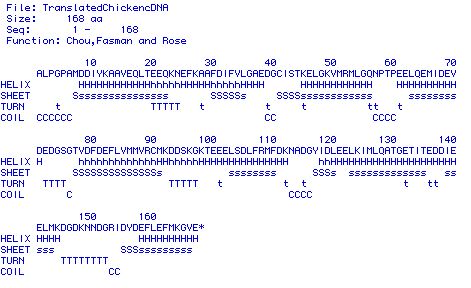 |
|
(b)
|
| Figure 4. Predicted secondary structures
of the 168 AA protein. Figure 4a shows the AA letter code and
what folding corresponds to each AA in the protein (assuming
it is involved in folding). Figure 4b shows a more general picture
of the predicted secondary folding of TnC. |
Figure 4a and 4b show that the secondary structure of TnC is
comprised of nine helices, six sheets, four turns, and six coils.
Multisequence Analysis
MacDNAsis is also able to simultaneously compare the protein
sequences of several different proteins. Figure 5 shows a Waterman
protein sequence comparison of TnC between Caenorhabiditis
elegans, Drosophila silvestris, Gallus gallus (cardiac
TnC), Xenopus laevis (cardiac and skeletal TnC), and Homo
sapiens (cardiac and skeletal).
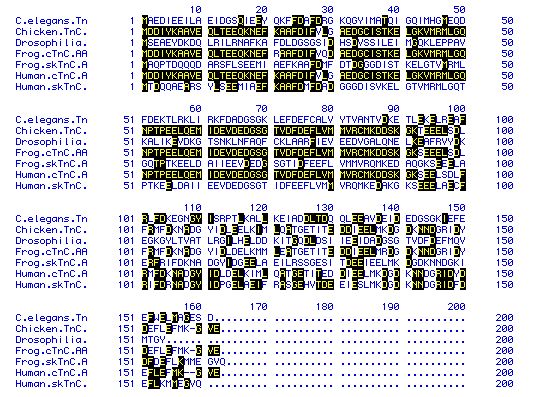 |
| Figure 5. An amino acid sequence alignment
using a Waterman analysis (MacDNAsis). While there is variation
between the different sequences, the chicken (Gallus gallus),
frog (Xenopus laevis), and human (Homo sapiens)
all have similar sequences for their cardiac TnCs. |
The cardiac TnC sequences between G. gallus, H. sapiens,
and X. laevis appear to be largely similar, with a few
individual differences. The other sequences show quite a bit of
variation between them.
Phylogeny
A Higgins analysis sequence comparison allows one to predict
the relative relatedness between two proteins, giving an idea
of how far apart evolutionarily they are separated.
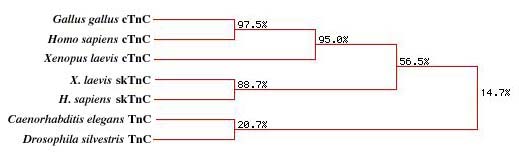 |
| Figure 6. A phylogeny of Troponin C (TnC)
created using a Higgins multisequence analysis (MacDNAsis). The
diagram shows that there is a high level of homology between
the Homo sapiens, Gallus gallus, and the Xenopus
laevis cardiac TnC (cTnC). The skeletal muscle TnC (skTnC)
shows a lower homology, while the invertebrate TnC shows little
homology to the other protein sequences. |
Given the sequence similarities seen in Figure 5, it is not
suprising that there is a strong correlation between G. gallus,
H. sapiens, and X. laevis cardiac TnCs. The X.
laevis and H. sapiens skTnC show a lower degree of
relatedness to the cTnCs (but relatively high to eachother), and
the C. elegans and D. silvestris show a very low
degree of relatedness.
Back to the Davidson College Molecular
Biology Page
Back to Aaron Rice's Main
Page
©2000 Department of Biology, Davidson College, Davidson,
NC 28036
Comments? Questions? email: aarice@davidson.edu