Here is the complete figure:
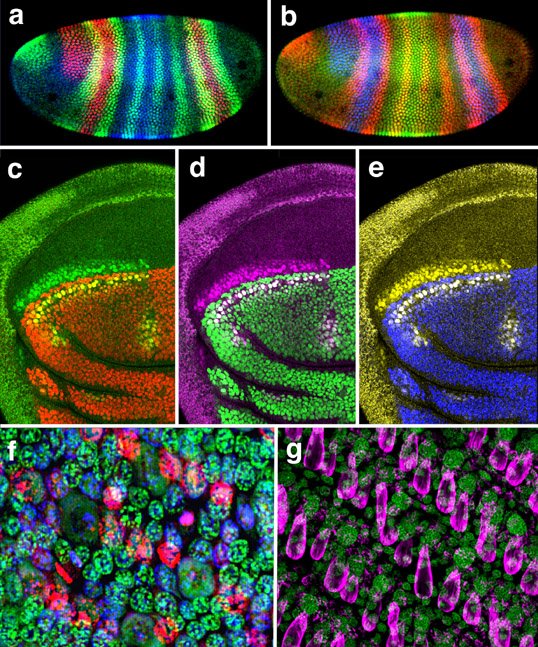
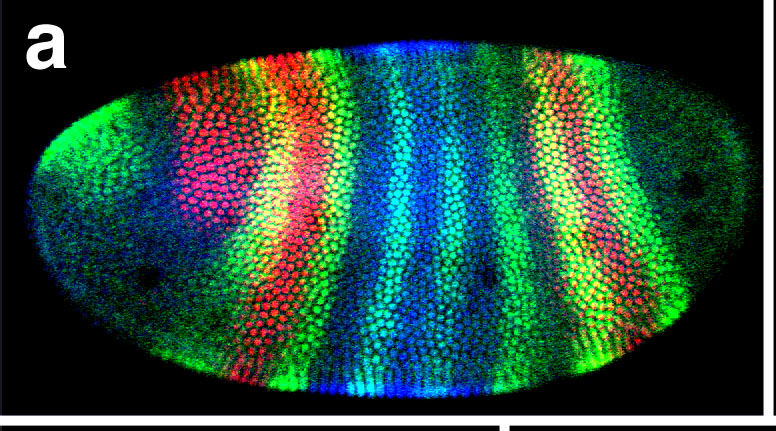
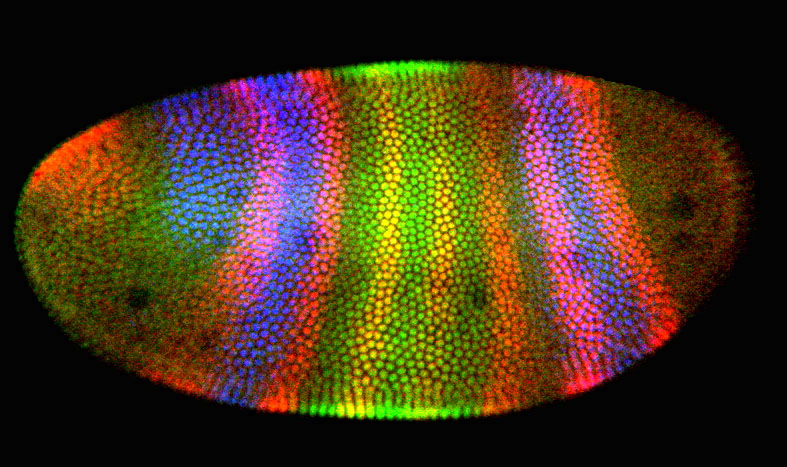
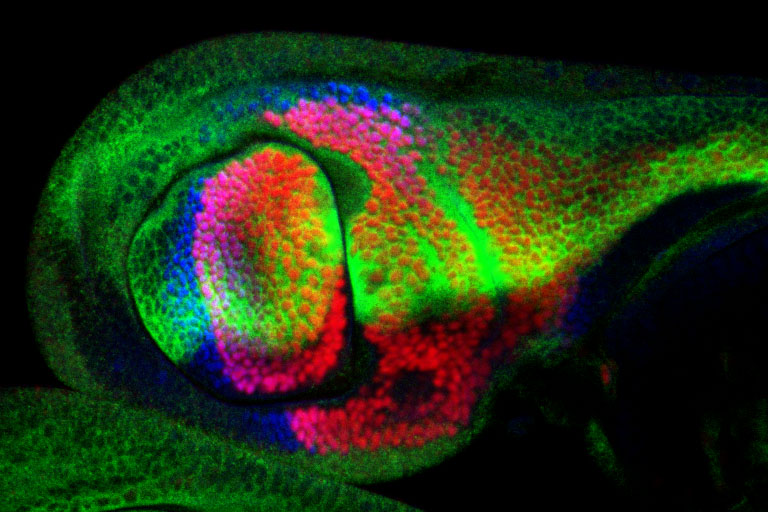
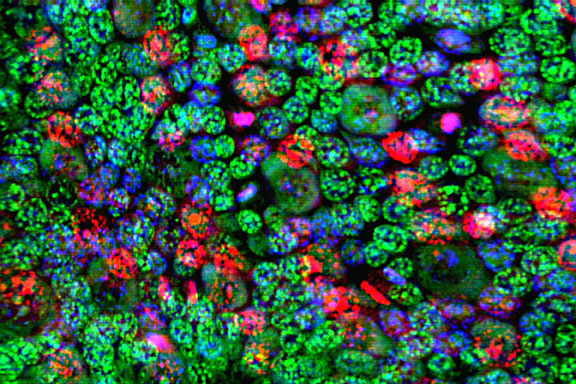
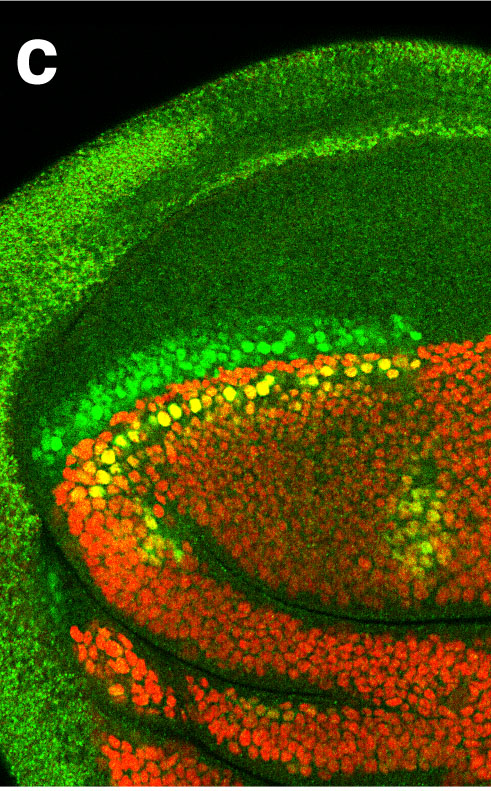
Figure 1. Applications of three-color imaging. Panels a and b: three images are collected at three different excitation and emission wavelengths and subsequently merged and displayed as a single three-color merged image using Photoshop. The image is a Drosophila embryo at the cellular blastoderm stage triple-labeled for three segmentation proteins: hairy in green (a) or red (b), Kruppel in blue (a) or green (b) and giant in red (a) or blue (b). Panels c, d and e: two images collected at different excitation and emission wavelengths are merged and displayed using Photoshop. Different color combinations are demonstrated in a Drosophila third instar wing imaginal disk double-labeled for apterous in red (c), green (d) or blue (e), and achaete in green (c), purple (d) or yellow (e). Note the nuclei that coexpress apterous and achaete are colored yellow in (c) and white in (d) and (e). Panel f: three images from a Z-series projection are merged and colorized so that color is now coded to depth in the specimen. Epithelial nuclei are shown in green with the nuclei of the scale- forming cells shown in blue and red (at different levels in the epithelium). The specimen is a whole mount butterfly pupal wing epithelium stained with propidium iodide. Panel g: different structures are mapped to depth in a double-label image in a whole mount of a butterfly wing epithelium at a slightly later stage of development than Panel f Here nuclei are labeled with TOTO-3, and the emerging wing scales at a more dorsal position in the epithelium to the nuclei are labeled with Texas Red® phalloidin.
Close up versions:
Return to Molecular Biology Main Page
![]()
![]()
© Copyright 2002 Department of Biology, Davidson
College, Davidson, NC 28036
Send comments, questions, and suggestions to: macampbell@davidson.edu