My Favorite Yeast Expression:
SPR3 and YGR058W
In a previous assignment I used online genomic databases to determine the function of two Saccharomyces cerevisiae genes, SPR3(YGR059W) and YGR058W. Both genes are located on chromosome VII. SPR3 encodes a septin protein, a structural protein within the cytoskeleton associated with cell growth specifically during the organization of cells during cytokinisis. The yeast gene YGR058W is a non-annotated ORF, thus little evidence has been found to determine the function of its protein product, though it is thought to be found in both the nucleus and the cytoplasm of cells. Using many databases and YGR058W's sequence, I hypothesized its function as being able to bind to calcium ions and being involved in programmed cell death(apoptosis).
To view my web page that further describes both genes and attempts to characterize the non-annotated gene, go to SPR3 and YGR058W.
_______________________________________________________________________________________________
DNA Microarrays and Genomic "Guilt by Association"
In this web page I will attempt to characterize the expression patterns of SPR3 and YGR058W using online genomic databases, and use the expression patterns to determine the possible cellular role of the YGR058W gene. The major source of data used in these databases will be DNA microarrays, also known as DNA chips. DNA microarrays or chips are glass slides with many indented wells (spots) that contain sequences of genes that look like spots. The genes from your organism of interest are amplified by PCR and each amplified gene is inserted into the spot of the slide, so that each spot contains a different gene. Next, mRNA is extracted from the organism of intererest under two different conditions (i.e. yeast cells grown in the presence and absence of oxygen). cDNA is then made from this mRNA, and the cDNA for each condition is dyed a different color, either red or green, say green for cDNA obtained in the presence of oxygen and red for cDNA in the absence of oxygen. The cDNAs are then incubated on the DNA microarray so that complimentary strands of DNA(genomic DNA and cDNA) can bond together, and then the excess is washed off. A scanner is then used to detect which genes the cDNA has bound to. A red or green signal then indicates during which environmental condition each gene either transcribes or does not. The data is converted into a color scale in which red corresponds to gene induction (an increase in transciption for that gene in this experimental condition relative to the control condition),green corresponds to gene repression (a decrease in transcription for that gene in this experimental condition relative to the control condition), and black represents no change in gene expression between each of the experimental and control conditions (Campbell and Heyer, 2003). Go here to view an animation of how a DNA microarray works.
DNA Microarrays allow the experimenters to detect the expression levels of many different genes under different conditions. Because genes must be transcribed to allow each gene's protein product to carry out its function, and thus changes in transcription patterns infer an increase or decrease in the involvement of each gene's protein within the organism under the tested condition, there is a often a correlation between similarity in function and similarity in expression patterns in certain conditions, a kind of genomic "guilt by association". The function of an unknown gene can, thus, be hypothesized by comparing the genewith other genes with similar expression levels. (Campbell and Heyer, 2003)
To view these genes' expression under different experimental conditions I used the Expresssion Connection database. Note the color scale below which was used for all DNA microarray data below.
![]()
Figure 1. Color scale for expression levels of a gene using DNA microarrays. The brighter the green color indicates the greater level of gene repression and the brighter the red color indicates the greater level of gene induction. Black indicates no change in the experimental expression levels of the gene when compared to the control (Image from Expression Connection; SGD, 2004.)
__________________________________________________________________________________________________________________________
SPR3
I will use data from different experiments involving the use of DNA microarrays to analyze the expression patterns of SPR3. To do this I searched Expression Connection web site to view these different expression patterns.
Expression during sporulation (Chu S., 1998). Click here to view the abstract of this paper.
This experiment involved the expression of yeast's genes during sporulation, a process by which yeast produce haploid cells are produced by diploid cells of budding yeast and which involves meiosis and spore morphogenesis. I expected SPR3 to be induced during sporulation since its septin protein product is thought to be involved in the creation of spore walls during the sporulation process. As you can see in Figure 2, SPR3 is, in fact, induced for the majority of time during which sporulation takes place. Figure 3 shows these similar genes with similar expression patterns during sporulation. Known(annotated) gene's with similar but often slightly different functions are seen having similar expression patterns as SPR3. Note the functions involving the cell wall, being a prospore membrane, and being involved in meiosis(all functions associated with SPR3) is found for several known genes with some of the most similar expression patterns, SPS2, DON1, SSP1, and NDT80. This data upholds the guilt by association method of prescribing gene's functions because the data seemingly upholds SPR3's known function because of these similarity in expression with genes with similar functions.

Figure 2. Expression of SPR3 during sporulation. SPR3 is induced from 2 hours on, though its rate of transcription seemingly peaks after 7 hours. (Image from Expression Connection; SGD, 2004. Click here to view image.)
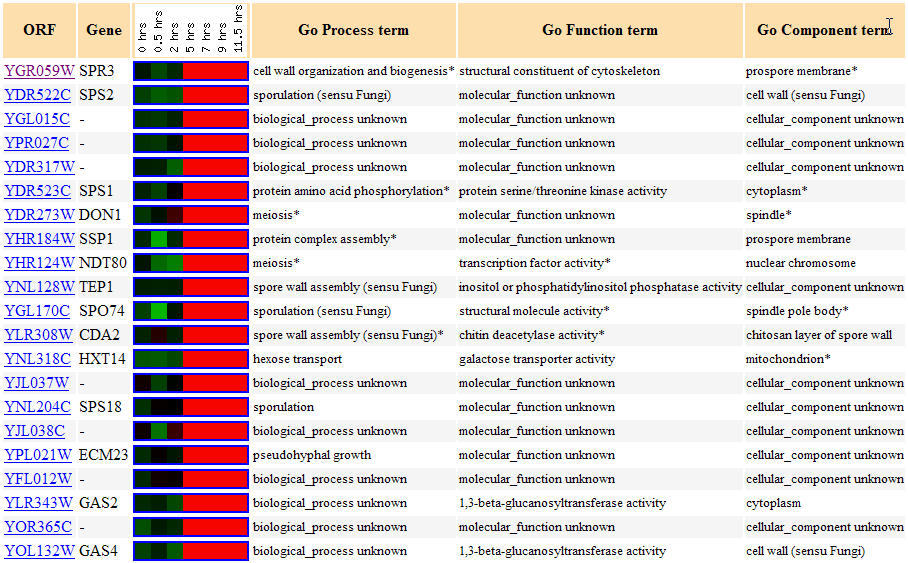
Figure 3. Yeast genes with similar expression patterns to SPR3 during sporulation. (Image from Expression Connection; SGD, 2004. Click here to view image.)
Expression during the cell cycle ( Spellman P.T. et al., 1998). Click here to view the full text version of this paper.
This experiment involved the use of three interruptions in the cell cycle to display the difference in expression depending on the stage of the cell cycle. The data below indicate that SPR3's level of transcription varied from repression to induction throughout the timespan. The below data in Figure 4 is a good example of how the guilt by association method can be used to predict a gene's molecular functions. Notice there is only one other gene with a similar expression pattern, with a Pearson correlation of > 0.8, to SPR3. Interestingly enough this is a non-annotated gene. Although this data does not confirm SPR3's known functions, it does allow one to predict that the biological process, molecular function, and cellular component of YGR039W is similar or the same as SPR3's.
 Figure 4. Yeast genes with similar expression patterns to SPR3 during the cell cycle. (Image from Expression Connection; SGD, 2004. Click here to view image.)
Expression during the diauxic shift (DeRisi, J.L., 1997). Click here to view the abstract for this paper.
Yeast cells undergo the diauxic shift when they change from using anaerobic fermentation to using aerobic respiration to create cellular energy (DeRisi et al., 1997). The expression graph for SPR3 during a diauxic shift is fairly interesting as seen in Figure 5. SPR3 is repressed for the first 17 hours of the shift to the use of fermentation, but it then is induced for the remaining four hours. As for the gene's found with similar expression patterns, Figure 6 shows that annotated genes with similar expression patterns during the diauxic shift are found to widely vary in function, though TID3 is seen to also be a structural component of the cytoskeleton and two other genes are involved in meiotic recombination, REC107 and RAD24, functions which are in accord with SPR3's known function. These genes with similar expression levels that are clustered with SPR3 all show repression until hour 18.5 when some induction takes place. I take these results to act as a reminder that the guilt by association method of determing function is not a guarantee.
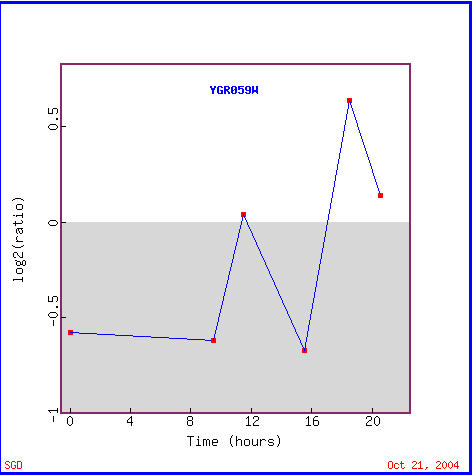
Figure 5. SPR3 is initially repressed, but eventually induced during the diauxic shift. Notice that SPR3 is variably repressed for the first 17 hours, but is then induced for the remaining four hours.(Image from Expression Connection; SGD, 2004. Click here to view the image.)
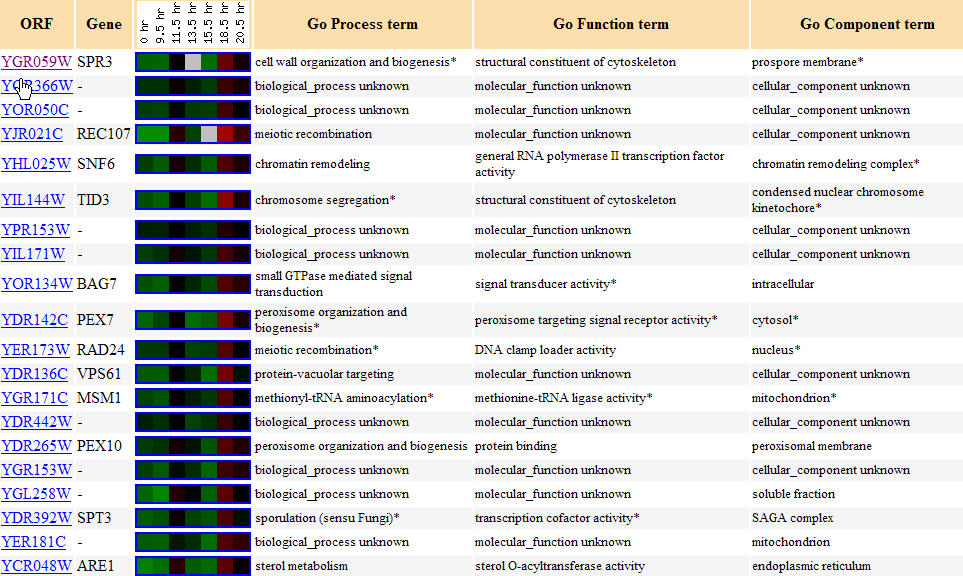 Figure 6. Yeast genes with similar expression patterns to SPR3 during the diauxic shift. (Image from Expression Connection; SGD, 2004. Click here to view the image.)
Expression in response to histone depletion (Wyrick, J.J., 1999) Click here to view the publication.
This experiment determined the transcription patterns of yeast genes after the histone protein H4 was depleted, from their genetic material. The expression graph, Figure 7 shows that SPR3 was almost immediately induced in cells lacking histone, though some repression is seen for the first half hour. Other genes that similary were repressed for the first half hour and then induced for the remaining five and a half can be seen in Figure 8. Note the similar biological process of the similarly expressed INP52, cell wall organization and biogenesis. Again many of the genes with similar expression patterns have markedly different functions within the yeast.
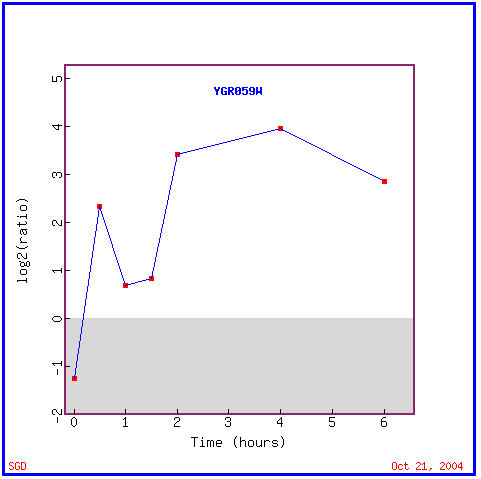
Figure 7. Expression levels of SPR3 after histone depletion. (Image from Expression Connection; SGD, 2004. Click here to view image.)
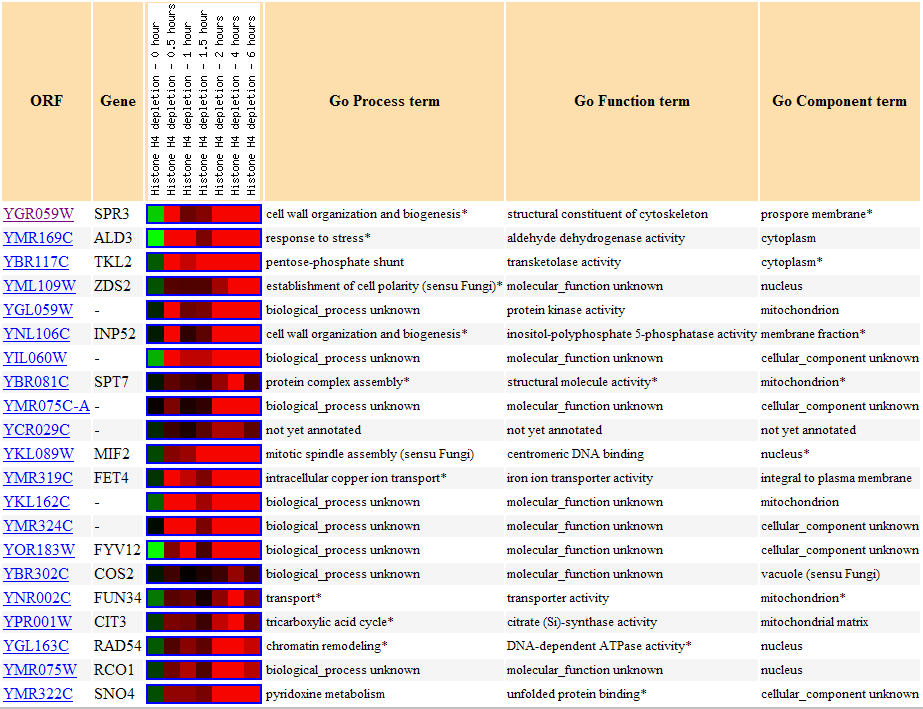 Figure 8. Yeast genes with similar expression patterns to SPR3 in response to histone depletion. (Image from Expression Connection; SGD, 2004. Click here to view the image.)
Figure 9, below, shows other genes SPR3 is known to interact with. SPR28 is another septin-related protein known to be expressed during sporulation and located within the cell wall, and CD11 is a component of the septin ring that is involved in bud growth that is required during cytokinesis. Thus, these genes with which SPR3 interacts are seen to have similar functions as SPR3 which provide another source of evidence confirming SPR3's functions.
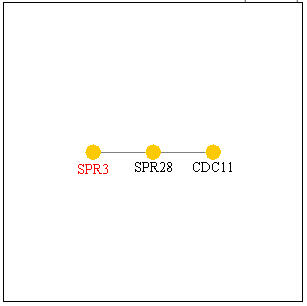
Figure 9. Genes with which SPR3 interacts. Image from Function Junction .
The above data, mostly coming from DNA microarray experiments, allowed me to find genes with similar expression patterns and related functions as SPR3 under different experimental conditions. Additionally, there was also a large amount of data that indicated genes having similar expression patterns as SPR3, but many of these genes had seemingly unrelated functions, thus, this seems to act as a reminder that using "guilt by association" to determine a gene's function is by no means guaranteed to be correct.
__________________________________________________________________________________________________________________________
YGR058W
Now I will look at DNA microarray data to obtain the expression patterns of the non-annotated gene YGR058W, and will attempt to further characterize its cellular role. I will then use the aforementioned genomic "guilt by association to predict cellular roles for YGR058W, though this will just be a prediction and much more experimental evidence will be needed to determine its function. Remember in a previous assignment that I found the non-annotated YGR058W ORF to be found in both the cytoplasm and nucleus, and predicted that its cellular function was as being involved with calcium ions in some way, and that it was involved in the biological process of apoptosis.
Expression during sporulation (Chu S., 1998). Click here to view the abstract.
Again, sporulation involves the creation of haploid cells within yeast. Figure 10 shows YGR058W is induced after 3 hours of sporulation in, and for the rest of the experiment. The majority of the similarly expressed genes in Figure 11 are annotated, which is helpful for determining a function, however many of these functions are vastly different. These functions include transcription factor activity, involvement in mitosis, DNA repair activity, kinase activity, and iron ion transport; location within both the cytoplasm and nucleus, and more specifically within the endoplasmic reticulum and mitochondria in some cases. There is no obvious trend in the function of these genes with similar expression patterns as YGR058W during sporulation. Because of this I am not going to try to assign a function to this ORF yet, I am going to use this data in correlation with DNA chip data from other experiments to see if any similarities in genetic functions arise in those data as in microarray data.
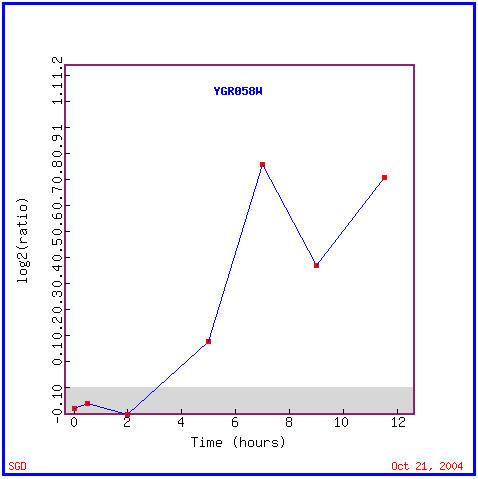
Figure 10. YGR058W is induced during sporulation. (Image from Expression Connection, SGD, 2004. Click here to view image.)
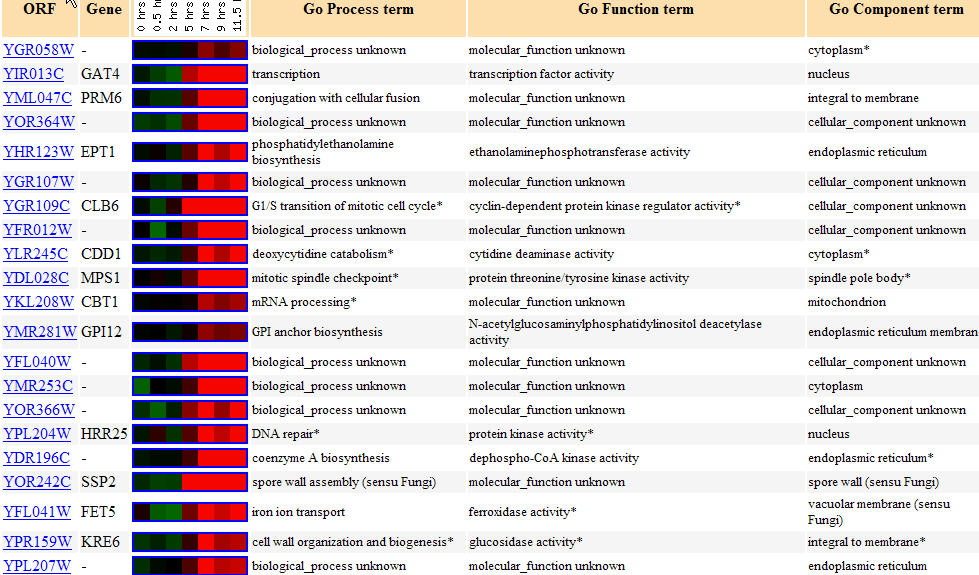
Figure 11. Genes with similar expression levels to YGR058W during sporulation. (Image from Expression Connection; SGD, 2004. Click here to view image.)
Expression during the diauxic shift (DeRisi, J.L., 1997). Click here to view the abstract for the publication.
As you can see in Figure 12, YGR058W is repressed during the entire time of the diauxic shift. Remember that the diauxic shift involves the transition of yeast cells from using anaerobic fermentation to using aerobic respiration to create cellular energy. This seems to imply that this ORF's product is not involved in respiration in any manner. Genes with similar expression patterns to YGR058W, as seen in Figure 13, have varied functions including involvement in transcription, translation, meiosis, cation transport, and two which are again involved in iron ion transport; cellular locations of these similarly expressed genes include the nucleus, cytoplasm, and plasma membrane.
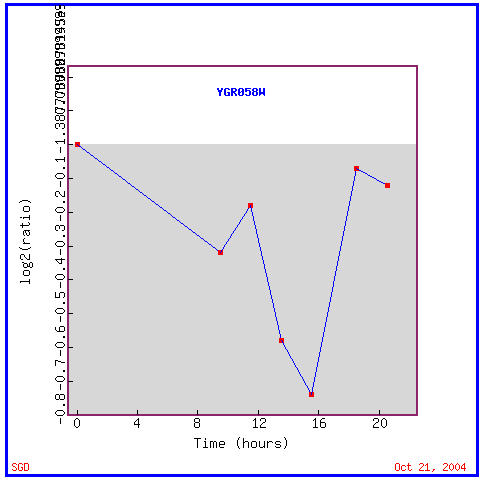
Figure 12. YGR058W is repressed during the diauxic shift. (Image from Expression Connection; SGD, 2004. Click here to view image.)
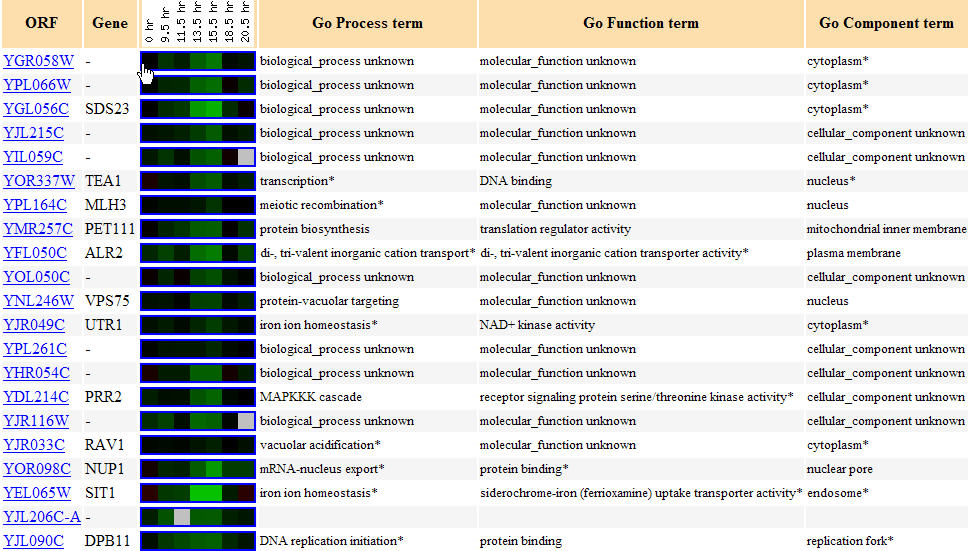
Figure 13. Similarly expressed genes to YRG058W during the diauxic shift. (Image from Expression Connection; SGD, 2004. Click here to view image.)
Expression in response to histone depletion (Wyrick, J.J., 1999) Click here to view the article.
YGR058W's expression graph (Figure 14) shows that it was repressed for the first 45 minutes of histone depletion, then was induced for a half hour, again repressed for another half hour, then induced for nearly 3.5 hours, and finally repressed for the final half hour. Annotated genes with similar expression patterns (Figure 15) include genes with varied functions including involvement in DNA replication, translation, protein catabolism, GTPase activity, and amino acid phosphatase dephosphorylation; locations of these genes' products include predominantly the cytoplasm and more specifically the endoplasmic reticulum in some cases. One of the gene's functions of being involved in aerobic respiration immediately reminds me that the "guilt by association" is not always accurate. As I stated in the above experiment involving the diauxic shift, that YGR058W could not be involved in aerobic respiration because it is repressed during the diauxic shift.
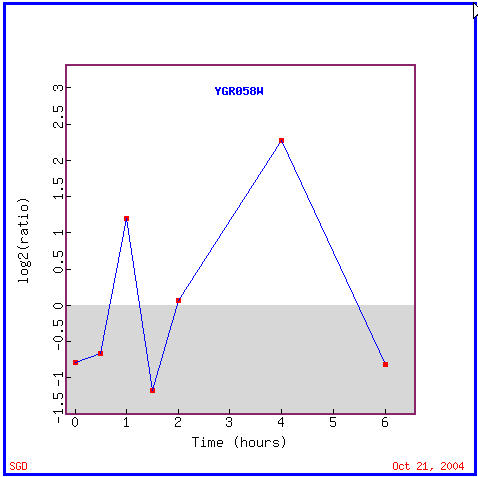
Figure 14. YGR058W expression in response to histone depletion. (Image from Expression Connection; SGD, 2004. Click here to see image.)
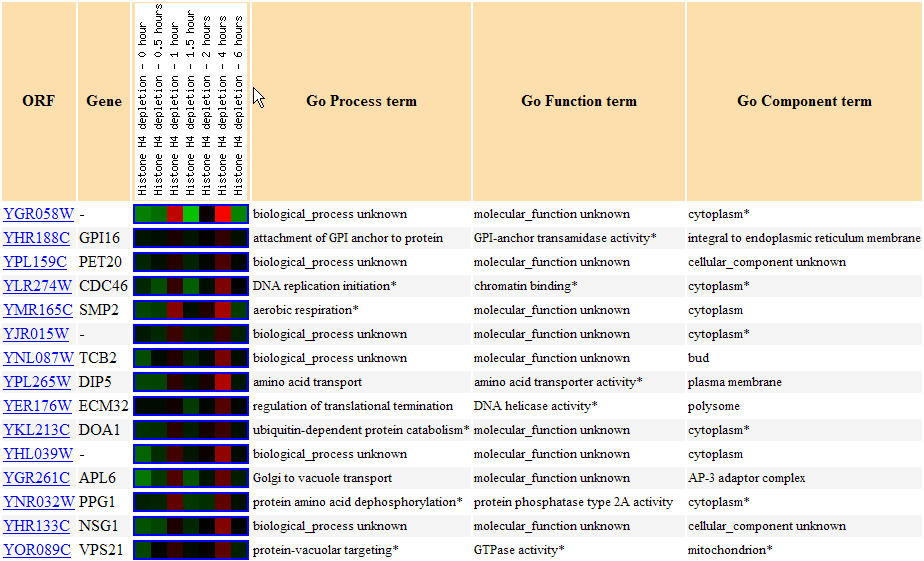
Figure 15. Yeast genes with similar expression patterns to YGR058W in response to histone depletion. (Image from Expression Connection; SGD, 2004. Click here to see image.)
Expression in response to varying zinc levels (Lyons T.J., 2000). Click here to view the full-text article.
No expression graph could be created for this experiment, but note below in Figure 15 that YGR058W and similarly expressed genes were found to be induced for seemingly the entire experiment. Functions related to similarly expressed annotated genes include protein modification(several types of kinase activity), cellular wall organization and biogenesis, and several involvements with ions including both calcium ions in one case and iron ions in two other cases; these genes are again confirmed to be found both in the cytoplasm and the nucleus. These results are interesting because iron ion activity is found in similarly expressed genes for the third time(also evident during sporulation conditions and the diauxic shift).
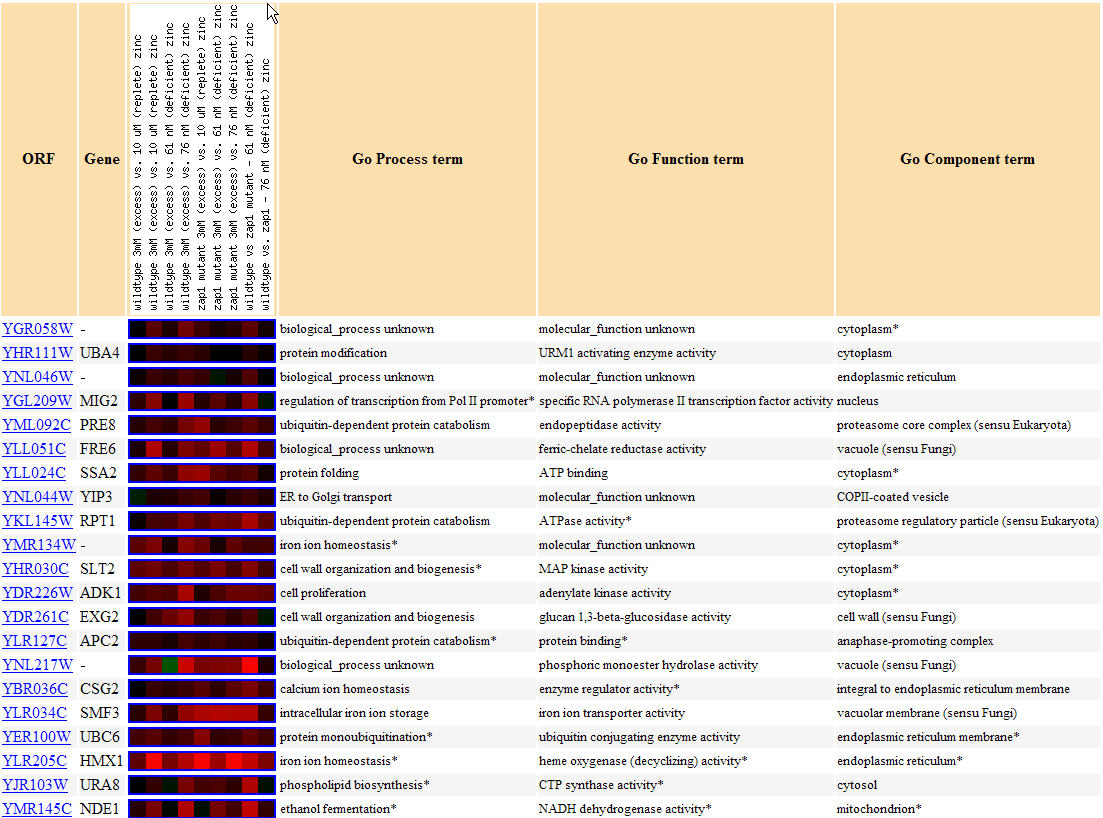
Figure 15. Yeast genes with similar expression patterns to YGR058W in response to varying zinc levels.(Image from Expression Connection; SGD, 2004. Click here to see image.)
The following chart, Figure 16, shows other genes that are predicted to interact with YGR058. Most of the genes are non-annotated, but four are annotated. HOG1 is a gene with a protein product that has mitogen-activated protein kinase activity (Pathcalling, 2004). RCK1 is a gene whose product is a serine/threonine protein kinase (Pathcalling, 2004). CNA1 is another protein involved in serine/threonine modulation of proteins, though this time as a phosphatase (Pathcalling, 2004). Finally, NIP1 is a protein required for nuclear transport (Pathcalling, 2004). Thus there is a trend of being involved in protein modulation, specifically as a kinase in both the DNA microarray data and in the Function Junction data.
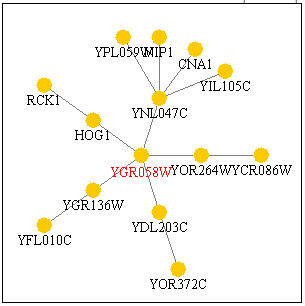
Figure 16. Genes with which YGR058W interacts. Image from Function Junction .
______________________________________________________________________________
Conclusion
My non-annotated gene YRG058W's expression levels were discovered for four different experimental conditions. For each experimental condition I used the Expression Connection database to compare genes with similar expression patterns. I then analyzed these genes' functions to try to hypothesize a function for my the YRG058W ORF. Several repeats of functions occurred including involvement as a transcription factor, involvement in binding to iron ion, and finally involvement in protein kinase activity. This protein kinase activity was also confirmed in two genes expected to interact with YRG058W according to the Function Junction database. Therefore, I am going to change my hypothesis as to YRG058W's function to having a cellular function of protein kinase activity and having a biological process of being involved in iron ion homeostasis or transport. Obviously, one should take this prediction with a grain of salt as it is purely prediction, and as shown above the "guilt by association method is not always successful". Nevertheless it is pretty impressive that one can possibly infer a gene product's function from the amount of mRNA transcribed under certain conditions.
______________________________________________________________________________
Works Cited
Campbell, A. Malcolm and L. J. Heyer. 2003. Discovering Genomics, Proteomics, and Bioinformatics. Benjamin Cummings: San Francisco.
Chu S., DeRisi J., Eisen M., Mulholland J., Botstein D., Brown P.O., Herskowitz I. 1998. The transcriptional program of sporulation in budding yeast. Science 282: 699-705.
DeRisi J.L., Iyer V.R., Brown P.O. 1997. Exploring the metabolic and genetic control of gene expression on a genomic scale. Science 278: 680-686.
GeneScape Portal. 2004. Pathcalling. <http://portal.curagen.com/pathcalling_portal/index.htm>. Accessed 2004 Oct. 21.
Lyons T.J., Gasch A.P., Gaither L.A., Botstein D., Brown P.O., Eide D.J. 2000. Genome-wide characterization of the Zap1p zinc-responsive regulon in yeast. Proc Natl Acad Sci. 97(14):7957-62.
[SGD] Saccharomyces Genome Database. 2004. Expression Connection. <http://genome-www4.stanford.edu/cgi-bin/SGD/expression/expressionConnection.pl>. Accessed 2004 Oct. 21.
[SGD} Saccharomyces Genome Database. 2004. Function Junction.< http://db.yeastgenome.org/cgi-bin/SGD/functionJunction>. Accessed 2004 Oct. 21.
Spellman P.T., Sherlock G., Zhang M.Q., Iyer V.R., Anders K., Eisen M.B., Brown P.O., Botstein D., Futcher B. 1998. Comprehensive identification of cell cycle-regulated genes of the yeast Saccharomyces cerevisiae by microarray hybridization. Mol Biol Cell 9(12):3273-97.
Wyrick J.J., Holstege F.C., Jennings E.G., Causton H.C., Shore D., Grunstein M., Lander E.S., Young R.A. 1999. Chromosomal landscape of nucleosome-dependent gene expression and silencing in yeast. Nature 402: 418-421.
_______________________________________________________________________________________________________________________________________________________
Questions, Comments? E-mail John