STM1/YRL150W and YLR152C: Expression Profiles
This web page was produced as an assignment for an undergraduate
course at Davidson College.
Purpose
Through the use of microarray gene expression data, this website hopes to explore the use of expression data to support or infer function in both STM1 and YLR152C, determine if predictions made in My Favorite Yeast Gene are reasonable, and make further predictions about the function of YLR152C through guilt by association and other methods.
STM1
Overall Expression
The many experiments that examined the expression of STM1 show that the gene is expressed fairly consistently with normally only small induction or repression. In the picture below this profile is shown by the clustering of tall bars close to zero while only a few small bars exceed -2 or 2.
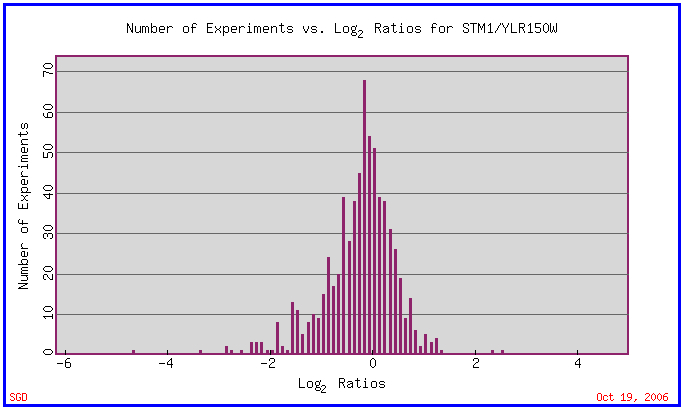
(SGD 2006, http://db.yeastgenome.org/cgi-bin/expression/expressionConnection.pl?type=summary&dbid=S000004140)
Strong Induction
Varying Zinc concentrations caused the two bars in the above graph that have log2 ratios above 2. In the picture below the strong inductions occur at 61 nM and 76 nM zinc deficiency.
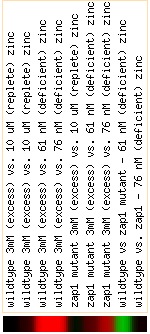
(SGD 2006, http://db.yeastgenome.org/cgi-bin/expression/expressionConnection.pl?type=summary&dbid=S000004140)
Genes that clustered well with STM1 come from a variety of chromosomes including chromosome 4, 2, 7, and 9 as well as chromosome 12 where STM1 is found. This refutes the idea that aneuploidy of a chromosome is responsible for the similar expression.
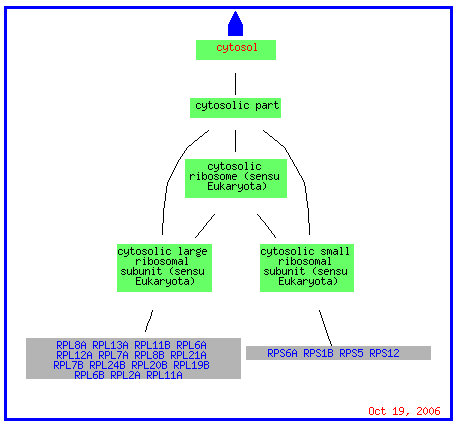
The GO slim mapper grouped STM1 with genes expressed in the cytosol as well as with genes expressed in the nucleus and cytoplasm. As you can see in the picture below, the genes expressed in the cytosol are attached to ribosomes just as STM1 was found to be during sequence analysis. (STM1 was grouped on the main page of GO slim mapper but does not appear in any of the visuals. This could be due to STM1 being the gene around which they are clustered.)
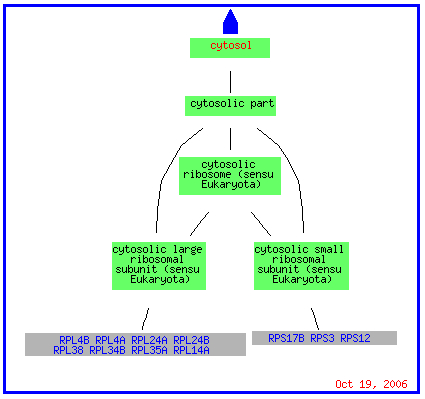
(GO Slim Mapper 2006, http://db.yeastgenome.org/cgi-bin/GO/goTermMapper )
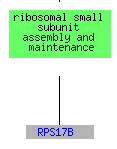
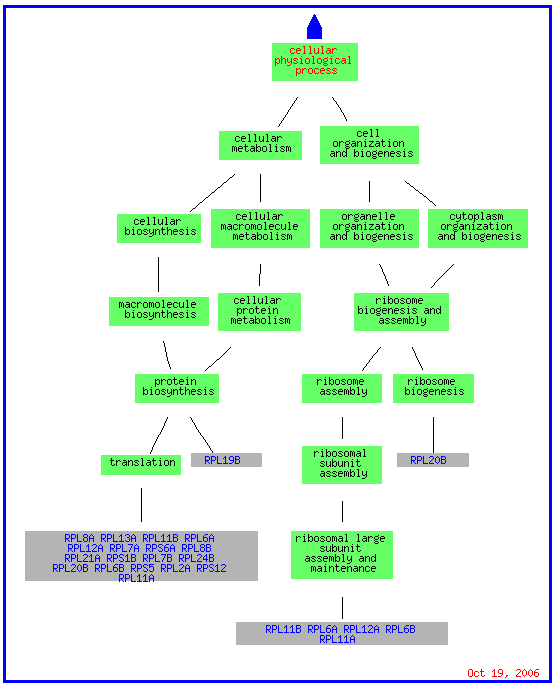
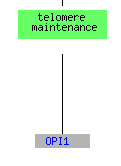
While RPS17B and RPL34B are involved in telomere maintanence, the formally listed process for STM1, 13 genes that clustered with STM1including RPL34B are responsible for translation and RPS17B is also responsible for the assembly and maintanence of the ribosome. The clustering of STM1 with translational genes could support Dr. Van Dyke's position that STM1 plays a role in transcription or translation (Van Dyke et al. 2004).
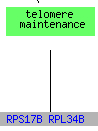

(GO Slim Mapper 2006, http://db.yeastgenome.org/cgi-bin/GO/goTermMapper )
Strong Repression
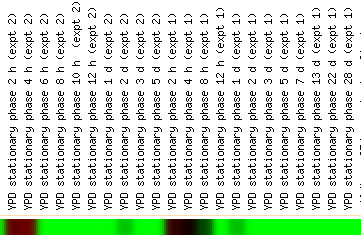
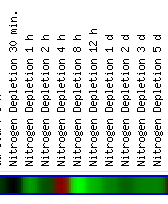
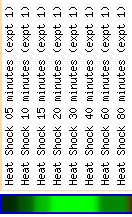
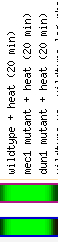
Different time points and concentrations in the environmental conditions of YDP Stationary phase, nitrogen depletion, and 21C to 37C show strong repression of STM1 and share the same cluster of genes. When the mec1 mutant strain is exposed to heat for 20 minutes, STM1 also experiences repression that tracks genes with similar functions to the environmental condition gene cluster. At the 5th hour of sporulation and 6th hour of histone depletion, a strong repression is witnessed but the effect is seen with a larger variety of genes that do not cluster by function as closely as the other conditions that are analyzed below.
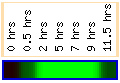
Sporulation
(SGD 2006, http://db.yeastgenome.org/cgi-bin/expression/expressionConnection.pl?type=summary&dbid=S000004140)
The genes that are repressed are located on several chromosomes including chromosomes 4, 6, 8, and 15 as well as 12. For the tests of environmental changes and the mec1 mutant, all but one gene clustered with STM1 is located in the cytosol in conjunction with a ribosomal subunit (picture below is for the environmental changes).
(GO Slim Mapper 2006, http://db.yeastgenome.org/cgi-bin/GO/goTermMapper )
For both the environmental conditions and mec1, the largest cluster of genes consisted of translation genes while no telomere maintanence genes clustered at all. For sporulation, the functions included in the cluster spread over a much broader range of the category metabolism than just translation, but it does include one other telomere maintanence molecule. The histone depletion is somewhere in between the spread for environmental changes and sporulation. It contains a broader number of functions than the environmental but at the same time contains multiple genes that fall into the translation and ribosome related groups. Three telomere maintanence proteins are also clustered in the histone depletion.
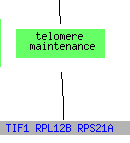
(GO Slim Mapper 2006, http://db.yeastgenome.org/cgi-bin/GO/goTermMapper )
Conclusions
The clustering patterns when STM1 is highly induced and highly repressed support Van Dyke's prediction that STM1 has more functions than simply anti-apoptosis and telomere maintanence. The high number of translation genes and ribosome related genes that are expressed in conjunction with STM1 points towards Van Dyke's first guess of STM1 being involved in the translational pathway instead of many diffuse processes, which Van Dyke gave as a second possibility (Van Dyke et al. 2004) . The repression and induction of six different telomere maintanence genes with STM1 under different conditions could also support STM1's formally recognized ontology as a telomere maintanence gene. The reason fewer telomere maintanence genes than translation genes track STM1's expression under different conditions could be that more translation genes are necessary for translation in general for the cell to achieve an appropriate response.
YLR152C
Overall Expression
Only a few experiments have resulted in strong induction or repression. Often the same experiment contains multiple high induction and repression ratios for YLR152C just at different time points or concentrations. Most experiments cluster around a ratio of zero with only small shifts towards induction or repression. This consistent expression may signal that the function performed by the gene's product remains at a decently stable rate and capacity even during environmental shifts.
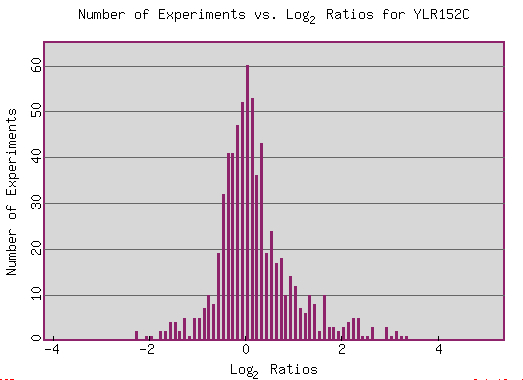
(SGD 2006, http://db.yeastgenome.org/cgi-bin/expression/expressionConnection.pl?type=summary&dbid=S000004142)
Strong Induction
While the titrable promoter experiment for COG4/YPR105C showed the greatest induction of YLR152C, this experiment returned no cluster of similar genes; luckily, the other conditions that caused induction of YLR152C 4 fold or greater (Log2 Ratio 2 or higher) clustered multiple genes. Histone depletion, Rapamycin inhibiton, and certain environmental conditions, YDP stationary phase, heat shock, amino acid starvation, and 1mM menadione, all showed high induction for different time points or inhibitors.

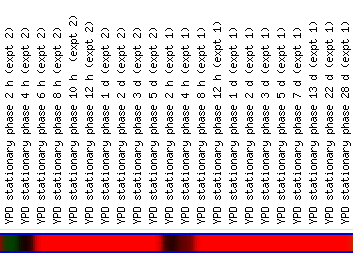
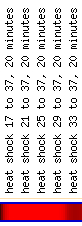
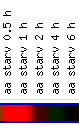
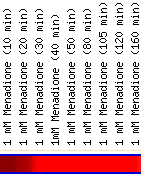
(SGD 2006, http://db.yeastgenome.org/cgi-bin/expression/expressionConnection.pl?type=summary&dbid=S000004142)
While these conditions did produce gene clusters, 47% of the genes clustered for changes in environmental conditions have an unknown biological process, 42% have an unknown molecular function, and 23% have an unknown cellular component. A similar trend appears in histone depletion and Rapamycin inhibition.
Aneuploidy can be ruled out as the reason for the clustering of the genes for the different conditions as the changes in environmental conditions cluster contains genes from multiple chromosomes such as chromosomes 2, 5, 11, and 13 as well as 12. Histone depletion has genes on chromosomes 2, 4, 9, 10, 13, 15 in addition to 12. Finally, Rapamycin inhibition induces genes on chromosomes 2, 5, 9,10, 11, 13, 16 as well as 12.
While the cellular component for most genes is listed as cytoplasm, the breakdown of the category especially for the genes induced by environmental change include genes that are attached to membranes in the cytoplasm such as the mitochondrial membrane or endoplasmic reticulum. The possible location on membranes is important if we use guilt by association because YLR152C contains multiple predicted transmembrane domains.
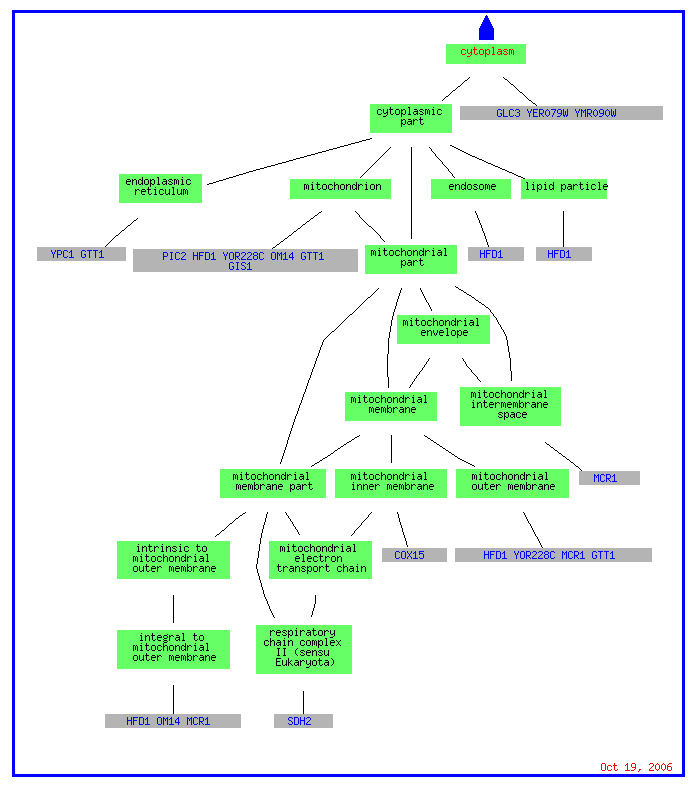
(Go Slim Mapper 2006, http://db.yeastgenome.org/cgi-bin/GO/goTermMapper)
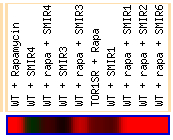
The known biological processes for all of the above induced clusters include many different types of metabolism both assembly and catabolism. The picture below is only able to capture a few of the metabolic pathways turned on by changes in the environment. The other conditions turn on similar metabolic pathways as well as many others. At the same time that the cell is turning on pathways for synthesis, only a few genes for the transport of materials into or out of the cell are induced.


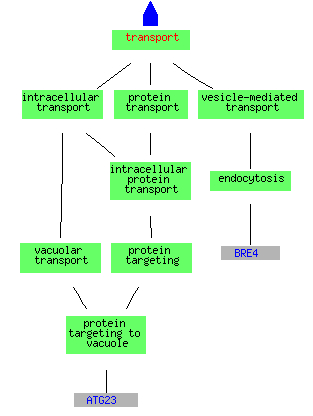
(Go Slim Mapper 2006, http://db.yeastgenome.org/cgi-bin/GO/goTermMapper)
Strong Repression
Repression of YLR152C with a ratio less than -2 includes the titratable promoter experiment for NSE1/YLR007W and the experiment using snf/swi mutant strains. As the titratable promoter experiment produces no similar gene cluster, only the mutant experiment provides interpretable data. Sadly this cluster also follows the induced clusters trend of grouping together many genes with unknown biological processes (47%) , functions (38%), and cellular components (19%).
Aneuploidy is ruled out as genes from multiple chromosomes are induced besides chromosome 12. They included chromosomes 1, 3, 4, 7, 11, 14, 15, 16.
Once again varying catabolic, metabolic, and biogenesis pathways are repressed while only two transporter genes, one for ions and one for allantoate, are repressed.
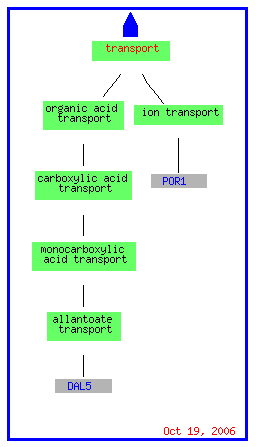
(Go Slim Mapper 2006, http://db.yeastgenome.org/cgi-bin/GO/goTermMapper)
Conclusions
Because the number of unknown genes in each cluster is close to 50%, guilt by association is difficult to assign. The heavy clustering with metabolic pathways has two possible implications for the gene YLR152C. The first possibility is guilt by association would say YLR152C is likely a gene involved in a metabolic process. Because the cellular component of several of these clustered genes is a membrane such as the mitochondrial membrane, the prediction of the Kyte-Doolittle plot that the protein generated by YLR152C has transmembrane domain would not be broken if this were the case. The second possibility is that YLR152C is a transport protein like the conserved domains and other sequence analysis predicted and that the molecules that it is responsible for transporting have something to do with one of the metabolic processes. As all of the gene clusters contained a pathway related to the synthesis of glycogen or other sugar intermediates and products, the gene could be responsible for the transportation of molecules that assist in the process or are alternative molecules for use in the process. It would also be able for it to transport molecules that are similar to the ones used in that process but are used in a different pathway.
References
SGD References
A. SGD. 2006 Oct. STM1/YRL150W Summary.<http://db.yeastgenome.org/cgi-bin/locus.pl?locus=MPT4>.Accessed 2006 Oct. 14.
B. SGD. 2006 Oct. YLR152C Summary.<http://db.yeastgenome.org/cgi-bin/locus.pl?locus=YLR152C>.Accessed 2006 Oct. 14.
C. SGD. 2006 Oct. GO Slim Mapper. <http://db.yeastgenome.org/cgi-bin/GO/goTermMapper>. Accessed 2006 Oct. 17.
D. SGD. 2006 Oct. GO Annotation Summary. < http://db.yeastgenome.org/cgi-bin/GO/goReport.pl >. Accessed 2006 Oct. 17.
Other References
Van Dyke MW, Nelson LD, Weilbaecher RG, and Mehta DV. 2004 June 4.Stm1p, a G4 Quadruplex and Purine Motif Triplex Nucleic Acid-binding Protein, Interacts with Ribosomes and Subtelomeric Y' DNA in Saccharomyces cerevisiae* In J. Biol. Chem. 279(23): 24323-24333. JBC online <http://www.jbc.org/cgi/content/full/279/23/24323 >. Accessed 2006 October 5.
Links
Erin's Genomics Web page
Genomics Course Page
Biology Home Page
This page was created by Erin Zwack. Comments and questions are welcome.