This web page was produced as an assignment for an undergraduate course at Davidson College.
A Three-Way Comparison of Gene Annotation Tools Using the Halorhabdus utahensis Genome
Will DeLoache, Peter Bakke, Nick Carney, Mary Gearing, Matt Lotz, Jay McNair, Pallavi Penumetcha, Samantha Simpson, Laura Voss, Max Win, Laurie Heyer, A. Malcolm Campbell
Abstract
As genome sequencing becomes cheaper and easier, the need for effective tools to analyze these sequences becomes more and more pressing. Here, we describe an undergraduate laboratory course in genomics that addresses this growing need by comparing 3 different genome annotation tools. The Halorhabdhus utahensis genome sequence was submitted to JGI's Integrated Microbial Genomes, the Rapid Annotation using Subsystem Technology (RAST), and JCVI's Manatee for annotation. The annotation results were compared and demonstrated a significant lack of overlap between feature predictions. Our results underscore the need for effective and standardized methods of genome annotation and provide a novel method of refining annotation techniques through multi-tool comparisons.
Introduction
As the cost of genome sequencing decreases exponentially, there is an increasing need for software tools that can analyze massive amounts of raw sequence data quickly and efficiently. While efforts to create and refine genome annotation software have already begun to provide powerful tools for automated annotation, the complex nature of this problem and the potential benefits that its solution will bring require that more resources be dedicated to the field of genomics. Towards the goal of training future scientists in genomics laboratory methods, this paper will present the work of an undergraduate genomics class that took on a semester-long genome annotation project.
The importance of research in an undergraduate genomics curriculum has been well-documented.1 Recent efforts to incorporate real-life metagenomic studies into research curricula using a "learning by doing" approach have been successful.2 Educational approaches of this type train students to think as scientists and arouse excitement through the discovery of new knowledge. Additionally, students gain a greater understanding of the obstacles that impede scientific progress.
In order to effectively address the challenge of developing effective software tools for analyzing sequence data, it is important that future scientists understand the current state of the field. The undergraduate research described here will address this question by comparing 3 different genome annotation tools: JGI's Integrated Microbial Genomes, Rapid Annotation using Subsystem Technology (RAST), and JCVI's Manatee . To assess the strengths and weaknesses of these annotation tools, we annotated a single genome using each tool and performed a comparison of the results. The organism selected for annotation was the halophilic archaea Halorhabus utahensis, isolated from the Great Salt Lake in Utah and previously described in 2000 by Tindall and Ingvorsen.3
Using a computational approach to analyze various aspects of these 3 annotations, we were able to describe general trends in the datasets of each annotation and to begin to assess the validity of their predictions. Through this work we also hope to demonstrate the state of genome annotation software, and in doing so, provide some direction for the improvement of the current methods. While not described in this paper, we also plan on testing the predictions of the 3 annotations experimentally.
Materials and Methods
The raw genome sequence of H. utahensis was obtained from the Joint Genome Institute and run through 3 genome annotation tools: JGI's Integrated Microbial Genomes, Rapid Annotation using Subsystem Technology (RAST), and JCVI's Manatee . The sequence consisted of 5 contigs. For the purposes of this paper, only the main contig (3,102,403 bps) has been analyzed.
For each annotation, we used the associated genome browser to view annotation information. These browsers were assessed for their user-friendliness and capabilities.
We also developed computational tools to analyze the annotation information. These tools included:
- EC Number Searcher: performs a search of the 3 annotations to determine if a particular EC Number had been called
- EC Number Blaster: for a given EC number, it blasts all known proteins of that EC number against a combined list of protein predictions for the 3 annotations.
- Annotation Text Search: performs a simple text search of each annotation and returns hits in a tabular format
Various perl and BioPerl programs were also written to perform large-scale analysis of data, such as gene overlap calculations, etc.
Venn Diagrams were generated using 3Venn.
Sequence logos were generated using Berkeley's Weblogo Tool. To determine the position-weight-matrix of the sequence logo, we found the consensus 7-bp RBS using RSAT's Pattern Discovery Tool on all 50 bp regions upstream of proteins. We then searched these 50 bp upstream regions again for all matches with the consensus sequence, allowing a 1 bp difference. This demonstrated which bases were variable and which were highly conserved.
Pfam and NCBI BLAST were used for verifying function predictions.
Results
In order to assess the quality of the annotations produced by JGI, RAST, and Manatee, we compared the feature calls - both RNA genes and ORF's - in a variety of ways. Just looking at the number of predicted features from each annotation (JGI = 3126; RAST = 2915; Manatee = 3284), it is obvious that a significant number of discrepancies exist between the 3. To characterize these discrepancies more fully, we utilized various computational methods to pull out some general trends.
We first looked at the number of feature calls that matched exactly across the 3 annotations. An exact match was defined as a feature that shared the same 5' and 3' end for each annotation. Function prediction was ignored for this comparison. While approximately 3,000 features were predicted by the 3 annotations, only 1,471 of these matched exactly.
We then considered the number of cases where the 3' end of a feature matched exactly across the 3 annotations but the 5' end was allowed to differ. This method of comparison tolerated cases when the annotations predicted different start codons for the same ORF. We found that 2,764 features fit this criteria, meaning that 1,293 features had at least one annotation predict a different 5' end for a feature that was found by all 3. It should be noted that RAST's annotation accounted for most of the difference between comparison methods; 1,032 of the 1,293 matching features with varying 5' ends differed only in the RAST predictions. Figure 1 describes all of these findings more thoroughly.
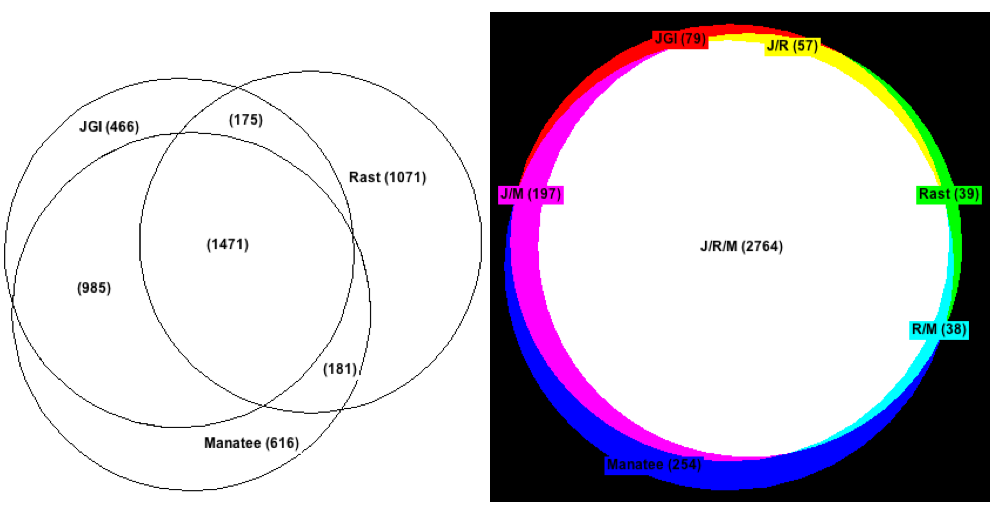
Figure 1: Feature overlap between the JGI, Rast, and Manatee annotations. The panel on the left shows overlap between exact matches in feature calls (both 5' and 3' end were the same). The panel on the right shows overlap between feature calls without regard to the 5' end (3' end was the same). Note that the Rast predictions are significantly different from Manatee or JGI when the 5' end is taken into account.
Based on our findings for feature overlap, we knew that significant disagreement existed between the annotations at the 5' end of many features. Because these differences would affect total feature length, we compared the average value for and distribution of feature length across the 3 annotations. A summary of this analysis is shown in Table 1. We found that RAST predicted features that were on average 75-100 bps longer than either of the other 2 annotations. This finding was consistent with the feature-matching results, which showed that RAST made significantly different predictions about the 5' end of many features.
It should also be noted that the longest gene for each annotation occurred at the same location on the H. utahensis genome. Concerned that this ORF was too long (10,001 bp) to exist in an archaeal genome and had been incorrectly called by all three annotations, we further investigated it. Based on tblastx results, a significant amount of similarity (E-value: 2e-07) was found with the previously documented halomucin gene from Haloquadratum walsbyi4. This 60,000 bp gene is thought to protect H. walsbyi from desiccation in high salt environments. Thus, it would seem reasonable that an ortholog might exist in H. utahensis.
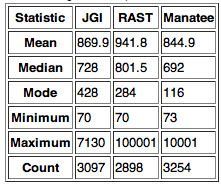
Table 1: Descriptive statistics of predicted feature length for each annotation. Note that Rast has a significantly larger average feature length.
A histogram of feature length was created for each annotation to show the distribution of gene lengths (Fig. 2). As expected, RAST's histogram is skewed more to the right than JGI or Manatee's. Additionally, Manatee predicted significantly more features in the 70-200 bp range than JGI or RAST.
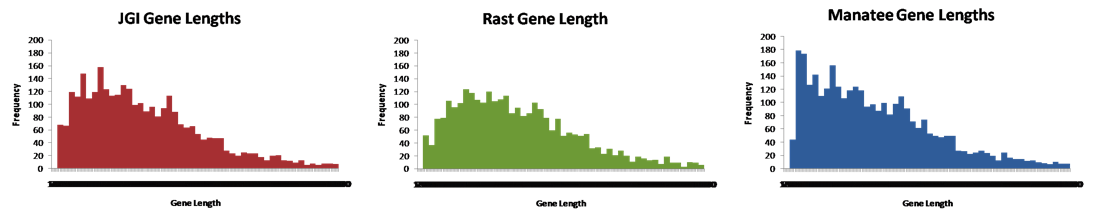
Figure 2: Feature length histograms for the three annotations. The x-axis ranges from 0 - 3000 bps with 50 bp bins. All features over 3000 bps were tossed out.
Feature lengths were analyzed in one additional way. We suspected that shorter features were more likely to be a source of disagreement than long ones. Therefore, for each annotation, we found the average length of features that matched at the 3' end as well as the average length of genes that were uniquely called by that annotation (Fig 3). From this figure, it can be clearly seen that features agreed upon by all 3 annotations tended to be much longer than features that were only called by one annotation. Additionally, differences in feature length between the 3 annotations appear to be exaggerated for uniquely called features.
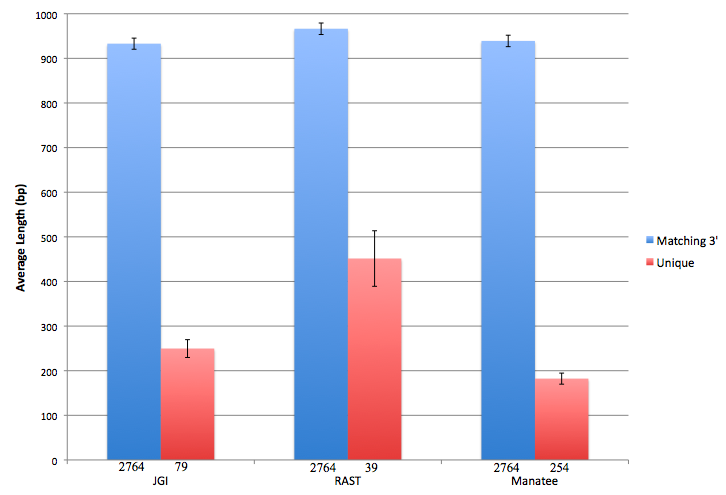
Figure 3: Length comparison for unique vs. matching features. Blue bars represent the average length of features for which all annotations matched at the 3' end. Red bars represent the average length of features that were uniquely called by the given annotation, meaning that the 3' end was not called by either of the other 2 annotations. The number of genes averaged is shown below each bar. Note that uniquely called features tend to be shorter than matching features. Additionally, RAST has a much larger feature length than JGI or Manatee for features that it uniquely called (red). Feature length differences are less obvious for features that had matching 3' ends (blue). Error bars represent 1 SE.
Having thoroughly analyzed feature length, we attempted to explain the differences that we had found. Based on hand curation of the ORF's, we noticed that RAST tended to predict more alternative start codons than JGI or Manatee. To quantify this tendency, we tabulated the start codon frequencies for all ORF's from each annotation (Table 2). Our results confirmed what we had suspected based on hand curation, that RAST called many more (more than two times as many) alternative start codons.
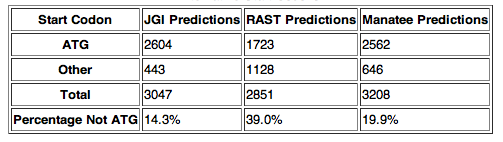
Table 2: Descriptive statistics for alternative start codon calls. Note that Rast predicted significantly more alternative start codons. All alternative start codons were either TTG or GTG.
Having shown that RAST's annotation contained more alternative start codons in its ORF's, we wanted to try to determine the validity of these predictions. To do this, we looked at ribosomal binding site (RBS) conservation. We hoped to find that RBS's were more conserved in either JGI and Manatee's annotations or in RAST's annotation. Increased RBS conservation might suggest that one annotation was more accurate than another.
We discovered only one highly conserved sequence in the 25 bp region upstream of the ORF's (Fig 4). The GGAGGTG consensus sequence was identical across the 3 annotations and was found to be antisense to the 3' end of the 16s rRNA. This suggested that we had found the Shine-Dalgarno sequence, however we observed that less than 10% of the ORF's from each annotation contained this sequence, even when we allowed for a one basepair difference (JGI = 8.6%; RAST = 8.1%; Manatee = 8.6%). Because the RBS frequency was so low, it is difficult to assign any significance to the small difference in consensus RBS frequency between RAST and the other two annotations. We also compared the spacer length between the RBS and the start codon for genes containing the consensus RBS (Fig 5). No significant difference between the 3 annotations was observed.
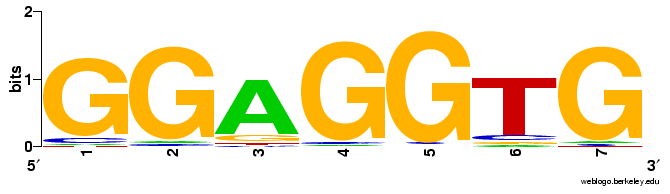
Figure 4: Consensus ribosomal binding site sequence logo generated from the JGI annotation. The GGAGGTG antisense sequence was found as expected near the 3"; end of the 16s ribosomal RNA. All three annotations generated similar sequence logos, however, less than 10% of the genes contained the consensus RBS upstream of the start codon.
![]()
Figure 5: Histogram showing spacer length between the consensus RBS and start codon for the JGI annotation. Only genes containing the consensus RBS in the 18 bp region upstream of the start codon were included. Note that the RBS is usually found between 4 and 8 bps upstream of the start codon.
Discussion
We have performed 3-way analysis of JGI, RAST, and Manatee genome annotation software based on their annotation of the H. utahensis genome sequence. By highlighting general trends through computational approaches, we have attempted to evaluate areas of strength and weakness for each annotation tool.
Our findings showed that RAST's annotation of the H. utahensis genome predicted significantly different 5' ends for features that matched at the 3' end across all annotations. Most of this difference was the result of longer feature predictions by RAST, possibly due to its higher tolerance of alternative start codons. In other archaeal species, an estimated 30% of ORF's begin with an alternative start codon.5 This estimate from the literature falls between predicted frequencies of the 3 annotations, making it is difficult to assess the validity of the 3 annotations without experimental evidence.
Ribosomal binding site conservation analysis was also not sufficient to assess the validity of RAST's feature prediction when compared to JGI's and Manatee's. While we hoped that differences in RBS conservation might provide insight into the accuracy of each annotation's feature predictions, fewer than 10% of all predicted ORF's were found to be downstream of the RBS consensus sequence. In another archaeal species, Methanococcus vannielii, it has been shown that up to 50% of the genes are preceded by a conserved RBS.5 The low RBS conservation frequency in H. utahensis made it difficult to determine the actual location of the translation initiation site, and thus it was difficult to assess which annotations made more accurate predictions.
Our analysis also showed that features that were only found by 1 annotation (372 total unique features) tended to be 2-3 times shorter than the average overall feature length. This suggests that the annotation software is better at predicting long features than it is at predicting short features, perhaps because of the increased chance of finding a BLAST hit.
The findings we have described demonstrate the need to improve genome annotation software. Less than 50% of the predicted features matched location across all 3 annotations, and even fewer still had matching function predictions. This implies that the findings of a genomic study can vary greatly depending on the annotation software used. Until annotation software is capable of accurately predicting gene functions, it is important to consider the use of multiple annotations to study the genome of an organism.
By studying genomes using multiple annotations, as has been done here, it is possible to draw more conclusive information from genome sequences, while at the same time helping to refine the annotation software itself. Moving forward, it will be important to match experimental data with annotations to assess the strengths and weaknesses of various annotation software tools. Additionally, running these annotation tools on well-studied species might elucidate more fully where disagreements arise and which annotations are more accurate in which circumstances.
References
- Lepatto D, Alvarez C, Barnard D, Chandraskekaran C, Chung H, et al. (2008) Genomics Education Partnership. Science 322:684-685.
- Hingamp P, Brochier C, Talla E, Gautheret D, Thieffry D, et al. (2008) Metagenome annotation using a distributed grid of undergraduate students. PLoS Biol 6(11): e296.doi:10.1371/journal.pbio.0060296
- Waino M, Tindall B, Ingvorsen, K. (2000) Halorhabdus utahensis gen. nov., sp. nov., an aerobic, extremely halophilic member of the Archaea from Great Salt Lake, Utah. International Journal of Systematic and Evolutionary Microbiology 50:183-190.
- Bolhuis H, Palm P, Wende A, Falb M, Rampp M, et al. (2006) The genome of the square archaeon Haloquadratum walsbyi: life at the limits of water activity. BMC Genomics 7: 169.doi:10.1186/1471-2164-7-169.
- Dennis P. (2000) Ancient Ciphers: Translation in Archaea. Cell 89:7 doi:10.1016/S0092-8674(00)80288-3.
Acknowledgements
Cheryl Kerfeld and Edwin Kim, JGI; Jonathan Eisen, UC Davis; Gary Stormo, Washington University; Matt DeJongh, Hope College for SEED/RAST; Ramana Madupu, J. Craig Venter Institute for Manatee; Kjeld Ingvorsen, Det Naturvidenskabelige Fakultet; Biologisk Institut Aarhus Universitet, Denmark; Chris Healey at Davidson College for ordering and growing H. utahensis locally
Genomics Lab Homepage
Genomics Lab Wiki
Biology Home Page
© Copyright 2009 Department of Biology,
Davidson College, Davidson, NC 28035
Send comments, questions, and suggestions to: Will DeLoache