Discussion of Freed et al. (2008) |
This web page was produced as an assignment for an undergraduate course at Davidson College.
Introduction
Under constant conditions in the same environment, unicellular organisms in clonal families show phenotypic variation due to stochastic, or noisy, gene expression. Specifically, phenotypic noise has been shown to result from random fluctuations in the process of transcription and translation. Research on phenotypic noise addresses questions about the molecular processes underlying biological noise, and the potential benefits phenotypic noise may have for the organism. Thus far, research has focused more on detailed analysis of variation in individual traits, but lacks any global analysis to compare the level of noise between genes. This paper describes a new method developed by Freed et al. to identify genes in the entire genome with high phenotypic noise.
The method developed here was tested in the bacterial pathogen Salmonella enterica ssp. 1 serovar Typimurium. Freed and colleagues fragmented the genomic library and fused fragments (400 – 1200 bp) into a plasmid upstream of green fluorescent protein (GFP), so that cells with a plasmid containing an active promoter express GFP. Cells were then screened using fluorescence-activated cell sorting (FACS). The five percent of cells showing the highest GFP expression (highest fluorescence) were selected and inoculated. From this clonal culture, the five percent of cells with the lowest GFP expression were selected, and the process was repeated 7 times total. This screen produced a collection of promoters with high noise levels. This brief webpage summarizes the figures presented in this paper, and presents my conclusions about the article.
Figure Summaries
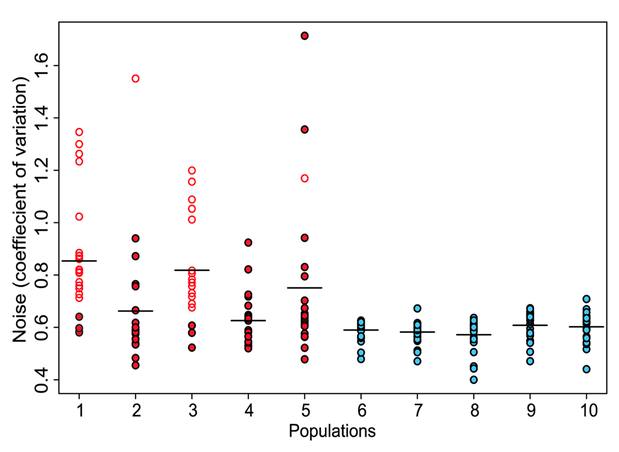
Figure 1. Five groups (red dots below) of clones were selected by the screen described above, and five control groups (blue dots) were formed by randomly selecting clones with variable levels of GFP expression during FACS sorting. Phenotypic noise of each population was quantified by calculating the coefficient of variation in GFP expression. The average coefficients of variation for each of the control populations were about the same. Meanwhile, the average coefficients in selected populations were higher than control populations. This figure shows that the method developed does successfully produce populations enriched for promoters with high variation, or noise. Selected clones identified to be carrying promoters involved in flagella synthesis (open red dots) showed the highest coefficients of variation.
Freed et al. Figure 1.
Figure 2. This figure, below, also shows that the method developed enriches the populations for noisy promoters by showing the measured GFP expression. Here they overlapped histograms of clones from each of the control populations (blue lines) and selected populations that have the highest level of noise. The control clones in all populations express GFP at roughly the same level, producing a single bell curve. Selected clones, however, express variable levels of GFP even within the same population, seen by the multiple peaks of each experimental line. Orange lines denote clones with the fliC flagellar promoter and yellow denotes clones with the flgK flagellar promoter.
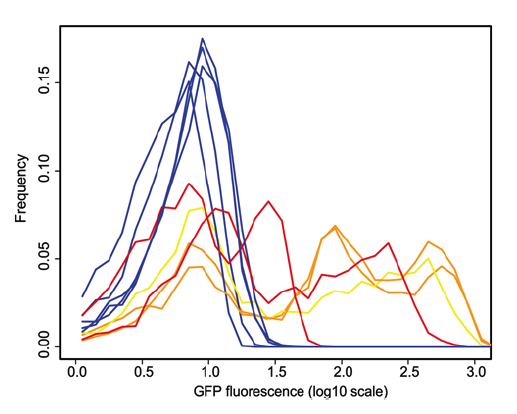
Freed et al. Figure 2.
Figure 3. The photograph in panel A shows a microcolony of S. Typimurium containing the fliC promoter, grown for about six generations. The clones in the colony express GFP at visibly different intensities. Tracking software was used to track the cell lineage and analyze GFP expression in each individual cell over the time course of six generations. These data were assembled into the lineage tree shown in panel B. Light boxes represent high levels of GFP at the given time interval (about 2 minutes between expression readings, based on the time axis), and dark boxes represent low GFP levels. Each rod represents a single cell in the microcolony until it divides, bifurcating the lineage branch. This tree illustrates the pattern of fliC regulation switching. From a single cell, clones show different levels of GFP expression over a relatively short time period (less than 2 hours).
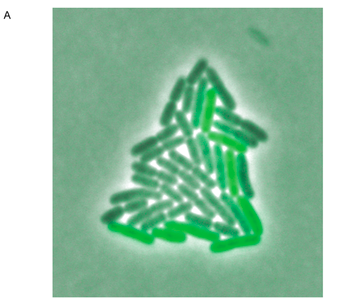
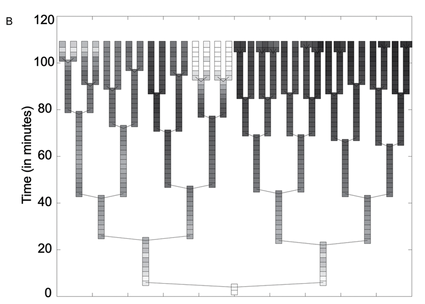
Freed et al. Figure 3.
Conclusion
Freed et al. successfully initiated a new method of selecting promoters with high noise level from an entire genomic library. Because the fragmentation is random, it is possible that this method does not detect some promoters that actually have very high noise levels because fragmentation made it nonfunctional, or made a fragment less than 400 bp and was then thrown out. If you repeated this method numerous times though with the same genomic library and alternated the selection regimen (low then high fluorescence), there might be a higher probability of detecting all of the promoters with the desired noise level. One of the good aspects of this method is that by changing the time scale, one would be able to select promoters from the genome with perhaps a lower range of noise. Also, I think this method could be used to identify new active promoters for unannotated genes since it surveys the entire genomic library. This method though seems like it could be applied to other prokaryotes, but might be more difficult to adapt to humans or other eukaryotes. I was curious why this particular bacterial strain was chosen, since this isn't addressed in the article. S. Typimurium is not the most biomedically relevant strain of Salmonella enterica, and it does not appear to be the only bacterial species used in the Ackermann lab.
In the demonstration of this method, they found that in S. Typimurium, the noisiest promoters are involved in producing the flagella, which has a role in host-pathogen interaction. The hypothesized benefit of this could be related to the bacteria’s pathogenesis. All of the figures presented in this paper are shown in order to show that the method works more than to show a detailed analysis of the noisiest genes. So I agree with the authors’ conclusion that the method described here does select promoters that confer high phenotypic noise levels. The article itself was written very clearly and the figures were generally concise and straightforward.
Reference
Freed NE, Silander OK, Stecher B, Böhm A, Hardt WD, Ackermann M. A simple screen to identify promoters conferring high levels of phenotypic noise. PLoS Genet 2008; 4(12): e1000307.
© Copyright 2010 Department of Biology, Davidson College, Davidson, NC 28035