Hartman AL et al (2009) Human gut microbiome adopts an alternative State following small bowel transplantation. PNAS Early Edition, Article
In this study the researchers aimed to differentiate the microbiota living in the small intestine and see how the NOD2 mutation affected the intestine before and after a small bowel transplant (SBT). These microbiota help in digestion of food such as complex polysaccharides, inform the immune system of potential pathogens, and act as a barrier to them. SBTs are performed to assist individuals who have dysfunctional colons or need more intestinal tract to fully absorb the nutrients necessary for life. http://childrensnyp.org/mschony/pediatric-organ-transplantation-small-bowel-transplantation.html Many patients that get SBTs are at high risk for allograft rejection, followed by bacterial sepsis.
Intestinal allograft rejection is when the host body does not accept the transplanted intestinal tissue because the host body considers it to be foreign and therefore it gets attacked by the host’s immune system. This rejection appears like Crohn's disease, which has symptoms of sores that grow to ulcers penetrating thorough the intestinal wall , and increased incidence of this disease seems to be associated with mutations in NOD2 gene due to linkage. NOD2 stands for nucleotide-binding oligomerization domain containing 2. According to Hartman et al., the NOD2 protein participates in the immune system, more specifically, in the protection of the intestine by detecting the products of microbes and the production of antimicrobial proteins. The likelihood of getting these infections is 100x greater in patients with the NOD2 mutation.
At the end of a SBT, an ileostomy is created. An ileostomy, according to the American Cancer Society is an opening made through the abdominal wall during surgery through which bodily wastes excretes often looking like a liquid paste that is full of digestive enzymes. It is through the ileostomy that the transplanted tissue can be examined for allograft rejection and provides an opportunity for the researchers to observe the changes in microbiota.
Seven different experiments were performed.
In the first experiment, 17 SBT patients of one surgeon that were adults and had at least 10 post transplant sampling points were chosen to be included in their data. The patients needed to be able to be followed for a long period of time. The researchers did recognize that their results would then be biased towards individuals who had better outcomes so the data maybe skewed toward a healthier transplant patient. All of the transplants were from NOD2 wildtype donors. Only 13 out of the 17 patients survived more than 2 years after the transplant. From these patients, they were able to collect 251 samples of the liquidy waste(effluent) through the ileostomy from 5-10 cm into the ileum. Time was not a control in collection of these samples but was based on medical need, therefore their experiment faulted in this way as well.
The researchers sequenced the 16S ribosomal DNA of the bacteria found in the samples collected 50 to 84 days post transplant from nine randomly selected patients. Here the experiment was faulted. The range of days should have been around 1 or at least less 1 week instead of more than 3 weeks apart. In 24 days bacterial diversity can undergo major shifts. Nevertheless, they found 4 orders of bacteria that comprised 99.8% of the 1892 full-length bacterial 16S rDNA sequenced: Lactobacillales, Enterobacteriales, Bacteroidales, and Clostridiales. Of the last 0.2%, two of the bacteria were in the Actinobacteria order and four were in the Fusobacteria order. To assess the diversity of the bacteria, they performed a Shannon index, which takes into account the number of species and the evenness, which is how relatively equal the number of different species are in a community. They obtained a low number which states that either they aren’t many unique species or there isn’t equal representation of the species present, most likely the first reason in this case. Since there was low diversity, the researchers evaluated their option for using qPCR, quantitative PCR or real-time PCR, a cheaper, more efficient and more quantitative approach. The results from qPCR and sequencing were “highly concordant”, according to Lin’s concordance correlation coefficient (CCC) so qPCR was then used for the rest of the experiment.
In regards to the evenness, the researchers found that the proportions of the four orders were similar among the 229 samples obtained posttransplant and preclosure of the ileostomy, despite the differences in the total number of bacteria per sample. Facultative anaerobic Lactobacilli and Enterobacteria were in greater numbers than the strictly anaerobic Bacteroides and Clostridia. This was considered to be opposite to the “normal” microbial proportions according to earlier studies. Almost half had higher levels of strict anaerobes at the beginning of the sample collection and of them, 75% received a bowel that had not been decontaminated therefore the “normal” microbial environment may have survived through the transplant. Fluctuations of bacterial orders and bacteria present at different stages caused researchers to perform statistical tests and clustering algorithms to see if these fluctuations resulted from “patient outcome (normal bowel function or death), ileostomy type (which determines whether mixing from the colon was possible or not), and NOD2 genotype.” The tests found no correlations with clinical factors.
For 10 of the 17 patients, their ileostomies were closed and 10 of the 12 samples they obtained after this surgical closing had bacterial proportions opposite to preclosure. The strict anaerobes were higher in number than the facultative anaerobes, more consistent with the “normal” community found in previous studies.
The researchers then considered that the facultative anaerobes may be more dominant due to the ileostomy rather than the SBT. Therefore, they sequenced ileal effluent samples from nontransplant patients with temporary ileostomies using qPCR. The microbiota were similar in proportion to the preclosure samples except two out of five patients had higher levels of strict anaerobes, a pretty high percentage. Notably, the ileostomies for these two patients had been created less than one week while the other three were created several months before. This difference should have been analyzed futher but instead was brushed off with this explanation. A further experiment should have been conducted that analyzed nontransplant patients with ileostomies and whether the shift in bacterial environments was truly based off time. Because the nontransplant samples were collected externally instead of 5-10 cm in the ileostomy, the researchers collected effluent from SBT patient 9 externally as a control. The same composition was found using both methods and showed that the preclosure profile remained the same throughout the 2.5 years. The major problem here is that the researchers only used one control to verify that collected samples internally and externally were similar. Only one control is not enough evidence to verify that sampling is the same internally as opposed to externally. They should have used five controls to compare to the five samples. In all, they should have had many more samples for both cases and they were clearly trying to finish up there experiment and verify that they accounted for potential deviations from what was commonly found.
The researchers also addressed the question of whether the mucosal bacteria on the intestinal lining were differently proportioned (facultative to strict) compared to the planktonic bacteria they had studied. The mucosal lining is where the host and microbe bacteria are directly interacting, therefore their composition means more as to which bacteria are involved in the graft rejection. Why they didn’t address these bacteria in the first place is perplexing since they considered the projection due to the increased levels of allograft rejection due to the NOD2 mutation and had yet to sample the bacteria from the tissue. They examined the bacteria attached from 29 unwashed biopsy samples of SBT patients. According to the paper, the data indicated that the samples are similar in bacterial profile however according to the figure; this does not seem to be the case. They do address that Bacteroides is much more abundant in the biopsy samples, agreeing with previous studies.
They last aspect they analyzed was whether the metabolism of the two different compositions (preclosure and postclosure) were different and how different. They used GC-TOF (gas chromatography time-of –flight more info) mass spectrometry, a procedure used to analyze global metabolite disparities. Principal component analysis and partial least squared regression showed that preclosure and postclosure samples were statistically separable and distinct for 18.3% of the metabolites as determined by ANOVA, ANalysis Of Variance, a statistical test.
Of that 18.3%, 21 of the compounds were identifiable while 45 were not identifiable but could still be categorized. A metabolic network diagram based off of 139 compounds to emphasize 21 differentially regulated known metabolites, see how involved they are in preclosure or postclosure samples, and show their relationship to biochemical molecules. Many of the relationships found to be related to the tricarboxylic acid cycle were from the preclosure samples. Also in these samples, there was lactic acid which is understandable since the order Lactobacilli is found more commonly in preclosure samples. The postclosure samples had high spectral similarities to amino acids and sugars. The role of microbiota in human metabolism is not fully understood.
However, it is understood that the shift in microbiota occurs due to the creation of an ileostomy, mostly likely due to the fact that an ileostomy allows oxygen to flow in therefore the community shifts from dominantly strictly anaerobic to facultative anaerobic because facultative anaerobes can survive more easily in oxygen than strict anaerobes, hence their names. When the ileostomy is no longer present, access to oxygen is cut off so the strict anaerobes can grow back to being dominant because the facultative bacteria have no more advantage. Since the distal GI is considered to be anaerobic, the conclusion that the normal GI microbial community resembles the postclosure samples. The shift between two stable environments shows that the human GI tract can compensate when undergoing ecological changes and is therefore more versatile than originally acknowledged.
The researchers disregarded one of their main purposes for the experiment: the NOD2 mutation was no longer addressed after the 3rd page. It is not even dealt with in the Discussion or Conclusion, therefore its significance seems to be irrelevant to the findings of this experiment. Yet, the researchers do not even acknowledge this fact. The researchers seem to have simply forgotten about the mutation and seem absentminded for not reassessing it in the Discussion.
Figures
Figure 1
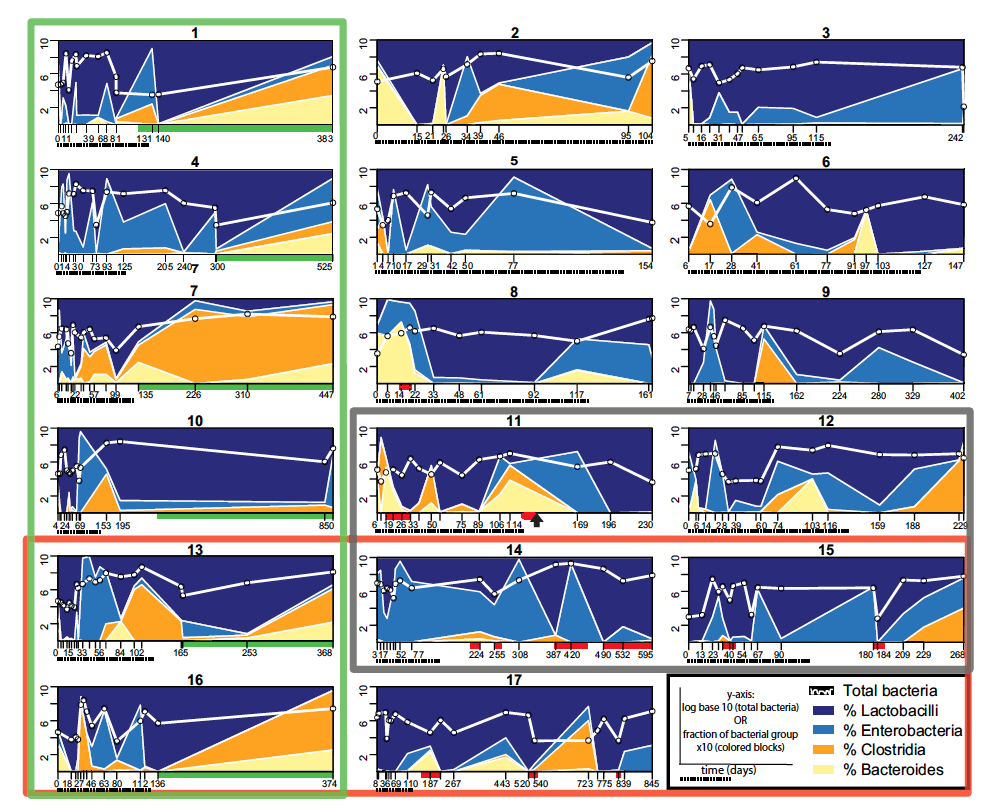
The bacterial populations of the 17 small bowel transplant (SBT) patients were sequenced by qPCR every time they came in for medical need so the days varied and were not consistent from patient to patient. Therefore the x-axis for each graph has different labels according to the number of days after the patient received the transplant and their sample was obtained. Underneath the x-axis the dashed line represent days 0-125, the timespan needed for time-binning, or assigning the samples to certain time slots. The red bars indicate graft rejection while the green bars represent a closed ileostomy.
Above the x-axis, the white line represents the total number of bacteria found in the sample based on a log base 10 scale. The different colors represent the different orders: navy blue, % Lactobacilli; blue, % Enterobacteria; orange, % Clostridia; beige, % Bacteroides. The sum of the bacteria in the prevailing four orders was designated to be 100% so that the percents added up to 100%. The percentages are divided by 10 when referring to the y-axis so the same 1-10 scale for the white line and the percentages could be used.
The thick lined green box around 6 patients represents those who had their ileostomies closed, the thick red line box surrounds those with the NOD2 mutation and the dark grey/ “black” box encompasses the patients who died during the study. The black arrow found underneath patient 14 represents when this patient has a second SBT.
Figure 2

Piecharts of the bacterial orders found in different clinical situations. In each of the charts, the percentages of the four orders within the total bacteria population are geometric means of the number of samples (n=?). The four orders are colored with the same scale as figure 1: navy blue, % Lactobacilli; blue, % Enterobacteria; orange, % Clostridia; beige, % Bacteroides. Every chart is contrasted with chart A. Chart A shows the distribution in a transplant patient still with an ileostomy and only the two colors of the facultative bacteria can be seen. Chart B represents the distribution of a nontransplant patient with an ileostomy, with an almost fully Lactobacilli, a facultative anaerobic order, filled chart, with some slight beige representing the strict anaerobe order of Bacteroides. The number of samples between these two charts is vastly different. Chart C displays the profile of the biopsy of a transplant patient with an ileostomy. This chart is also almost fully Lactobacilli but has some Enterobacteria (light blue) and Bacteroides (beige). Chart D represents samples from transplant patients during transplant rejection, an ileostomy is still present. This chart resembles chart A the most, having slightly higher levels of strict anaerobes (beige and orange) and slightly less Enterobacteria (light blue). Chart E corresponds to the distribution of patients after their ileostomies were closed. Chart E looks distinctly dissimilar from A-D by contributing a vastly larger portion to strict anaerobic Clostridia (orange). While the Enterobacteria (light blue) and Bacteroides (beige) portions are larger as well, the portion presenting the strict anaerobic number clearly grew. Chart F represents data from a previous study’s table as a piechart for comparison purposes. It represents biopsies from six normal human ileums, no transplant, and no ileostomy. Compared to A where orange and beige are barely seen, the portions of the strict anaerobes, Clostridia (orange) and Bacteroides (beige), take up around 91% of the piechart while the facultative anaerobes Enterobacteria (light blue) and Lactobacilli (navy blue) only represent 9%.
Figure 3
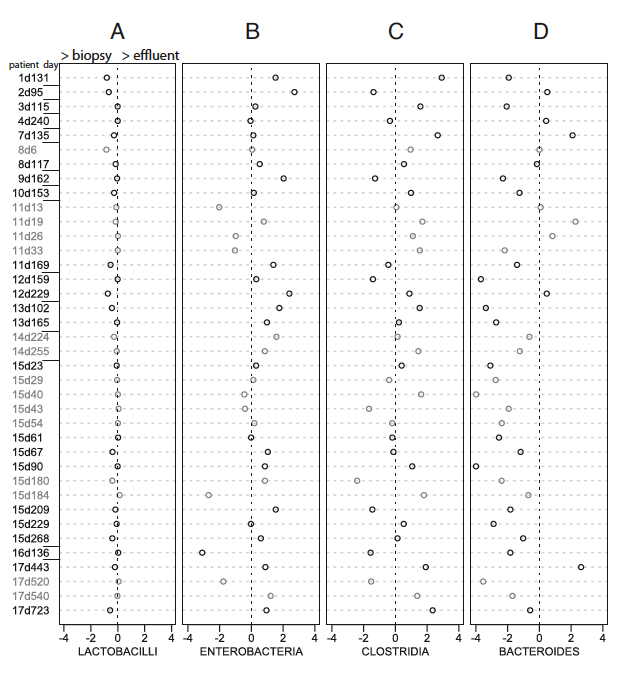
These charts are meant to compare the percentages of certain orders in effluent samples to their percentages in biopsy samples of the 17 SBT patients. Each chart has a bacterial order at the bottom. Along the y-axis, the samples are named around the patient number followed by a d and then the number of days post transplant. The x-axis stands as the log base 10 of the ratio of biopsy percentage to effluent percentage, therefore the positive side means there is more of that order in the effluent sample while the negative side means there is more of that order in the biopsy sample. Grey open circles are samples taken during a graft rejection while black open circles represent samples that are pathologically normal, not undergoing any immune system attack.
Figure 4
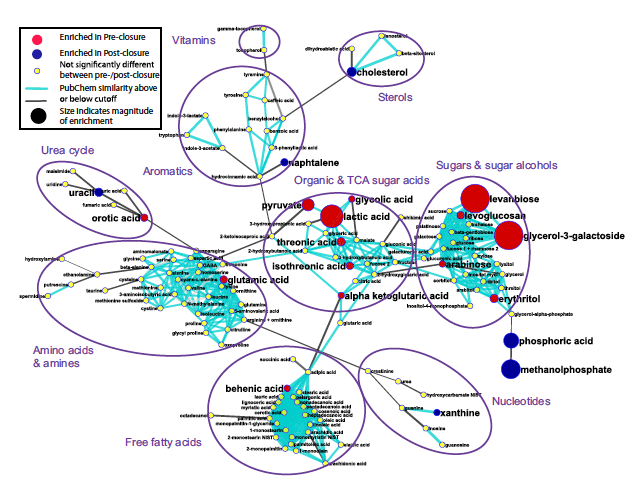
This figure shows a metabolomic network diagram of the 139 chemically identified metabolites found in preclosure and postclosure samples. Of the 139, 62 showed preference to either preclosure or postclosure. The red circles highlight those metabolites more represented in preclosure samples while the blue circles highlight those in postclosure samples. The yellow circles show where there was not a statistically significant preference. The lines are based on structural similarity. The size of the circles is proportional to how enriched the samples are with these metabolites in comparison. The lines are cyan blue if the similarity was above the high similarity threshold or gray if it was below and connected to the nearest possible neighbor.
Figure 5
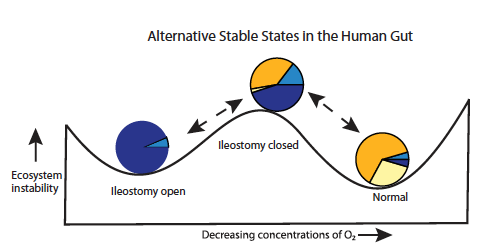
This figure looks at the different stable states post SBT and takes piecharts A, D and E from figure 2 and places them at appropriate places on a graph that shows the levels of ecosystem stability as concentrations of O2 decrease from left to right. There are high concentrations of O2 when an ileostomy is open and instability is relatively low; also the piechart is mostly blue (navy and light). As the ileostomy is closed, oxygen concentration does decrease but instability increases. The piechart becomes more orange, light blue and beige, with the greatest increase in orange. When the patient reverts to normal after the ileostomy has closed and oxygen levels are even lower, instability is at its lowest and the piechart is the least blue, more than 50% orange and more than 90% beige and orange. Navy blue and light blue represent facultative anaerobic bacteria while orange and beige represent strict anaerobic bacteria.
The four colors used to represent the four different orders were consistent throughout the figures.