This web page was produced as an assignment for an undergraduate course at Davidson College.
Analysis of Figures |
Conclusion and References |
|---|
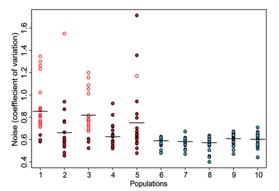
Figure 1:
(Freed, et al., 2008)
Figure 1 represents a visual comparison between the 5 experimental populations that underwent fluctuating selection, as described above, and the 5 control populations that represent the entire range of GFP fluorescence. The red dots represent the 5 selected or experimental populations and the blue dots represent the 5 control populations. The y-axis represents the phenotypic noise of the population, which was quantified by calculating a coefficient of variation in GFP expression. Therefore, each dot represents the coefficient of variation of GFP expression in thousands of cells transformed with a particular plasmid containing a promoter from S. Typhimurium. As you can see, the figure denotes that the control populations showed similar levels of variation in GFP expression and when compared to the selected populations, the control populations showed markedly less phenotypic variation (the horizontal lines represent the average GFP expression variation for that particular population). Hence, the figure indicates that the method created by the researchers actually does select for populations with promoters showing high phenotypic variation, also known as noise. The open circles indicate the promoter that showed the most phenotypic variation in GFP expression. The researchers identified that this particular promoter is associated with the fliC flagellar synthesis gene.
Figure 2:
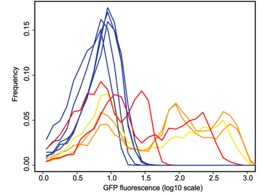
(Freed, et al., 2008)
Figure 2 illustrates another comparison between GFP variation for selected / experimental populations versus control populations. Each line represents the single clone from each population with the highest level of noise. The blue lines represent the control populations and the other colored lines represent the selected populations. The figure indicates that the control populations did not show much noise as compared to the selected populations. This can be seen because the control populations show a strong GFP expression frequency due to the uniform curved shape of all of the population lines. On the other hand the selected populations rigidly go up and down across a larger scale of GFP fluorescence, indicating more GFP expression variation within the population as measured by GFP fluorescence. Again, the most variable clone is indicated by orange, which represent the clone with the fliC promoter.
Figure 3:
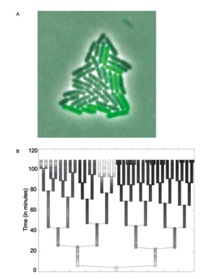
(Freed, et al., 2008)
Figure 3a is an image of microcolony representing the population containing the fliC promoter hybrid with the GFP reporter gene. The colony traces back 6 generation and indicates the variable expression levels of GFP expression over a specific time period, which is demonstrated by the varying shades of green fluorescence protein from GFP.
Figure 3b represents the lineage of the microcolony shown above as traced through 6 generations. The lineage tree also shows the changing GFP expression because light boxes indicate high levels of GFP and dark boxes indicate low levels of GFP expression. Each rod represents an individual cell, when that cell divides a new branch is formed. This lineage representation of the GFP expression as controlled by the fliC promoter visually illustrates populations grown from single cells rapidly begin to express varying levels of GFP. In fact even within a particular cell before division, GFP expression levels may change due to phenotypic noise, markedly variation in transcription and translation.
Overall figure 3 indicates that selected populations, this particular population representing the fliC promoter from S. Typhimurium, quickly achieve significant proportions of high and low GFP expression variation. The rapid variation in GFP indicated to the researchers that the variation observed via their method of measuring noise in different promoters was not due to phase variation, because phase variation takes time and many divisions until variation via recombination in GFP is seen in a lineage such as the one shown in 3b.