This web page was produced as an assignment for an undergraduate course at Davidson College.
Paper Review #2
"Synthetic Gene Networks that Count"
Friedland, et al., 2009
| Overview | Conclusions |
|---|
Figures:
Fig. 1. The RTC two-counter and RTC three-counter construct designs and results.
Friedland, et al., 2009
http://www.ncbi.nlm.nih.gov/pmc/articles/PMC2690711/
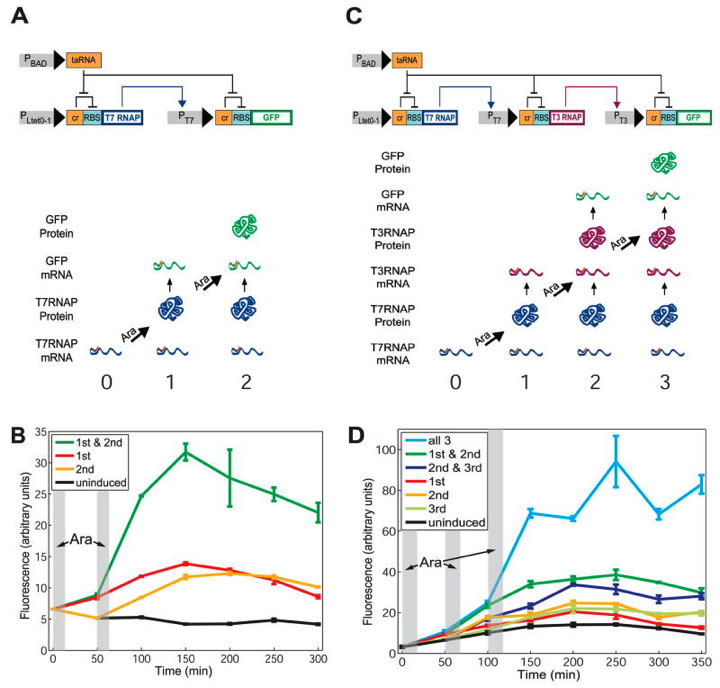
A) In the top half you see the RTC two-counter (it can count up to two) as a transcriptional cascade with two nodes (which could represent two genes, for example). PLtet0-1 induces transcription of T7 RNA polymerase (RNAP), which binds its protein to the T7 promoter (PT7), which then transcribes GFP, the downstream gene. Two riboregulators offer further regulation. One riboregulator represses posttranscriptional gene expression through a cis-acting element: cis-repressor (cr). This is located between the transcription start site and the ribosome-binding site (RBS); thus it can inhibit translation. The second riboregulator is taRNA, which serves to activate posttranscriptional gene expression through a trans-acting element. The arabinose promoter PBAD binds to the cis-repressor, thus enabling translation. These riboregulators imply that both nodes need independent transcription and translation in order to have protein expression.
In the bottom half you see the predicted expressions of T7RNAP mRNA, T7RNAP protein, GFP mRNA, and GFP protein after 0, 1, and 2 arabinose pulses. They expected expression to increase with more pulses. The cascade can count arabinose pulses because it expresses a different protein as a response to each different pulse. B) Here you see a graph showing the data that was predicted in the bottom half of part A. The lab used flow cytometry to measure the mean fluorescence of three replicates of RTC two-counter E. coli cell populations over the course of 300 minutes. The gray areas indicate the arabinose pulses, each with a duration of about ten minutes. The fairly flat black line represents fluorescence after no pulses, the red after 1 pulse, the yellow after just the 2nd pulse, and the green after the total of 2 pulses. There is much higher fluorescence after both pulses than after each pulse individually. The first pulse showed slightly higher fluorescence: it peaks at around 155 minutes with 14 and the second pulse peaks at around 200 minutes with 13. The lower levels of fluorescence in the individual pulses indicates leakage, meaning the intended protein was expressed in each pulse, but other unintended, downstream proteins were expressed as well. Increases in fluorescence begin after the second pulse. C) Here you see the same representation as in part A, only this time for the RTC three-counter (it can count up to three) with three nodes in the cascade. The top half shows the cascade, this time with the T7 RNAP inducing PT7, which induces PT3, which induces GFP transcription. Similar predictions to part A are made in the bottom half, only this time with three arabinose pulses. D) Here you see the same representation as in part B, but this time for the RTC three-counter. The gray areas again represent the three arabinose pulses of about 10 minutes and each colored line represents fluorescence after a certain pulse number or combined pulse numbers. Two pulses combined show slightly higher fluorescence than individual pulses, and all three pulses demonstrate a large increase in fluorescence. Increases in fluorescence begin after the third pulse, demonstrating how RNA progresses over time.
Fig. 2. Modeling predictions and RTC three-counter experimental characterization.
Friedland, et al., 2009
http://www.ncbi.nlm.nih.gov/pmc/articles/PMC2690711/
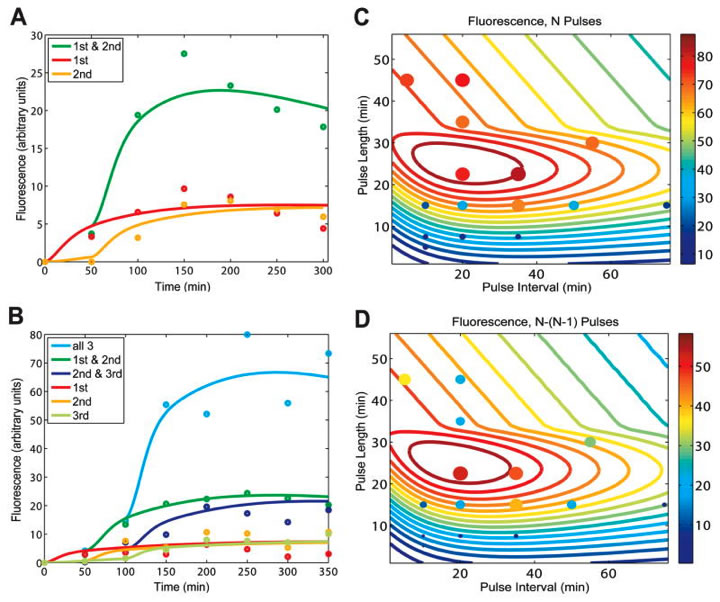
A) Here the lab normalized the fluorescence results of the RTC two-counter in Figure 1, and constructed a mathematical model with fitted parameters based on the most important characteristics of this normalized data. You can see pulse 1 and pulse 2 with lower fluorescence over time and pulses 1 and 2 together, with a much higher fluorescence over time. The pulses and their durations are not shown here. B) Just as part A showed a mathematical model for the data in Figure 1 part B, here you see a mathematical model for the data in Figure 1 part D. C) The lab used the model in part B to analyze how the performance of the RTC three-counter (N pulses) changed based on changes in pulse frequency and pulse length, in hopes of determining an ideal combination. This graph shows contour lines, which indicate that the highest expression occurs with pulse lengths of about 20-30 minutes and pulse frequencies of about 10-40 minutes. The color-coded bar to the right indicates expression levels. The dots represent the experimental data, showing expression levels based on color and size. The large, dark red dot indicates the highest level of expression in the data, at about 37 minutes for pulse interval and about 23 minutes for pulse length. D) Here you see the same representation in part C for the RTC three-counter, only this time it is the difference between N pulses (3) and N-1 pulses (2). Thus you can observe the conditions for the greatest changes in expression levels from the second pulse to the third pulse.
Overall, the experimental results are consistent with the models. However, you can see in parts C and D that with very high or very low pulse lengths/frequencies, the RTC three-counter’s counting is less reliable. The lab relates this drawback to the kinetic limits within the biochemical processes involved (i.e. transcription and mRNA degradation).
Fig. 3. The single-inducer DIC three-counter construct design and results.
Friedland, et al., 2009
http://www.ncbi.nlm.nih.gov/pmc/articles/PMC2690711/
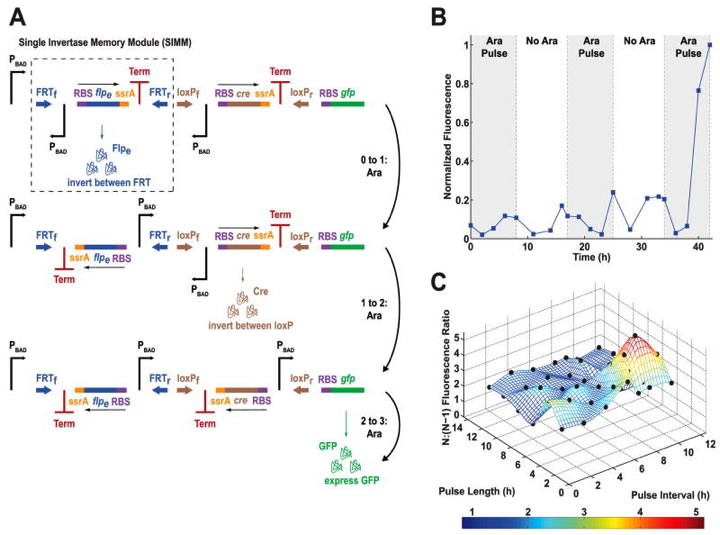
A) Here you see the single-inducer DIC three-counter, which was constructed by chaining modular DNA-based counting units together, and the cascades affected by three arabinose pulses. Such units are called single invertase memory modules (SIMMs), made up of recombinases, inverted promoters, ssrA tags, and transcriptional terminators. This counter is made up of two SIMMs, the first being outlined by the dashed box. Arabinose pulses serve as inputs to the circuit via PBAD promoters. Each pulse induces a promoter, which induces recombinase expression, which inverts the SIMM containing it. Therefore, the inverted promoter can now induce the second SIMM stage in the cascade. B) Here you see normalized fluorescence of the single-inducer DIC three-counter over a time course of 40 hours, including three arabinose pulses lasting just short of ten minutes each. The first two pulses each show a slight decrease in fluorescence followed by a slight increase in fluorescence, but the third pulse shows a much greater increase in fluorescence. The lab attributed the low fluorescence with the first two pulses with leakage, due to a premature inversion of the Cre recombinase-based SIMM. This leakage is minimal, however, when compared to the magnitude of expression after three pulses. C) This 3D plot graph shows the effects of time on the ratio of fluorescence between the three-counter (N) and the two-counter (N-1); the lab experimented with varied pulse lengths and intervals to determine the optimal temporal conditions (again, the color scale at the bottom indicates fluorescence levels). The black dots represent experimental results. The majority of the data indicate ratios of 1.5 or greater, demonstrating higher fluorescence with the three-counter and three arabinose pulses between 2 and 12 hours of pulse length and interval.
Fig. 4. The multiple-inducer DIC three-counter construct design and results.
Friedland, et al., 2009
http://www.ncbi.nlm.nih.gov/pmc/articles/PMC2690711/
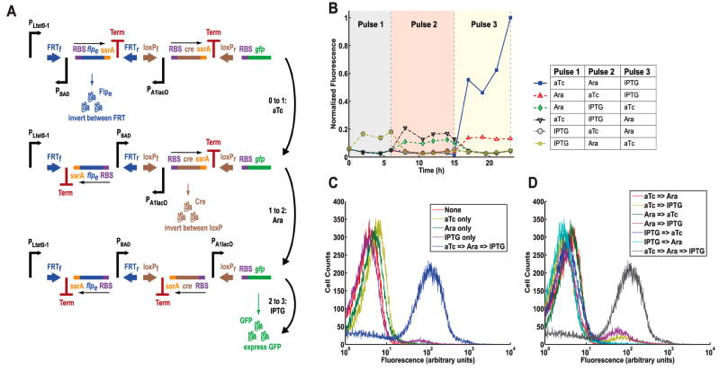
A) This figure is similar to figure 3 part A, only this time showing a multiple-inducer DIC three-counter instead of a single-inducer DIC three-counter. This multiple-inducer counter utilizes not only the promoter PBAD, but also PLtet0-1 and PA1lacO. PLtet0-1 responds to anhydrotetracycline (aTc), PBAD responds to arabinose as before, and PA1lacO responds to IPTG. B) This graph shows the mean fluorescence of multiple-inducer DIC three-counter cell populations over the course of 25 hours and three consecutive pulses. High output of GFP was only observed after exposure to aTc, then arabinose, then IPTG. Other combinations were not successful. C) This graph plots flow cytometry data: cell counts versus fluorescence. Data is shown for the desired order of the three inducers for the multiple-inducer DIC three-counter, as well as for each individual inducer. The optimality of the desired sequence is observable due to the separated blue curve. Thus, the circuit can only be programmed to record a desired sequence of events. D) This plot shows the same data as in part C, but sequences of inducers other than the most desired sequence are also included. Again, the desirability of the desired sequence is clear with the curve separated to the right.
References
Friedland AE, Lu TK, Wang X, Shi D, Church G, and Collins JJ. Synthetic Gene Networks that Count. Science [Internet]. 2009 May 29 [cited 2011 April 20];324(5931): 1199-1202. Available from: http://www.ncbi.nlm.nih.gov/pmc/articles/PMC2690711/
*Note: All citable information was taken from this original paper.
Genomics Page
Biology Home Page
Email Questions or Comments.
© Copyright 2011 Department of Biology, Davidson College, Davidson, NC 28035