
image: iStockPhoto
This web page was produced as an assignment for an undergraduate
course at Davidson College.
image: iStockPhoto
D. Benjamin Riffe's Genomics Web Page
Home Schizophrenia Paper Review #1 Paper Review #2
Synthetic Gene Networks That Count
Friedland et al., 2009
In the world of computer science, as well as in the cellular context of telomere length and cell aggregation, counting and its representation as a distinct state are essential to normal functioning. Unlike in computer programing or circuit production, in the cellular counting mechanism thresholds or concentration of molecules make up the distinct state. Friedland et al. attempt to create a counting mechanism within E. coli, with the potential and long-term goal of synthetic programing for biotechnology applications.
Initially, two riboregulated transcriptional cascade (RTC) counters were developed. The RTC two-counter and TRC three-counter use transcriptional regulation and cascades. For the RTC two-counter, PLtet-1 leads to transcription of T7 RNA polymerase, which transcribes the green florescent protein after binding to its upstream promoter (PT7). This counter has addition regulation through riboregulators, which function both as cis and trans-acting mechanisms. The cis-acting mechanism of the riboregulator prevents translation by binding directly downstream of its coding sequence sequence, causing a stem loop and preventing the 30S ribosomal subunit from attaching to the ribosomal binding site (RBS). For the trans acting mechanism, an arabinose promoter (PBAD) constructs a taRNA, which binds to the cis inhibitor RNA and inhibits the cis inhibitor, allowing the ribosome to bind and translate. These riboregulators are found between each RNAP or GFP and their respective promoters.
The RTC two-counter functions via the riboregulation such that brief pulses of arabinose induce a different response in the cell, with the cell producing T7 RNAP after the first pulse and GFP after the second. The first pulse inhibits all cis inhibitor RNAs through the transcribed taRNAs and T7 RNAP is produced. Very little GFP is transcribed, as the cis inhibitor quickly binds to the RBS upstream of GFP again after the taRNAs are quickly degraded. T7 RNAP remains in the cell, and the next arabinose pulse represses the cis inhibitor RNA, and GFP is produced with this second pulse.
This RTC two-counter was inserted into E. coli strain K-12pro through a high-copy plasmid. Experimental data was taken from the transformed cells, showing non-pulsed cells produced no GFP, cells that received only the first or second arabinose pulses produced minimal levels of GFP, and cells that received both pulses produced high levels of GFP after the second pulse. Minimal levels of GFP were produced in the single pulse conditions due to the leaky nature of the counter.
The authors then constructed the RTC three-counter by inserting a third node. The RTC three-counter is composed of the T7 RNAP, which then transcribes T3 RNAP, which finally transcribes GFP for expression. Each transcript contains the same cr and RBS of the RTC two-counter. Experimental data showed that GFP had significant levels of production only after three pulses of arabinose confirmed by flow cytometry data. Leaky levels of GFP were produced after one or two pulses and no GFP was produced in the non-pulse condition.
The authors then wrote mathematical models to reproduce the results from the pulse data and to determine the properties of frequency and duration of pulses on counting. The model indicated 20 to 30 minute pulse lengths and 10 to 40 minute intervals, with similar lengths and frequencies for the two and three RTC counters. This model was tested experimentally though various frequencies and duration of pulses for both RTC counters. The results were consistent with the model, with special note given to the large range of frequencies and durations the pulses can be applied with counting still functioning, the limits of which are determined by mRNA transcription and degradation.
And additional single-inducer counter was engineered, labeled the DNA invertase cascade (DIC) counter. The principle of this cascade is as follows; Recombinases, which invert DNA, are placed downstream of an inverted promoter and are attached to a degradation tag (ssrA) and transcription terminator (Term). The SIMM, or single invertase memory module, contains this whole sequence placed between reverse recombination recognition sites. When a particular recombinase is activated, the RBS, next recombinase gene, ssrA and Term are flipped. The final SIMM contains GFP.
Utilizing a pBAC plasmid and the only the PBAD (arabinose promoter), a DIC two-counter or a DIC three-counter transformed E. coli cells. With each pulse of arabinose, the next SIMM becomes inverted, such that the promoter for that SIMM is correctly orientated to for expression of the subsequent SIMM. Experimental data show that some leakage of GFP occurs in the DIC three-counter after one arabinose pulse, but that the 3 pulse condition is significant higher. The effects on counting of duration and frequency of pulses were determined experimentally, showing correct response of frequency and duration of 2 to 12 hours.
The authors constructed a second type of DIC three-counter, the PBAD of which were replaced in order with PLtet0-1 induced by aTc, PBAD induced by arabinose, and PA1lacO induced by isopropyl β-D-1-thiogalactopyranoside (IPTG). Experimental data show that only exposing the cells to aTc, then arabinose, and finally IPTG in this order produced the high output of GFP.
The authors end the paper by explaining the importance of their different architectures for the counters. The RTC counters work quickly in the range of one cell division, whereas the DIC counters work on the scale of hours, but with high levels of state retention due to the inverted SIMMs. Additionally, the authors believe that these counters could be extended beyond 3 states, using similar techniques. Finally, this work is put in the larger context of providing new tools and cell processes to bioengineers for potential applications. For example, RTC counters could program apoptosis as a safety protocol for new biomedication. DIC counters could record longer-term cascades and SIMM could record neural circuits.
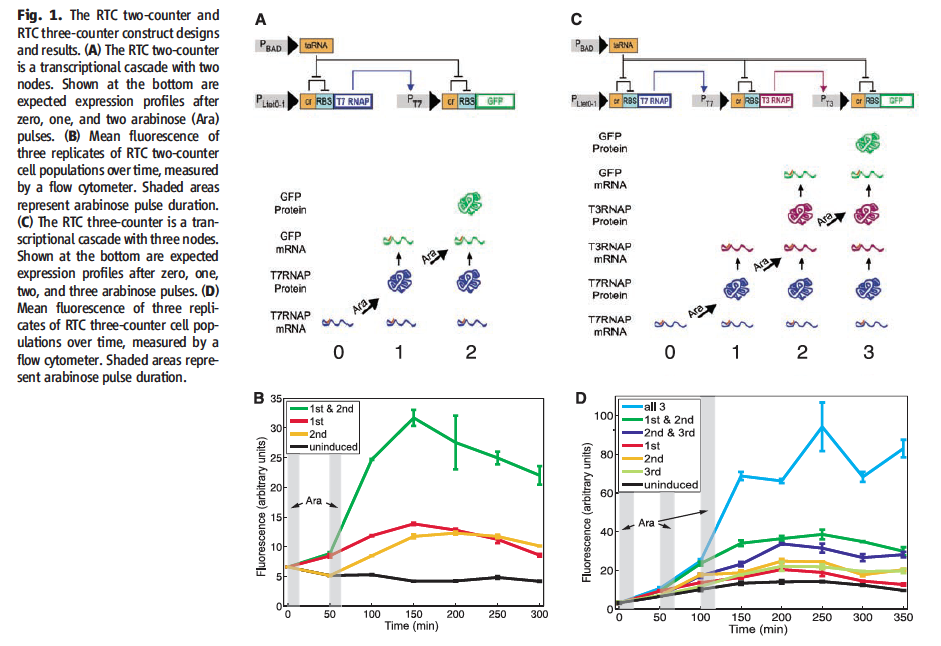
Figure 1† displays diagrams of the RTC counters as well as experimental data confirming the RTC counter design. Section A is a diagram of the RTC two-counter. The top half shows how PBAD codes taRNA, which inhibits the cis repressor, and allows the PLtet0-1 driven T7 RNAP to be produced. The second node is driven by the T7 promoter and the taRNA is shown to inhibit the second cis repressor, which allows the RBS to become active and for GFP to be produced. Below, the expected expression profiles for the given arabinose pulse are shown. For pulse 0, only little T7RNAP mRNA is available, after the first pulse, T7 RNAP protein present with minimal GFP mRNA. With the second pulse, the T7 RNAP protein continues to drive the production of GFP mRNA and GFP protein is produced. Section B is the experimental data from E. coli transformed with the RTC two-counter. Fluorescence (Y-axis) is graphed against time (X-axis). The cells were exposed to 4 different arabinose pulse conditions. The time of the potential arabinose pulse are shown at 0 and 50 minutes. The green line represents cells receiving the first and second ara pulses and shows a small increase in fluorescence after the first pulse and a very large increase in GFP production after the second. The red and yellow lines represent the first and second pulse conditions respectively, showing small fluorescence after their respective ara pulses, consistent with leakage, but no large change in fluorescence. The black line represents the uninduced condition, with no change in fluorescence. These results are consistent with the model. Section C diagrams the RTC three-counter. The design is identical to the RTC two-counter until the second node, where the T7 promoter drives T3 RNAP after the second ara pulse inhibits the cis repressor. With the third ara pulse, the cis repressor repressing the third node become free in the presence of the T3 RNAP protein, which drives translation of GFP. The lower part of the diagram shows the presence of mRNA and proteins after each ara pulse in the same manor as Fig. 1 A. At pulse 0, only T7 RNAP mRNA is present. At pulse 1, T7 RNAP protein and T3 RNAP mRNA also become present, followed by the addition of T3 protein and GFP mRNA after the second pulse. The third pulse has GFP protein present. Section D is the experimental data from transformed E. coli with the RTC three-counter under different ara pulse conditions showing fluorescence over time. The times of the potential ara pulses at 0, 50 and 100 minutes are shown The blue line represents the cells receiving all 3 pulses, which show a very large increase in fluorescence after the third pulse. The green, purple, orange, green and red lines represent cells receiving only 1 or 2 pulses and all permutations of time. None show large increases in fluorescence, only expected leakage. The black line is uninduced, and no change in fluorescence is observed. This is consistent with the model.
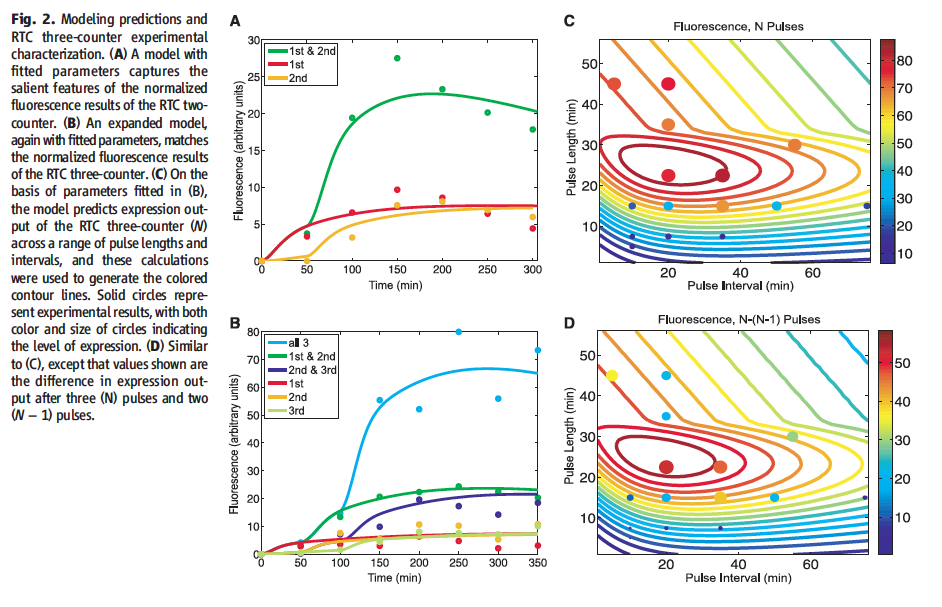
Figure 2† shows the modeling prediction of RTC counters as well as frequency and duration effects. Section A models the RTC two-counter graphing fluorescence against time. This displays two pulse condition in green, which shows high fluorescence after the second pulse at 50 min. The red and yellow lines represent the first or second pulse conditions, respectively, and show only small rise in fluorescence after their respective pulses. This model is consistent with the experimental data from Fig. 1 B. Section B models the RTC three-counter graphing fluorescence against time. The blue line represent the three pulse condition, which shows a large increase in fluorescence after the third ara pulse at 100 minutes. The remaining lines represent the outstanding permutation of pulse conditions. Only leakage levels of fluorescence are shown, consistent with the experimental data from Fig. 1 D. Section C models expression output (indicated by the color scale) by pulse length (X-axis) and pulse interval (Y-axis) for the RTC three-counter. Dots represent data from experimental results, with color and size correlating to expression and follow the scale on the right. This shows the optimal range for pulse frequency and duration to be 10 to 40 min and 20 to 30 min, respectively. Section D is a nearly identical graph to Fig. 2 C, with values consisting of expression after three pulses minus expression after two pulses, giving the same optimal range of frequency and duration.
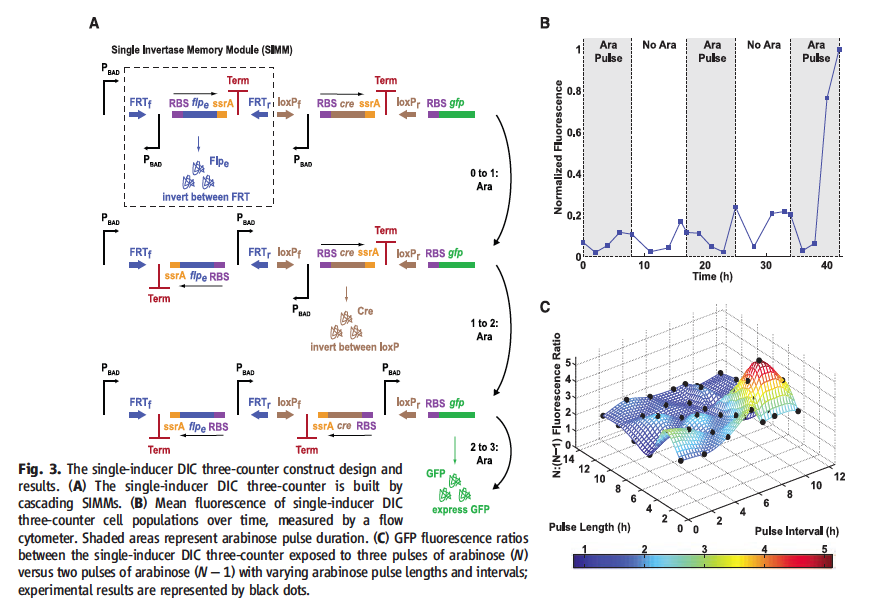
Figure 3† displays the single inducer DIC three-counter and experimental data confirming the model. Section A diagrams the DIC three-counter. The PBAD is show driving the first SIMM. The SIMM is composed of recombination sites on either end. On the left end is a PBAD, which is inverted such that it doesn’t promote. Moving from left to right after the inverted PBAD of the SIM, there is a RBS, recombinase gene unique to that SIMM’s recombination sites, ssrA for quick degradation, and Term. The initial SIMM’s recombinase is promoted by the first PBAD in an ara pulse. The recombinase produced then inverts the SIMM such that the inverted PBAD now faces the second SIMM. The second SIMM is built the same with unique recombinase and then produces its unique recombinase for its recombination sites during the second ara pulse. This inverts the sequence, which places its inverted PBAD toward the third node. The third ara wave is then shown to activate the PBAD, which drives translation of GFP. Section B graphs the experimental data. Normalized fluorescence is graphed over 40 hours with 7 hour ara pulses shown at time (hour) 0, 15 and 34. There is some noise through the first two ara pulses, but after the third ara pulse, high GFP output was exhibited. This is consistent with the DIC three-counter model. Section C models GFP fluorescence ratios of the single inducer DIC three-counter under the condition of three ara pulses (N) to two ara pulses (N-1). Pulses length and pulse interval are graphed (X and Y-axis) are graphed against N:(N-1). Height and color according to the bottom scale indicated fluorescence ratios. Experimental data points are place on the graph as black dots. This shows that successful counting is found in length and interval conditions of 2 to 12 hours.
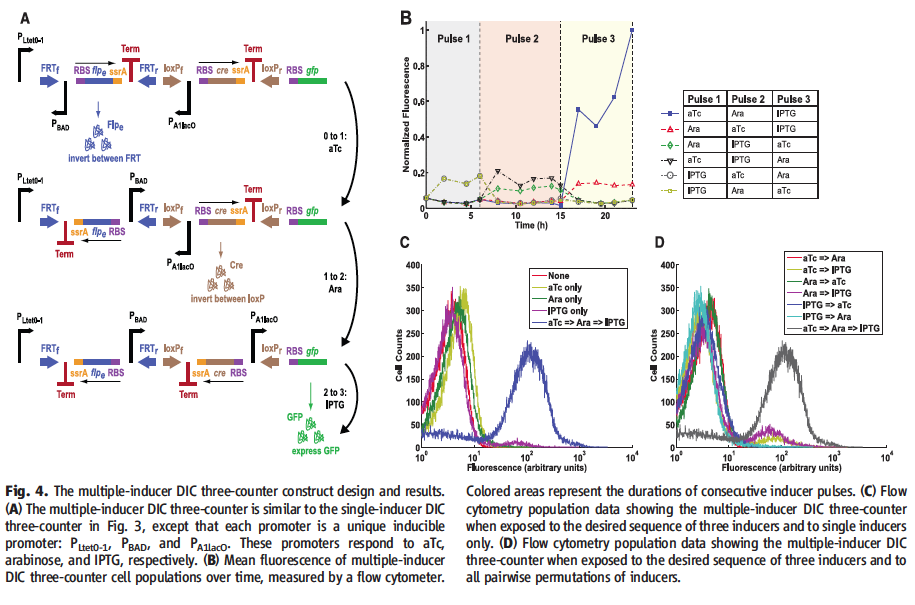
Figure 4† displays the multiple-inducer DIC three-counter and experimental results. Section A diagrams the multiple-inducer DIC three counter. The design is identical to the single inducer DIC three-counter in Fig. 3 A, with differences in the promoters. The first PBAD was replaced with PLtet0-1, activated by aTc, the second PBAD remained the same and the third was replaced by PA1lacO, activated by IPTG. Each promoter is now uniquely induced, which should mean that the precise order of aTc followed by arabinose finally followed by IPTG for counting to occur and GFP to be produced. Section B graphs normalized fluorescence over 24 hours for transformed cells three pulses from time 0 to 6, 6 to 15 and 15 to 24. The inducers for each pulse were varied for each trail, but consisted of aTc, ara, or IPTG for a given pulse. Cells exposed to aTc for the first pulse, ara for the second, and IPTG for the third showed high GFP output. All other conditions showed no change beyond background leakage. Section C shows flow cytometry data of cell populations under the multiple-inducer DIC three-counter. Cell counts are graphed against fluorescence, showing that the majority of cells exposed to aTc then ara and finally IPTG, represented by the blue line, were two units on a log scale more fluorescent than cells exposed to no inducer or any one inducer. Section D graphs the multiple-inducer DIC three-counter under a number of two-inducer conditions and the aTc to ara to IPTG condition. The majority of cells exposed to only two inducers have very low levels of fluorescence, while the majority cells exposed to aTc, ara and IPTG, in that order, (graphed in gray) are two units on a log10 scale more fluorescent than all other conditions.
Conclusions about the paper
The authors cleverly designed synthetic networks to emulate and function as computer programming and circuit counters. Using known and understood mechanisms, such as taRNA, cis and trans repressors, recombinase and degradation tags, the authors constructed novel systems that can “remember” inputs over both a short and long term timeframe. It is also noteworthy that a within the DIC counter, a second important component, the SIMM, has application beyond the DIC counter.
The authors also wrote programs to model the cellular response with the RTC and DIC counter and confirmed these models with their experimental data, rather than letting the model change the importance of the data itself, which is a known problem when designing models. These were used to model the general response of the RTC and DIC counter as well as the effects of pulse intervals and length on cellular response. Their thoroughness is appreciated. Importantly, the authors were then able to take theses models and make predictions about the whole range of robustness for their synthetic networks.
The conclusions of this paper impressed upon me the relevance of synthetic biology research. Constructing these synthetic circuits allows researchers to retest and examine our understanding of various cellular components and interactions. It is also impressive that we can manipulate these individual parts to interact in a predicted matter and that we can confirm these interactions. What is most relevant about this research is not simply to create a novel cellular circuit, but rather to expand the toolbox of bioengineers. The authors explain the applicability of these counters and SIMM for biosensing, bioremediation and medicine. These circuits have their own important potential functions and can be placed into larger synthetic pathways, expanding our ability to manipulate and understand cells.
†All figures from Friedland et al., 2009.
Works Cited
Friedland AE, Lu TK, Wang X, Shi D, Church G, Collins JJ. Synthetic Gene Networks That Count. Science. 2009;324:1199-1202.
Genomics Page
Biology Home Page
beriffe@davidson.edu
Email Questions or Comments.
© Copyright 2011 Department of Biology, Davidson College, Davidson, NC 28035