![]()


![]()

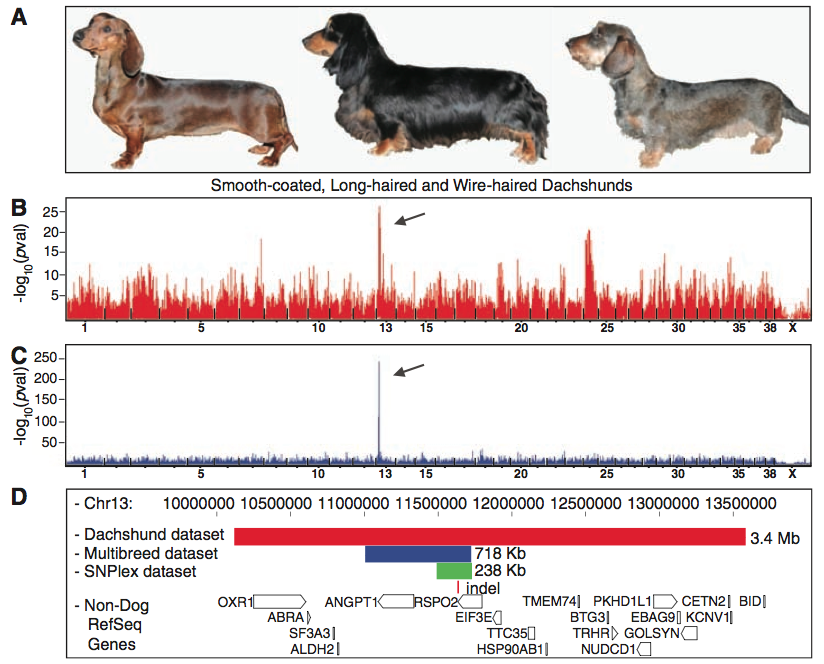
In sum, figure one shows the results of the GWAS and fine mapping methods Cadieu et al. used to home in on the RSPO2 gene associated with furnishings. Panel A simply provides a visual of the three different dachshund coat types, which they included to demonstrate the phenotypic differences between the two controls (middle and left) and the case (wire-haired) used for the dachshund-only GWAS. Panel B shows the data from this GWAS. The highest peak denotes the most significant lod score (a means of linkage comparison), which represents the region most significantly associated with the case (furnishing) phenotype. The scale on the bottom shows this spike lies within chromosome 13. Panel C shows the data from the CanMap GWAS, which segregeated the furnishing phenotype in additional breeds than dachshunds. Again, the (significantly) highest peak is located at chromosome 13, thus helping confirm this is the region most highly associated with the furnishing phenotype and therefore likely plays a role in its expression. In addition, you can see the CanMap GWAS is much "cleaner," or devoid of all the extra peaks found in B. This is because the CanMap GWAS helped eliminate all the false positives due to population structure in the dachsund-only GWAS, and thus it stengthens the researchers' assertion that this region is associated with furnishings. Panel D shows the haplotypes identified with three different data sets, with the red bar representing the dachshund-only data set, the blue bar representing the CanMap set, and the green bar representing a homozygous region they identified in 18 furnishing-bearing breeds via fine mapping. All three datasets shared one indel, denoted by the red line underneath, which they found lies within the RSPO2 gene, depicted by the open box. Taken together, figure one provides a visual of the process Cadieu et al. used to identify the insertion responsible for furnishings in dachshunds. This figure offers very strong evdience in support of their conclusion that a specific mutation in RSPO2 leads to furnishings in some dogs.
![]()

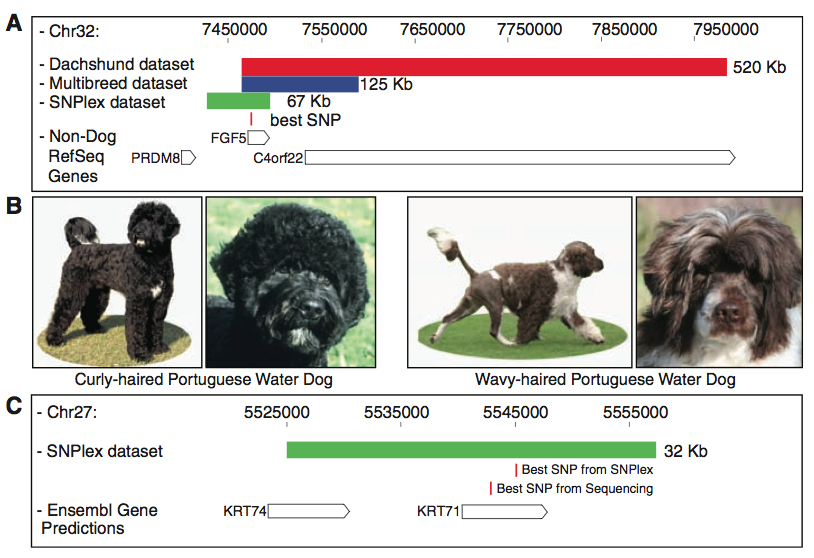
Figure two includes the homozygous regions identifiend by different data sets for both the hair length and curl association studies. Panel A depicts the mapping of FGF5, a gene they found is associated with long hair. Again, the red bar represents the dachshund data set, and the blue bar represents the CanMap data set, and the green bar represents the more-defined homozygous region resulting from fine-mapping of 39 long-haired breeds. The red line indicates the SNP that was the most highly associated with these three datasets, which also lies within the FGF5 gene. Therefore, as seen with figure one, this panel provides a visual of the mapping and sequence comparisons the researchers made that led them to associate FGF5 with the long-hair phenotype. Panel B provides a comparison of the two phenotypes of portugueses water dogs (PWDs). Besides the cuteness factor, we see a distinct difference in their coats, which is important for their identification of the curly locus. Lastly, Panel C provides a visual of the association mapping the researchers performed to home in on the curly haired gene. The green bar depicts the homozygous haplotype of dogs from five curly haired breeds determined by fine mapping. As you can see, the two data sets they used for the GWAS (for which the lod-score graphs are not shown) yielded different--albeit close in proximiy--SNPs, both of which lie within the gene KRT71 (CanMap data set is the top SNP, PWDs-only data set is the below SNP). Based on the text and this figure, my best interpretation of this finding is that PWDs carry an additional SNP within the KRT71 gene that allows them to have either curly (the across-breed SNP) or wavy coats.
![]()

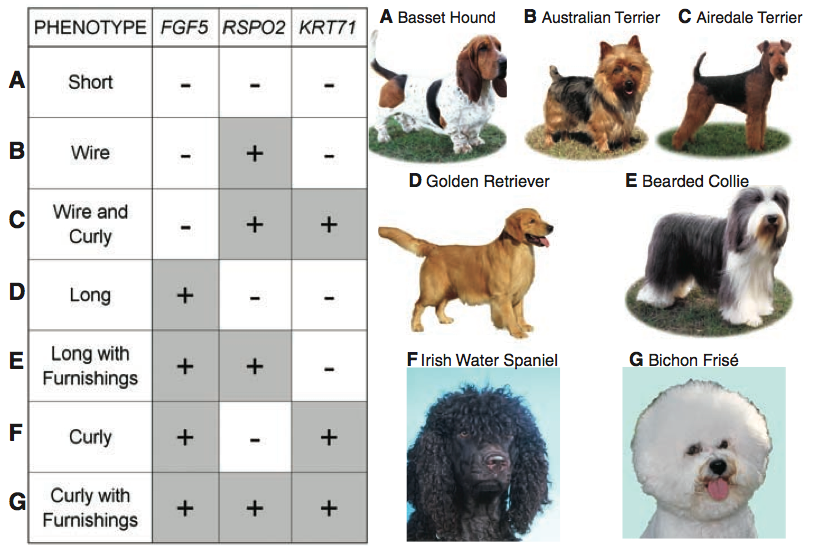
Figure three demonstrates how mixing the combinations of alleles of these three aspects of coat type leads to seven distinct coat phenotypes, which Cadieu et al. explain represent most of the coat variation observed in dogs today. The plus signs (+) indicate variations (the aformentioned changes in sequence) in the gene, while the minus signs (-) indicate the presence of the ancestral allele. The letters to the left of the chart correspond with those next to the names and photos of different breeds, thus demonstrating what each allelic combination gives rise to. It's pretty crazy how these three genes can induce such disparate phenotypes. For example, compare the coat of A (Basset Hound; all -) with G (Bichon Frise; all +). Very different dogs. I think this is super cool.
Next: Conclusions
![]()
Email questions or comments to kaswart@davidson.edu
© Copyright 2011 Department of Biology, Davidson College, Davidson, NC 28035