
http://uncyclopedia.wikia.com/wiki/File:Cup-of-coffee.jpg
Gene Assignment 1-Kindness Gene
Gene Assignment 2 - Genes Associated with Habitual Caffeine Consumption
http://uncyclopedia.wikia.com/wiki/File:Cup-of-coffee.jpg
This webpage is a summary of what I learned upon reading the article entitled: Genome-Wide Meta-Analysis Identifies Regions on 7p21 (AHR) and 15q24 (CYP1A2) As Determinants of Habitual Caffeine Consumption by Cornelis et al. As you will see, the researchers performed a meta-analysis of the genomes of individuals from multiple studies in order to identify SNPs associated with the habitual consumption of caffeine. The SNPs that were strongly correlated with elevated caffeine consumption were then used to propose two candidate genes responsible for the association. Identifying the genes responsible for a behavioral characteristic, such as habitual caffeine or tobacco use, is extremely difficult as the habit is affected by societal, behavioral, and genetic factors. Therefore, it is difficult to accept the conclusion that these two genes alone are responsible for habitual caffeine consumption. The fact that the two SNPs only account for 0.06 and 0.72% of the variation suggest that other genes or epigenetics may play a role in the habitual consumption of caffeine. I am convinced that the two candidate genes mentioned, CYP1A2 and AHR, are associated with the habitual consumption of caffeine as they are significantly associated at the SNP and gene levels according to meta-analysis and their products are involved in caffeine metabolism. However, there were three other SNPs and three other genes significantly associated with the habitual consumption of caffeine. The addition of these SNPs and genes may increase the percentage of variance that can be detected. I disagree with their reasons for eliminating ADORA2A, CYP2C9 and CYP1A1 as candidate genes and am surprised that they do not even mention some of the other genes and SNPs found to be significant.
In general, I had some difficulty understanding most of the statistical techniques. I would have appreciated better explanation of the techniques and figures and would have liked more information regarding their reasoning for discounting certain genes as candidates. The paper contained very little explanation of the logic supporting a lot of the decisions made. One would think that the addition of more genes and SNPs into a diagnostic test for a condition such as habitual caffeine consumption would increase the amount of variance accounted for. The study would be improve if the authors calculated the amount of variance accounted for with the inclusion of some of the others SNPs and genes found in table 2 and 4, respectively. In general, it is important to remember that genetics is complicated and caution should be taken when trying to identify genes for a particular condition. Therefore, I am comfortable stating that CYP1A2 and AHR are candidate genes but they are not the only factors contributing to the habitual consumption of caffeine. I am more cautious regarding the classification of CYP1A2 as a candidate gene, as CYP1A1 and CYP1A2 could both be represented by the same SNP.Every morning many people consume caffeine in the form of an enjoyable cup of coffee or tea. In addition to being a common molecule, as 90% of adults worldwide regularly consume products containing caffeine, it may have both positive and negative health effects (Cornelis et al., 2011). According to one study, the average caffeine consumer eats or drinks 193 mg of caffeine per day, which is 1.2 mg of caffeine per kilogram of body weight per day (Frary et al., 2005). The effect of caffeine on health is unclear, however some promising studies suggest it may play a positive role in patients with Alzheimer’s disease (Arendash and Cao, 2010) and Parkinson’s disease (Tan et al., 2007). In mice, caffeine consumption (equivalent of 5 cups of coffee per day) was found to protect against and treat Alzheimer’s disease (Arendash and Cao, 2010). Another study concluded that there was a significant association between caffeine intake and the development of Parkinson’s disease as individuals who consume a large amount of caffeine had a decreased chance of developing Parkinson’s disease compared to moderate drinkers (Tan et al., 2007). Many non-genetic factors influence an individual’s caffeine consumption but recent twin studies have suggested a possible genetic component. The heritability estimates based upon multiple twin studies are between 43 and 58% (Cornelis et al., 2011), which is significant enough to motivate investigation of this component. Given the popularity of caffeine and its connection to human health, the genetic component of caffeine is an important area of study. If the genes associated with habitual caffeine consumption are identified, they can be used to increase our understanding of the associated proteins and provide insight into the metabolism of this important compound and help explain its association with many health conditions.
Cornelis et al. used a genome-wide association study (GWAS) involving 47,341 individuals (~2.5 million SNPs per person) of European decent from five population-based studies in the United States (Cornelis et al., 2011). The large amount of individuals involved in the study results in high statistical power and strengths the validity of the results. The use of data from five different studies adds to the ability to make cautious generalizations regarding the results. A concern with using information from previous studies is that there might be a limited amount of genetic variation between the subjects, especially if the data being used comes from an experiment involving a condition with a strong genetic component. The researchers use five moderately different studies as their source of genetic data in order to ensure variation among the subjects and carefully control their study population to ensure that no underlying conditions other than caffeine consumption can be the cause of any observed genetic variation. A GWAS focuses on the variation at single nucleotide polymorphisms (SNPs) among individuals who do and do not display the habit or condition being studied in order to determine if variation in the human genome is associated with the particular phenotype, such as increased caffeine consumption (GWAS FAQ). The information gathered from these studies will allow for a better understanding of societal health needs and lead to new techniques and strategies for prevention, diagnosis, and treatment of many common diseases, such as diabetes or heart disease (GWAS FAQ). GWAS is a proven technique for experiments investigating the genetic factors underlying a behavior, as it was used to locate loci associated to tobacco use (Cornelis et al., 2011).
The experiment was a meta-analysis that had stratification factors of age, gender, smoking habit, and an eigenvector of population variation (Table 1) (Cornelis et al., 2011). Meta-analysis is a statistical method used to combine the results of multiple experiments retrospectively (Crombie and Davies, 2009). These stratification factors were chosen as each could affect the consumption of caffeine. By controlling for these factors the researchers were able to conclude that any difference in caffeine consumption could be attributed to genetic factors. In order to confirm that the correct stratification factors were assigned, the research group calculated the study-level genomic inflation factor to be 1.00 to 1.03, which indicates that the stratification factors chosen properly represent the population (Cornelis et al., 2011). A genomic inflation factor close to 1.0 means that the population being studied is well controlled, which is unusual for a large GWAS using meta-analysis as these studies often have higher genomic inflation factors, such as 1.42 for some studies involving many subjects (Yang et al., 2011).
Caffeine consumption was determined from a semi-quantitative food frequency questionnaire (FFQ) that addressed the use of caffeinated coffee, tea, soft drinks, and chocolate (Cornelis et al., 2011). Questionnaires and surveys are poor methods of gathering data because they include a lot of bias, as the subject could easy over or under estimate their actually amount of consumption. One could imagine a situation where a subject is more likely to put an amount that is closer to their desires than it is to reality. That being said there is unfortunately no better way of acquiring this data, however one must be aware of the bias included in the survey data. Although the FFQ only includes four items it is a good representation of caffeine consumption, as according to a study involving 15,716 caffeine consumers 71% drank coffee, 16% drank soft drinks, and 12% drank tea (Frary et al., 2005). These statistics indicate that these four items were sufficient in order to establish which individuals habitually consumed caffeine. The FFQs used for the study were from 1984, 1986, 1987, 1989, 1990, 1991, and between 1992-2001, which should not really affect the applicability of the results of this study as variation determined from 20 year old data should still be valid today. However, given that the caffeine consumption is increasing overall throughout the population over the years (Frary et al., 2005), there may be some variation in caffeine consumption between the study groups that is due to the use of data from a 17 year span and not purely genetic factors. When calculating the milligrams consumed from the FFQ, the researchers assumed, for example that each cup of coffee contains 137 mg of caffeine (Cornelis et al., 2011). Of course this cannot be true as coffee comes in various styles and sizes that would affect the amount of caffeine actually consumed by the individuals of each study. However, even if it is not a particularly strong assumption, it seems like a necessary one. Most of these criticisms effect minor results of the study and are not meant to suggest that the overall conclusions are not valid.
Table 1. Characteristics of the study subjects. The point of this table is to display the diversity of the test subjects. Having a diverse subject pool allows the researchers to make general conclusions. The characteristics provided are the stratification factors used in the study and help to provide context to the results. The ages and caffeine consumed per day are averages.

http://bio.davidson.edu/courses/genomics/2012/caffeine.pdf
Figure permission granted by Dr. Rob M. van Dam
http://bio.davidson.edu/courses/genomics/2012/caffeine.pdf
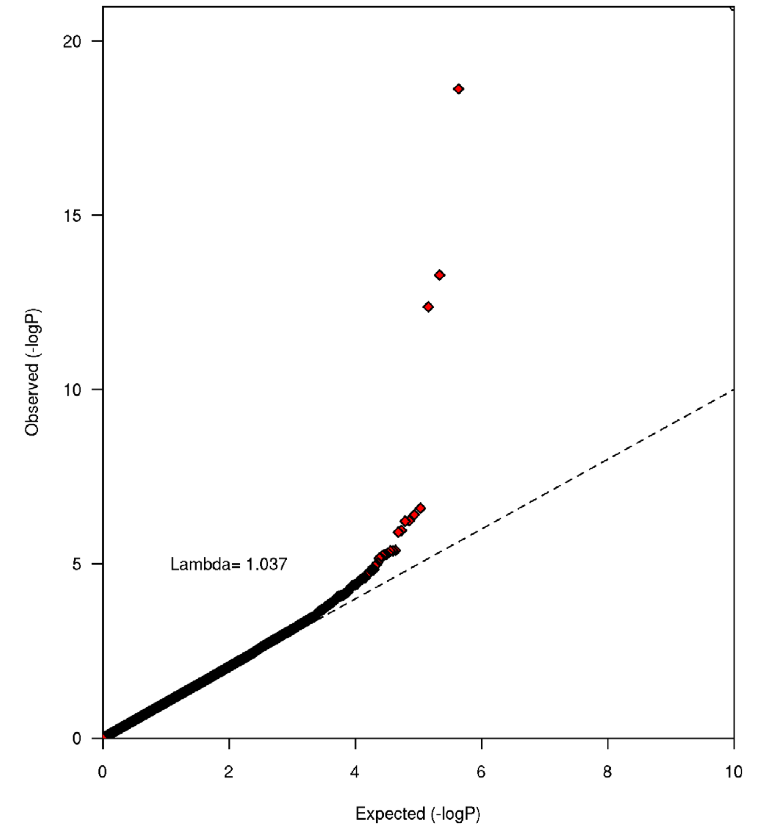
Figure 1. The results (QQ plot) from a test for statistic inflation at the meta-analysis level, which demonstrated that there was no underlying population substructure, as the inflation factor was 1.04, which is close to 1 (indicating absolutely no population substructure). Figure 1 is used to prove that any observed relationships are due to genetic factors and caffeine consumption and not the result of any other underlying factor. From this I gather that any correlation observed is due to variation at the identified candidate genes.
Figure permission granted by Dr. Rob M. van Dam
The SNP most strongly connected to habitual caffeine consumption is rs4410790 (7p21), which is found 54 kb upstream of aryl hydrocarbon receptor (AHR) (Cornelis et al., 2011). The other significantly associated SNP is rs2470893 (15q24), which is in the bidirectional promoter for CYP1A1 and CYP1A2 (Cornelis et al., 2011). The first SNP is most likely associated with AHR due to its relatively close proximity, however the second SNP could be related to either CYP1A1 or CYP1A2.
When data from men and women were analyzed separately, the same loci were considered significant but to a lesser amount of certainty due to the decreased sample size (Cornelis et al., 2011). Instead of focusing on overall caffeine consumption, an additional GWAS was performed focusing solely on caffeinated coffee consumption, which led to the same SNP results (Cornelis et al., 2011). Individuals homozygous for the SNP variant associated with higher caffeine use, consumed 44 mg per day (rs4410790) and 38 mg per day (rs2470893) more than subjects homozygous for the SNP variant not associated with increased caffeine use (Cornelis et al., 2011).
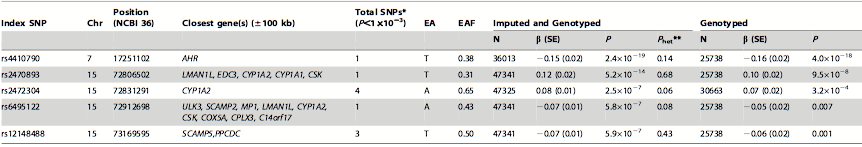
Table 2. SNPs strongly associated with habitual caffeine consumption. In this table, the higher the P value indicates the stronger the association between high caffeine consumption and the SNP. The significance of this table is that 5 index SNPs, that are associated with a total of 10 SNPs, were found to be significantly associated with high caffeine consumption as they had the highest P values from the meta-analysis. The SNPs were then used to identify candidate genes. The difference between the imputed and genotyped and the genotyped columns are that the former includes the SNPs from all of the individuals from the five independent studies and the latter only includes the SNPs from individuals after the sensitivity analysis. The P values were bigger in the genotyped column due to the smaller sample size because of the sensitivity analysis. The symbols used in the table are chromosome (Chr), effect allele (EA), effect allele frequency (EAF), standard error (SE), number of individuals (N), significance (P), between study heterogeneity (Phet**), and number of significant SNPs located within 250 kb from the index SNP (Total SNP*).
http://bio.davidson.edu/courses/genomics/2012/caffeine.pdf
Figure permission granted by Dr. Rob M. van Dam
http://bio.davidson.edu/courses/genomics/2012/caffeine.pdf
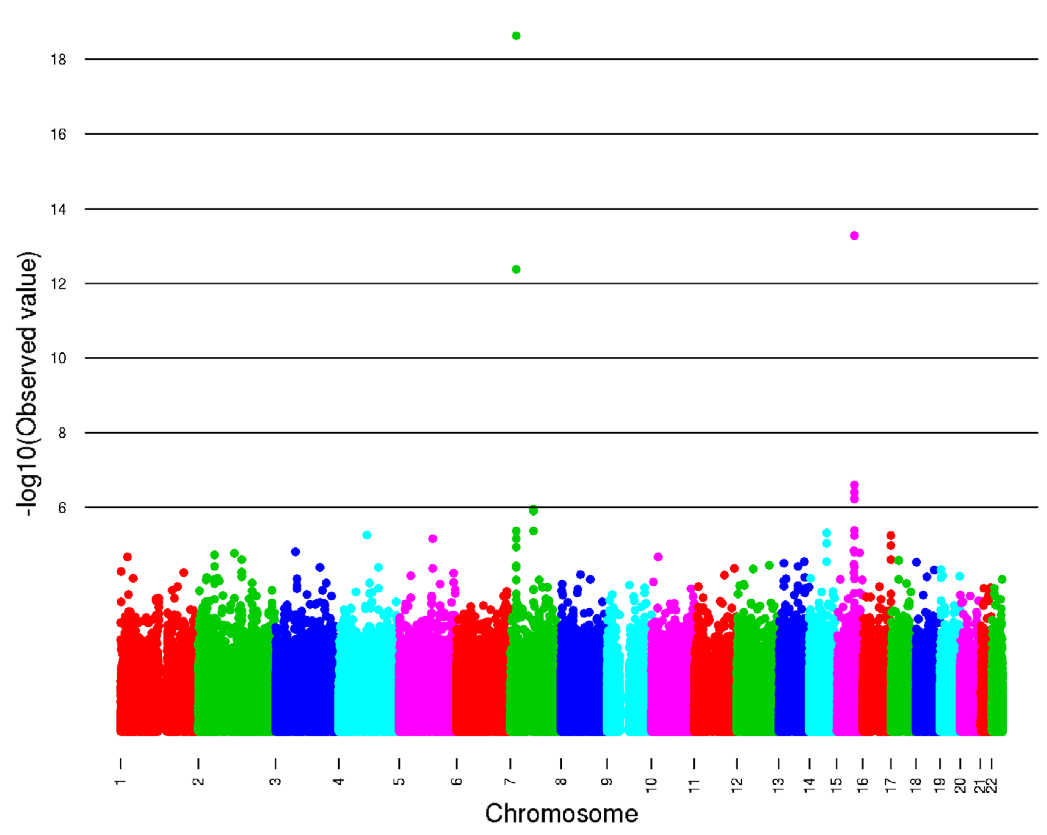
Figure 2. The amount of variance in caffeine consumption arranged in terms of SNPs on each chromosome. For most of the chromosomes there is little variation as the dots, representing SNPs from individuals, are clustered together below the line representing the value 6 (amont of variation). The only chromosomes with a lot of variance are 7 and 15, which are the locations of the SNPs showing the most significance. Variance is seen by vertical dispersion of the dots at these chromosomes.
Figure permission granted by Dr. Rob M. van Dam
http://bio.davidson.edu/courses/genomics/2012/caffeine.pdf
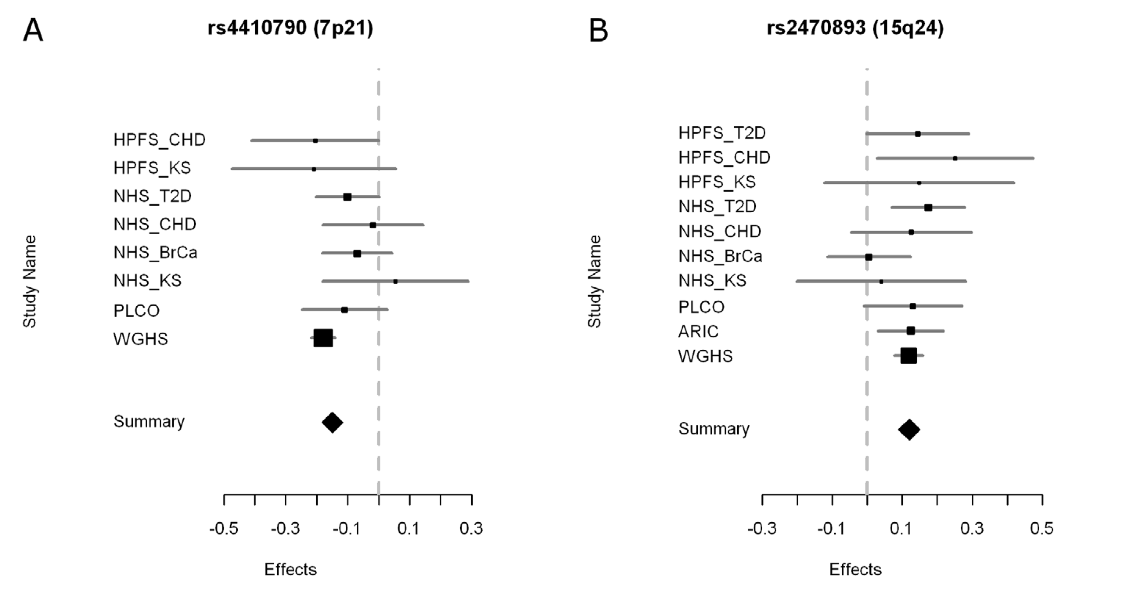
Figure 3. This figure shows forest plots of the meta-analysis for the two SNPs associated with habitual caffeine consumption. Listed on the Y-axis are the different studies (same as those listed in Table 1) from which data was used for the meta-analysis. The ‘summary’ row on the Y-axis represents the effect value for the entire meta-analysis. The X-axis represents the effect, which is an odds ratio. However the components of the ratio are unclear from the information provided by the authors. Although it is not stated in the paper, the vertical line represents no effect. The squares on the graph represent the contributing effect and the horizontal lines represent the confidence intervals of the data from each study. The larger the size of the square, the more the study contributed to the meta-analysis. Contribution seems to be dependent on the amount of individuals from the studies listed in Table 1 as those with the largest N value also have the largest square in Figure 3.
In general the label of ‘effect’ for the X-axis is unclear and makes the figure confusing. Additionally, a definition or explanation of forest plots would have been helpful. From the information provided in the paper, the conclusion of this figure is unclear. For SNP rs4410790, I interpret that there is a negative correlation between the presence of the SNP and habitual caffeine consumption because the summary diamond is in the negative effect region. For SNP rs2470893, I interpret that there is a positive correlation between the presence of the SNP and the observed phenotype because the summary diamond is in the positive effect region.
Figure permission granted by Dr. Rob M. van Dam
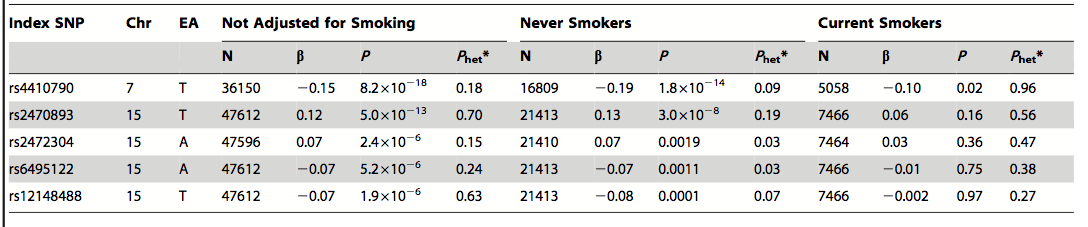
Table 3. Role of cigarette smoking in connection with caffeine consumption, AHR, and CYP1A2. When the model is not adjusted for smoking, the same SNPs remain significant. The researchers concluded that smoking was unlikely the cause of the correlation between the candidate genes and caffeine consumption. The terms are the same as those explained in Table 2.
http://bio.davidson.edu/courses/genomics/2012/caffeine.pdf
Figure permission granted by Dr. Rob M. van Dam
The candidate genes most likely to be associated with increased caffeine consumption are AHR, which encodes the protein that regulates CYP1A2, and CYP1A2, which encodes the protein that metabolizes caffeine (Cornelis et al., 2011). CYP1A2 breaks down caffeine by removing any of the three methyl groups seen in Figure 4. Interestingly, CYP1A2 expression and protein activity are largely variable throughout the population (10 to 60-fold) (Cornelis et al., 2011). Due to the fact that CYP1A1 and CYP1A2 have a common 59-flanking region and are right next to each other (Cornelis et al., 2011), CYP1A1 needs to be ruled out as a candidate gene in addition to confirming CYP1A2. The researchers attempt to rule out CYP1A1 as a candidate gene as they indicate that its expression is low in the liver, the organ primarily responsible for caffeine metabolism, and that the associated protein is not responsible for caffeine metabolism, while CYP1A2 is highly expressed in the liver and known to encode for the protein responsible for caffeine metabolism (Cornelis et al., 2011). Given that CYP1A2 is associated with caffeine metabolism, is variable, and is expressed in the liver, I cautiously accept that CYP1A2 is one of potentially many candidate genes associated with habitual caffeine consumption. On the other hand, it is possible given the proximity of the SNP to both CYP1A1 and CYP1A2 that as a result of alternative splicing, a protein can be produced from CYP1A1 that is expressed in the liver and involved in caffeine metabolism. Also, according to Figure 5, there are nine variants of CYP1A1 that produce different proteins. One of these proteins could be related to caffeine metabolism and CYP1A1 should therefore not be excluded from the candidate gene list, as more exploration is necessary.
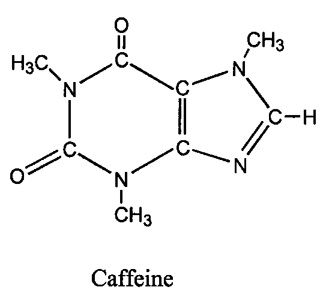
Figure 4. The structure of caffeine (1,3,7-trimethylxanthine). Note the three methly groups removed by CYP1A2.
http://www.mhhe.com/biosci/pae/botany/botany_map/articles/article_36.html
![]()
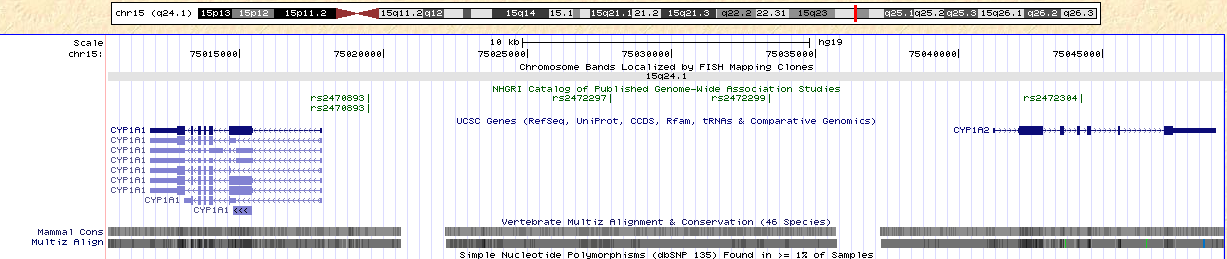
http://genome.ucsc.edu/cgi-bin/hgTracks?hgsid=247618565&hgt_doJsCommand=&dirty=true&position=chr15%3A75%2C010%2C425-75%2C049%2C214&hgtgroup_map_close=0&hgtgroup_phenDis_close=0&hgtgroup_genes_close=0&hgtgroup_rna_close=0&hgtgroup_expression_close=0&hgtgroup_regulation_close=0&hgtgroup_compGeno_close=0&hgtgroup_neandertal_close=0&hgtgroup_varRep_close=0Figure 5. Note the location of CYP1A1 and CYP1A2. SNP rs2470893 is located between these two genes.
AHR is known to express AhR, which is a transcription factor that interacts with other proteins and ligands before ultimately regulating the expression of both CYP1A1 and CYP1A2 (Cornelis et al., 2011). Again, previous studies have identified variation in activity of this protein across populations (Cornelis et al., 2011), possibly due to its connection with CYP1A2, which is also known to vary throughout the population. Although there is a biological connection between AHR and CYP1A2, there was no correlation between both loci being strongly associated with caffeine consumption at the same time (Cornelis et al., 2011). Given the strength of the AHR SNP’s association with caffeine use displayed by the GWAS and its biological relationship with CYP1A2, I accept it as a valid candidate gene.
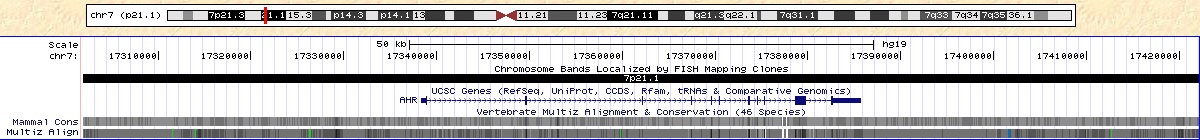
http://genome.ucsc.edu/cgi-bin/hgTracks?hgHubConnect.destUrl=..%2Fcgi-bin%2FhgTracks&clade=mammal&org=Human&db=hg19&position=chr7%3A17338276-17385775&hgt.suggest=AHR&hgt.suggestTrack=knownGene&Submit=submit&hgsid=245571201&knownGene=pack
Figure 6. Note the location of AHR. SNP rs4410790 is located upstream of the gene.
Other genes have been thought to be associated with caffeine metabolism, such as CYP2C9 and ADORA2A, which are responsible for encoding proteins with the following functions: Breaking down caffeine molecules by removing a methyl group and a receptor that is antagonized by caffeine, respectively (Cornelis et al., 2011). CYP2C9 is known to have a smaller effect on caffeine metabolism than CYP1A2 (Cornelis et al., 2011) and does not appear on ‘the closest gene list’ from Table 2. Since CYP2C9 is listed in Table 4 as a gene found to be significantly associated with habitual caffeine consumption at the gene level and its product is know to metabolize caffeine in a similar fashion to CYP1A2, it should not be removed from consideration as a candidate gene. Although CYP2C9 plays a minor role compared to CYP1A2, I think its expression might be correlated with the behavior being studied and its addition could increase the percent of variation that is accounted for by the signature.
Although ADORA2A is associated with the stimulating and addictive properties of caffeine and polymorphisms of the gene have been associated with the habitual use of caffeine (Cornelis et al., 2011), the authors decide to dismiss the gene as a possible candidate without any explanation. The gene was not associated with any of the SNPs found in Table 2 but was deemed significant when the authors looked for gene-based associations. It is a bit curious why this gene was not investigated more and that a reason was not provided. The complexity of genomics is yet again displayed as the combination of the two SNPs only account for 0.06 and 0.72% of the variation (Cornelis et al., 2011), which suggests that many genes and possibly non-genetic factors are related to this habit. The small amount of accountability by the two SNPs for the variation, suggest that other genes and gene products may play a role in caffeine metabolism and affect the habitual use of the molecule. Additionally, epigenetics may play a role in the variation in consumption of caffeine. Epigenetics is a heritable change in gene expression without a change to the gene sequence through mechanisms, such as methylation and acetylation. The meta-analysis can only detect variation due to differences in the gene sequence and does not detect epigenetic factors.
The authors were innovative as they are the first to use GWAS to identify the genetic factors associated with caffeine consumption. The identification of two highly probable candidate genes confirms the usefulness of the GWAS approach to study genetic variation associated with behavioral characteristics. Although the paper often uses the words ‘habitual caffeine consumption,’ the authors never define this in terms of amount of caffeine per day. This is an increasingly important area especially as more studies are conducted regarding the connection between caffeine and certain medical conditions. The candidate genes determined by the study appear to be biologically feasible. From a logical standpoint, it is likely that the genes encoding a protein known to metabolize caffeine and the protein known to regulate the process would be associated with habitual caffeine consumption.
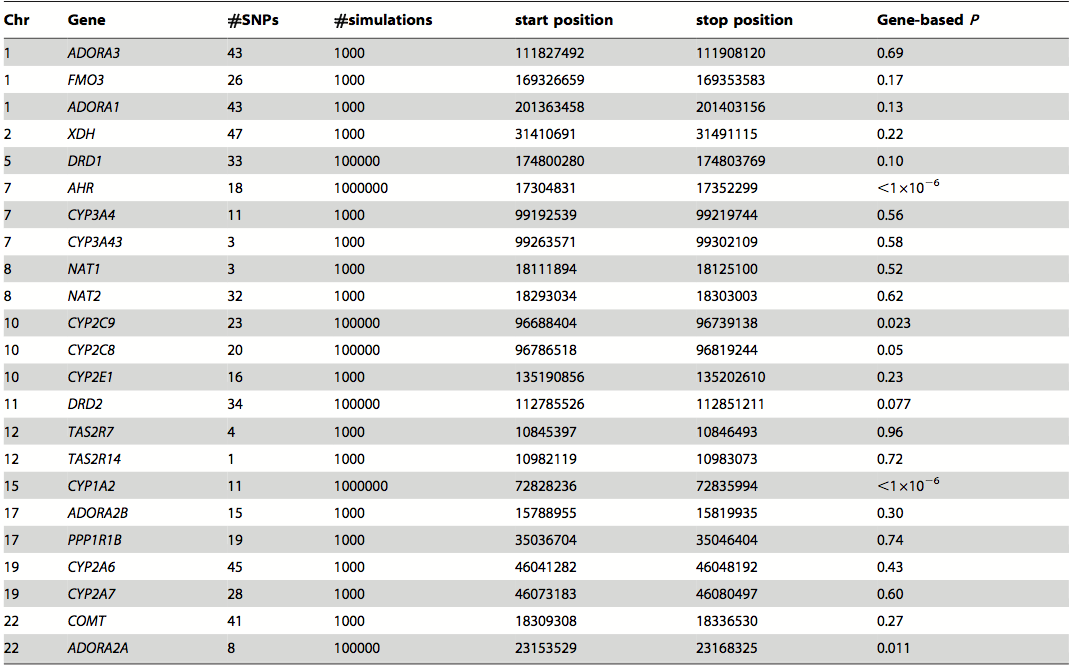
Table 4. Candidate genes from meta-analysis focusing on the gene level. This list is important as it increases the amount of candidate genes and includes those not only indicated by the SNPs.
http://bio.davidson.edu/courses/genomics/2012/caffeine.pdf
Figure permission granted by Dr. Rob M. van Dam
Gary W. Arendash and Chuanhai Cao. 2010. Caffeine and Coffee as Therapeutics Against Alzheimer’s Disease. Journal of Alzheimer’s Disease. 20: 117-126.
Marilyn C. Cornelis, Keri L. Monda, Kai Yu, Nina Paynter, Elizabeth M. Azzato, Siiri N. Bennett, Sonja I. Berndt, Eric Boerwinkle, Stephen Chanock, Nilanjan Chatterjee, David Couper, Gary Curhan, Gerardo Heiss, Frank B. Hu, David J. Hunter, Kevin Jacobs, Majken K. Jensen, Peter Kraft, Maria Teresa Landi, Jennifer A. Nettleton, Mark P. Purdue, Preetha Rajaraman, Eric B. Rimm, Lynda M. Rose, Nathaniel Rothman, Debra Silverman, Rachael Stolzenberg-Solomon, Amy Subar, Meredith Yeager, Daniel I. Chasman, Rob M. van Dam, Neil E. Caporaso. 2011. Genome-Wide Meta-Analysis Identifies Regions on 7p21 (AHR) and 15q24 (CYP1A2) As Determinates of Habitual Caffeine Consumption. PLoS Genet. 7: 1-9.
Iain K. Crombie and Huw T Davies. “What is meta-analysis?” What Is It Series. Apr. 2009. Sanofi-Aventis. 29 Feb. 2012 <http://www.medicine.ox.ac.uk/bandolier/painres/download/whatis/meta-an.pdf>.
Carol D. Frary, Rachel K. Johnson, and Min Qi Wang. 2005. Food Sources and Intakes of Caffeine in the Diets of Persons in the United States. Journal of the American Dietetic Association. 105: 110-113.
Frequently Asked Questions About GWAS. National Institutes of Health. U.S. Department of Health and Human Services. 29 Feb. 2012 <http://gwas.nih.gov/01faq2.html>.
Eng-King Tan, Eva Chua, Stephanie M. Fook-Chong, Yik-Ting Teo, Yih Tuen, Louis Tan and Yi Zhao. 2007. Association Between Caffeine Intake and Risk of Parkinson’s Disease Among Fast and Slow Metabolizers. Pharmacogenetics and Genomics. 17: 1001-1005.
Jian Yang, Michael N. Weedon, Shaun Purcell, Guillaume Lettre, Karol Estrada, Cristen J. Willer, Albert V. Smith, Erik Ingelsson, Jeffrey R. O’Connell, Massimo Mangino, Reedik Magi, Pamela A. Madden, Andrew C. Heath, Dale R. Nyholt, Nicholas G. Martin, Grant W. Montgomery, Timothy M. Frayling, Joel N. Hirschhorn, Mark I. McCarthy, Michael E. Goddard, and Peter M. Visscher. 2011. Genomic Inflation Factors Under Polygenic Inheritance. European Journal of Human Genetics. 1-6.
Kristopher Hendershot
Biology Major, Class of 2012
Email: krhendershot@davidson.edu