This web page was produced as an assignment for an undergraduate course at Davidson College.
Deep RNA Sequencing Reveals Novel Cardiac Transcriptomic Signatures for Physiological and Pathological Hypertrophy
Summary:
This study examines the transcriptomic signatures of two types of cardiac hypertrophy, Physiological Hypertrophy (PHH) and Pathological Hypertrophy (PAH) using RNA-sequencing (RNA-Seq). The two conditions may show a similar appearance, as cardiac growth, but their underlying mechanisms and effects on the affected organism differ. PHH is a response to exercise and has a favorable impact on physical capability usually prolonging life. It can be characterized by the associated increase in cardiac wall thickness and increased left ventricular volume. In contrast, PAH is a condition that may initially compensate for increased workload, such as abnormal stress, but it can have detrimental effects such as cardiac dysfunction. Song et al. (2012) explore the underlying mechanisms of the two conditions in their study. Previously, the microarray method has been used to examine the genomics of cardiac hypertrophy. In this study, however, the researchers employ a new method, RNA-Seq to overcome some of the limitations of microarrays. The researchers used mice to model the diseases and used RNA-seq on cardiac tissue from these mice. They find RNA-Seq to be a more accurate, reproducible method with higher sensitivity than the microarray method in examining cardiac transcriptomes. Using RNA-Seq, the researchers found distinct transcriptomic signatures in PAH and PHH. In this study, they examined both quantitative, in the form of differentially expressed genes (DEGs), and qualitative, in the form of alternative splicing, characteristics to distinguish PAH and PHH from each other. Moreover, specific genes involved in the development of PAH were also identified.
Conclusions:
In PAH and PHH Song et al. (2012) obtained approximately 13-20 million reads. After filtering and normalizing and comparing these data to controls, they found that there are more differentially expressed genes (DEGs) in PAH than in PHH. In order to further understand the mechanism underlying PAH, they examined 417 genes that are silent in controls but up-regulated in the PAH model. Combining Ingenuity Pathway Analysis (IPA) of these DEGs and transcription factor analyses, they found that Foxm1 and Plk1 are involved in regulating other genes in PAH as hub proteins. Moreover, alternative splicing (AS) was also confirmed for PAH and PHH using RNA-Seq in 8 genes (Fhl1, Rcan1, Ndrg2, Synpo, Ttll1, Cxxc5, Egfl7, and Tmpo). Further analysis incorporating the various changes observed between PAH and PHH showed that DEGs and AS differed depending on the type of pathway in PHH and PAH.
My Opinion:
Overall, the researchers present their information in a clear and understandable manner. For instance, the figures use visual cues (such as circles or distinct contrasts) to guide the reader's attention to the highlights of each figure. Moreover, they succeed in both presenting the new information found while at the same time presenting the advantages of the method, RNA-Seq, used. From this paper, it appears as if RNA-Seq is a valid method that can be applied to other aspects of genomics, such as different organisms, different body regions, and different diseases, thus further aiding in advancing scientific knowledge.
However, there is some information that they do not address in figures, such as the 417 silent genes upregulated in PAH. There is other information, such as Figure 1A that is presented graphically, but that is not addressed in the text.
Figures:
Figure 1:
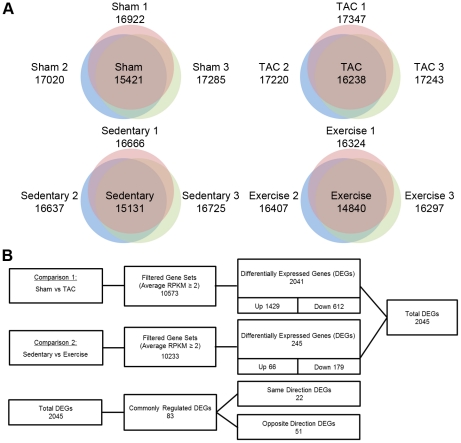
In Figure 1, the researchers present the quantitative data obtained from RNA sequencing of 4 mouse models of PAH, PHH and controls for each. The animal models used in this analysis were 8-week-old male (C57BL/6J) mice that were modified to be either PAH and PHH model organisms. The PAH model mice were generated by trans-aortic constriction (TAC) operation. As a control to compare these TAC mice to, sham mice, which underwent the same operation except for the tying resulting in the actual TAC, were also generated. The PHH mice were generated through chronic swim training for 4 weeks and sedentary mice served as control comparison for them. The model mice for PAH and PHH were confirmed to have significantly enlarged hearts (p<0.01). The researchers performed RNA-Seq with an Illumina Genome Analyzer II (GA-II) on cardiac tissue from these mouse models. After eliminating low-quality reads, 13-20 million reads were obtained. These were normalized to "reads per kilobase of exon model per million mapped reads" (RPKM). Panel A shows venn diagrams of the numbers of expressed genes detected at least once in each of the mouse models. In the center of each venn diagram is the number of overlapping genes between three model organisms for each model. This panel might suggests that PAH may be associated with increased gene expression and PHH may be associated with decreased gene expression. In Panel B, the genes, after filtering out those with less than 2 RPKM to minimize false positives, were shown and compared between models and controls. Using a Student's t-test (p < 0.05) and a |fold change| ≥ 1.5, differentially expressed genes (DEGs) were examined in the mouse models for each cardiac hypertrophy compared to its control group. As a result, 2,041 DEGs for PAH and 245 for PHH were found, indicating that the number of DEGs is approximately 8-fold higher in PAH than in PHH. Of the 2,041 DEGs in PAH, 1429 were up-regulated and 612 were down-regulated, whereas 66 of the 245 DEGs were up-regulated and 179 down-regulated in PHH. This suggests that the expression patterns differed between the two diseases as in PAH a majority of the genes were up-regulated and a majority of the DEGs were down-regulated in PHH. Specifically, 51 genes were oppositely regulated, as shown in the third row of data in this panel. Moreover, 417 genes that are silent in control groups are up-regulated in PAH, and these genes are further examined in Figure 2. Overall, 2045 total DEGs were found, which is an improvement to the 891 previously found by the microarray technique, showing the increasing sensitivity and accuracy of RNA-Seq.
Figure 2:
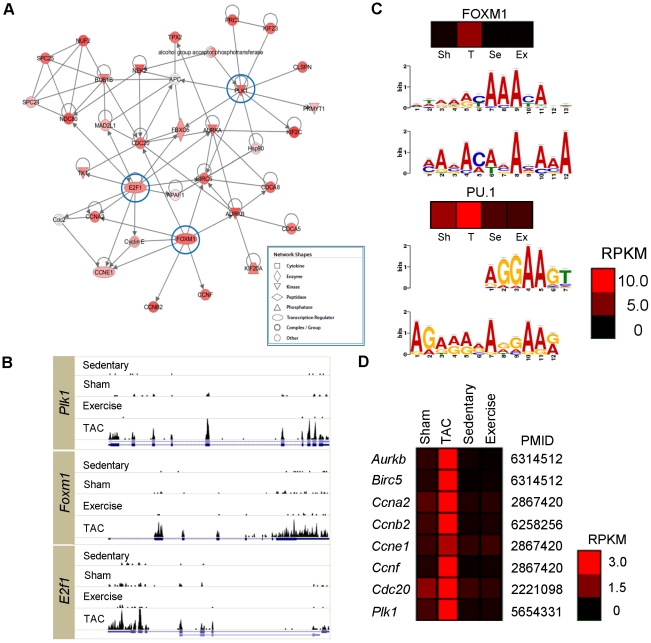
Figure 2 examines the genes considerably up-regulated in PAH as compared to PHH and control models. Panel A employs an Ingenuity Pathway Analysis (IPA) to generate gene networks to determine features of these genes. The top-scoring network is shown with red-colored nodes representing up-regulated genes. The genes encircled in blue, E2F transcription factor 1 (E2f1), forkhead box M1 (Foxm1), and polo-like kinase 1 (Plk1), are abundant genes and are further analyzed in subsequent figures. Panel B shows that the expression patterns of these three genes, showing distinctions between the 4 mouse models. The histograms indicate expression, the blue lines underneath show each of the gene structures, and the boxes indicate exons. The figure shows that these genes were expressed significantly more in the TAC (PAH) model than in the other 3 models, including PHH. Panel C shows the results of MEME to identify enriched upstream motifs for FoxM1 and PU.1. The putative transcription factor (TF) binding motifs shown were significant for both FOXM1 (p=1.9x10⁻⁵) and PU.1 (p=4.8x10⁻²¹). Panel D shows the expression of known targets of FOXM1 in the four mouse models examining its role of transcription factor in PAH. The TAC model shows higher gene expression than the other models, confirming its role as a transcription factor in the pathogenic development of PAH.
Figure 3:
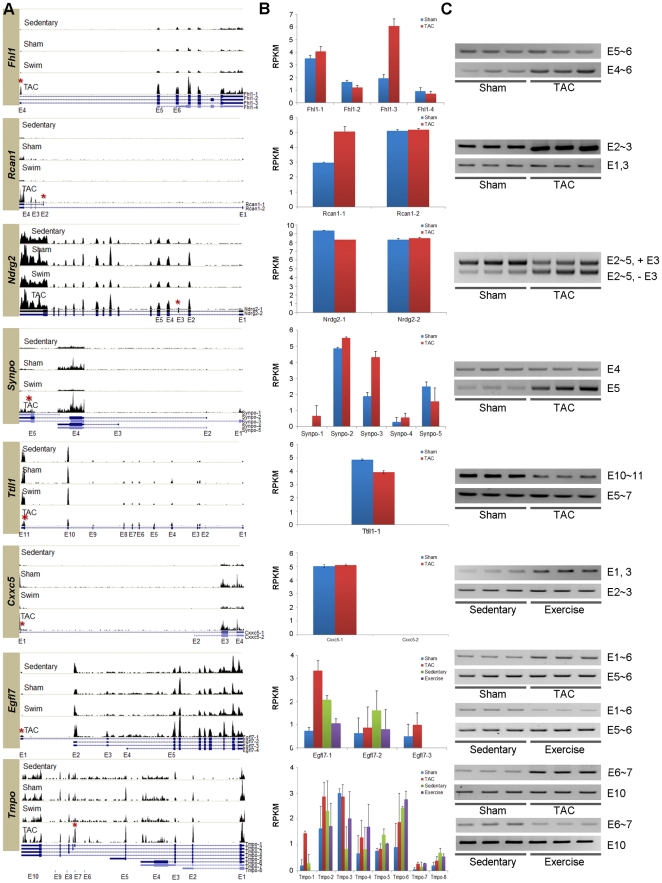
Figure 3 presents RT-PCR results to validate exon variants of 8 selected genes from previous studies. Panel A shows expression patterns for these genes, indicating the gene structures with blue lines, and exons with boxes and labels. The red asterix indicates alternative splicing in hypertrophic specific manner. The vertical length of the histograms indicates the degree of expression, so that comparisons and contrasts can be made between models that would then indicate similar results as the RT-PCR results presented in C. Panel B shows the distributions of UCSC isoforms between different mouse models. Alternative splicing produces different isoforms. By showing the distributions of the isoforms between different cardiac conditions, exon variants are confirmed. For instance, of Fhl1, isoforms 1 and 3 ard more predominant in TAC than in the control. Panel C presents the RT-PCR results used to confirm exon variants. For each gene, expression of at least two exons is shown and compared either between TAC and sham or exercise and sedentary or all four. Which exon is examined is shown on the right. This figure shows that Fhl1, Rcan1, Ndrg2, Synpo, and Ttll1 exhibit alternative splicing related to PAH. Moreover, Cxxc5 is shown to be involved in PHH. For Egfl7 and Tmpo the RT-PCR amplifications are shown for all four mouse models to show that PAH and PHH exhibit opposite splicing in these genes. Moreover, alternative splicing can alter three biological properties: domain gain or loss; activity change; and localization.
Figure 4:
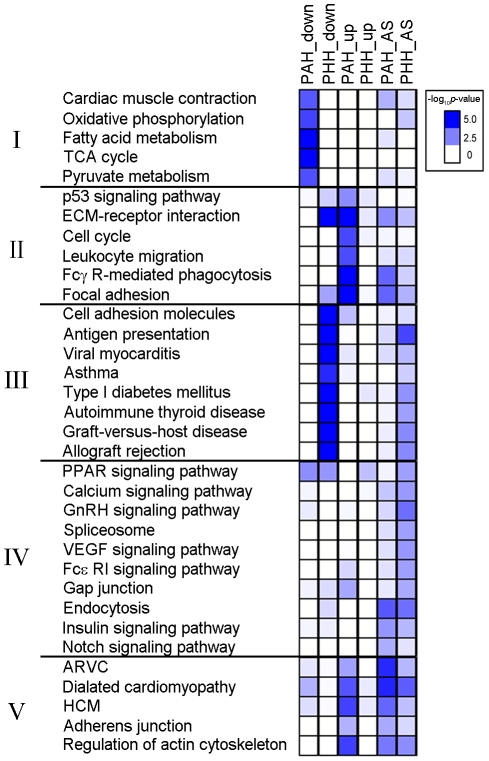
Figure 4 shows KEGG pathways, grouped in 5 categories by function, associated with DEG down-regulation, DEG up-regulation, or alternative splicing. These 5 different groups indicate 5 different trends in the different transcriptomes between PAH and PHH. Group I (muscle contraction and metabolism) shows significant expression down-regulation in PAH. Groups II (immune and cell cycle) exhibits up-regulation in PAH and some alternative splicing in PHH. Group III (autoimmunity) exhibits significant down-regulation as well as alternative splicing in PHH. Group IV (cell signaling) are affected by alternative splicing in PHH. Group V (cardiac diseases) exhibits up-regulation in PAH as well as alternative splicing in both PAH and PHH.
References:
Frizzi Bschorer's Genomics Page
Genomics Page
Biology Home Page
Email Questions or Comments.
© Copyright 2013 Department of Biology, Davidson College, Davidson, NC 28035