This web page was produced as an assignment for an undergraduate course at Davidson College.
Summary and Analysis
Figure 1
Figure 2
Figure 3
Figure 4
Question:
Cells in the heart can become enlarged, hypertrophy, by two different pathways causing the same phenotype, but only one is lethal. PHH, physiological hypertrophy, occurs when the heart experiences sustained, intense exercise and is not lethal. PAH, pathological hypertrophy, on the other hand, occurs when the heart experiences increased pressure and as the name suggests, causes disease resulting in death. Song, Hong and Kim wanted to try and elucidate the genetic and transcriptional pathways activated by these two types of hypertrophy to determine how they were similar and how they differed.
Experimental Set Up:
Four mice populations were analyzed in this article that can be divided into two subsets: PAH model and its control model, and PHH model and the control. To simulate the effects of PAH, mice underwent a surgery to constrict their aorta, therefore putting the left ventricle under pressure and mimicking the causes of PAH (TAC population). The control population for these mice is the sham mice, which underwent anesthesia and surgery, but their aorta was not constricted. One week post-operation the hearts were removed from the mice and the RNA was extracted from the tissue.
To model the effects of PHH (exercise population), mice experienced vigorous exercise routines swimming in water for extended periods of times. The control population (sedentary) of mice were kept in their cages and not exposed to exercise. Twenty four hours after completing the exercise program the hearts were removed from the mice and the RNA was extracted.
Complementary DNA was synthesized from the mRNA extracted from the heart tissue, and the cDNA was sequenced by a technique called RNA-seq. This sequenced cDNA was analyzed to determine up-regulation or down-regulation of specific genes as a response to PAH or PHH and to analyze the alternative splicing of these genes.
To learn more about RNA-Seq click here
Results:
The researchers found about 2,250 total genes whose expression changed relative to the controls in PHH and PAH mice. Among the 2,250 genes there were about 400 that were not expressed highly in normal heart tissue, but were highly expressed in PAH mice. They further characterized the molecular importance of these genes by analyzing transcription factors that would increase their expression and found two main transcription factors, FOXM1and PU.1. The researchers also investigated how alternative splicing could effect the proteins secreted by the two experimental mice and identified exons where alternative splicing occurs. The splicing patterns are different in PAH when compared to the control as well as when compared to PHH mice. Finally, they mapped the effects of alternative splicing and gene expression on many important pathways such as metabolism, cell signaling, and immune function to show how these two types of hypertrophy affect completely different biological pathways.
Analysis:
I thought that this approach to identifying the pathways implicated in these two different types of hypertrophy was very smart. The researchers were able to quantify on a gene-by-gene basis the changes in transcription of a specific product to determine gene expression. Furthermore, the base sequencing of the cDNA allowed for more in depth analysis of molecular regulators such as the transcription factors, which other techniques, like microchip analysis, would not have allowed. I also liked the holistic approach they took to characterizing these two pathways. Not only did they look at RNA expression, but they also looked at whole systems of genes and how these genes were regulated and alternatively spliced, which helps give a broader understanding of potential mechanisms of disease for PAH.
One question I have about this article is the validity of the TAC model. The PAH symptoms were induced in these mice by surgery to constrict the aorta and I don’t know how well this surgery models spontaneously occurring constriction causing PAH. If TAC is not a good model, then different genes could be activated than those analyzed in this article.
The main criticism I have of this paper is that the presentation is not very user friendly. The authors incorporate many terms without ever defining them that are central to understanding the concepts in the paper. In addition, the text of the paper narrating their experimental approach did not always explain the figures very well. For example, there is little explanation of figure 3.The authors say that they want to confirm the exon variants, predicted by UCSC genome browser and they used an RT PCR assay to determine similarity. In the actual figure, especially panel B, I was initially confused as to whether the data was the modeling prediction and panel C confirmed the model by gel analysis, or if panel B was original data, re-illustrating the histogram in panel A.
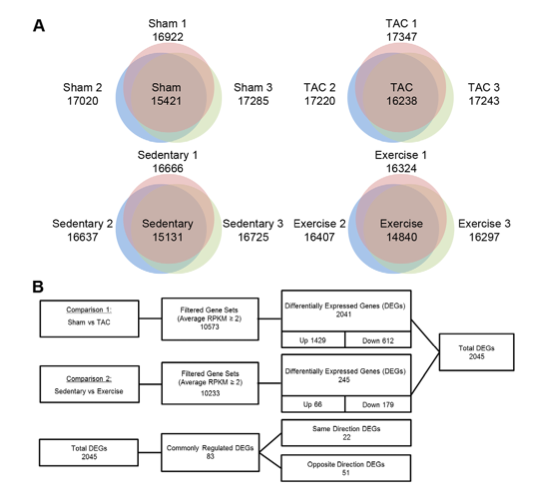
Figure 1A shows the number genes expressed in heart tissue in each of the four mouse models. The number of genes expressed in each individual mouse was measured and common genes expressed in all three replicates is shown in the center of the venn diagram. More genes were expressed in the TAC mice compared to the sham mice, and fewer genes were expressed in the exercise mice compared with the sedentary mice.
Figure 1B illustrates the filtering process that was used to determine relevant genes implicated in the response pathways to PAH and PHH. The first step in reducing candidate genes was to eliminate false positives produced from sequencing the cDNA as mentioned above. To determine which reads are false positives, the researchers used a method to quantify gene expression, “Reads per Kilobase per Million” (RPKM). To calculate this value they divided the number of alignments for a given segment of cDNA/ (length of segment in kilobases * number of reads for mapped genes in millions). If the RPKM value was less than 2 it was considered to be a false positive and discarded.
The second round of filtering consisted of determining whether the gene expression between the experimental model and the control model was significant. For expression to be significantly different it had to have a p value of <0.05 as well as a change in expression level > 1.5 fold.
From this analysis they isolated 1429 genes that were up-regulated in TAC and 512 genes that were down regulated. In the exercise mice there were 66 genes up-regulated and 179 genes down regulated.
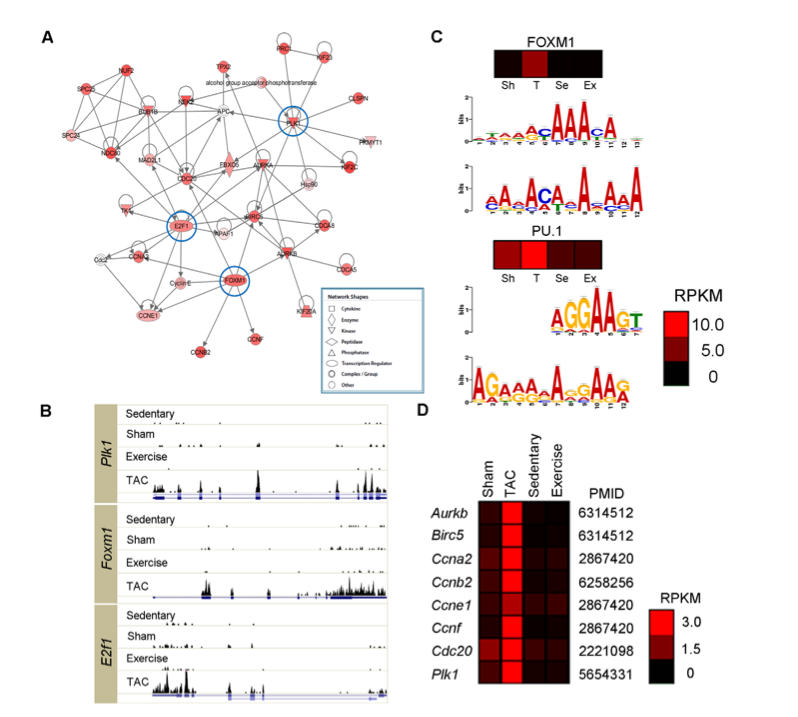
Figure 2 explores cell cycle regulation genes that were up-regulated in the TAC mice. There were about 400 genes that were not significantly expressed in the exercise mice or human heart samples whose RPKM value far exceeded 2 in the TAC mice. Figure 2A illustrates a schematic network of these genes and the three cell cycle regulator genes that they will focus on are circled (Plk1, E2F1, FOXM1). Figure 2B compares the expression of these three genes in the four mice models. The histograms illustrate that expression is considerably elevated in the TAC mice relative to the others.
Next, the researchers wanted to look at the transcription factors used to express these genes. Since transcription factors would not be included in the RNA sequenced, the researchers utilized the UCSC genome database to get the sequence 1,000 base pairs upstream from the 400 candidate genes. They analyzed these sequences using software that analyzed common motifs for the DNA (bottom chart). These motifs most strongly matched FOXM1 and PU.1, the heat maps on top of each set of charts illustrate the predicted up-regulation of these transcription factors in TAC mice. The predicted motifs were compared with the UCSC database sequence for the two transcription factors (top chart).
Panel 2D illustrates gene expression of genes transcribed by FOXM1. These genes are all expressed more highly in the TAC mice than the other models, suggesting the importance in the FOXM1 transcription factor in causing the changes shown by PAH. Furthermore, many of these are cell cycle genes, possibly suggestion a pathway through which PAH may develop.
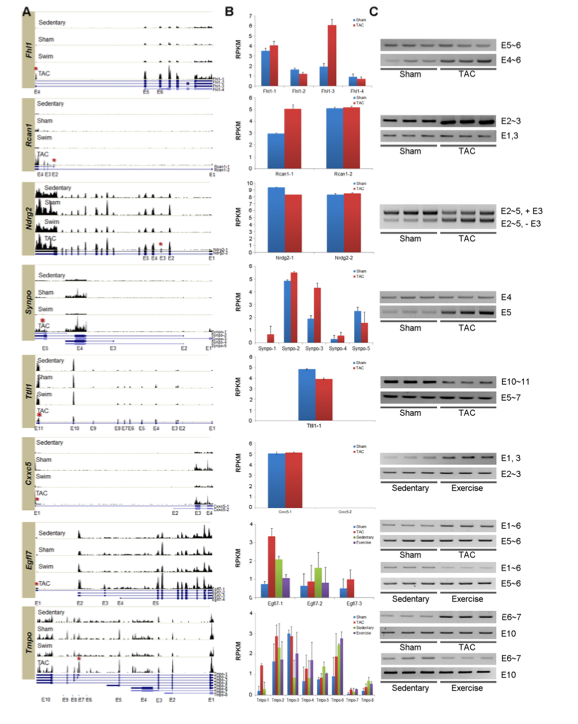
The researchers next wanted to look at how alternative splicing was affected by the PAH or PHH symptoms and what effect this had on the potential pathways implicated in disease. They found hundreds of exon inclusion and exclusion sites in the two mice models and determined exon variants using and the UCSC genome database. They wanted to experimentally confirm their modeling predictions and chose 8 genes at random to analyze. Figure 3A shows histograms for RNA sequenced by reverse transcriptase PCR, comparing expression of different exons for the 4 experimental models. The asterisks show exons where alternative splicing occurs in hypertrophic mice models. The effects of the alternative splicing are clearer in figure B, which shows the different proteins (isoforms) expressed by alternative splicing and the relative expression level in relevant models. Some of the genes are only up or down-regulated in TAC mice, compared to sham mice, such as Rcan-1 and Ttll1, where as other genes alternatively spliced at different expression levels in all four models, such as Egfl7 and Tmpo. Some of the protein isoforms are more common in TAC mice, where as other isoforms of the same gene are more common in sedentary or exercise mice. Panel C confirms these conclusions by performing running the cDNA product on a gel and comparing band intensity with the changes in expression shown in panel B.
These three panels help illustrate how the two different forms of hypertrophy, PAH and PHH, alternatively splice the same genes differently, causing isoforms to be produced at different levels. The isoforms produced can help understand more clearly the causes of PAH and why it is lethal.
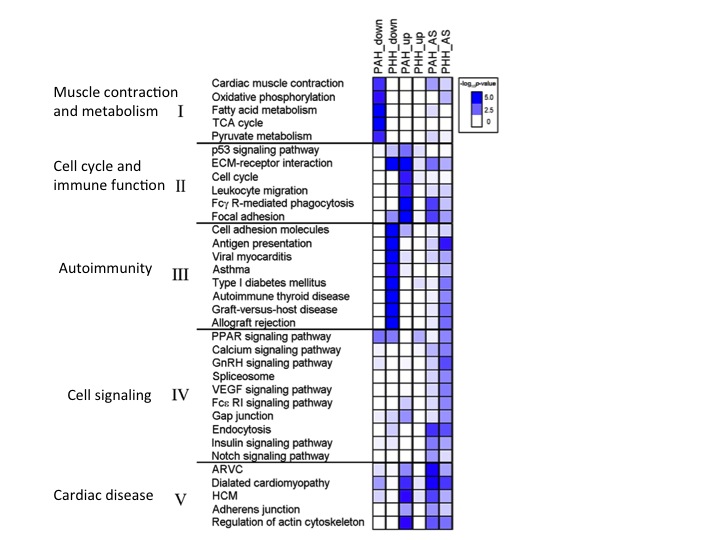
Figure 4 analyzes the pathways that are implicated in PAH and PHH both from a gene regulation level as well as a RNA splicing level. PAH mice tend to down regulate important genes for metabolism as well as muscle constriction, potentially explaining why PAH hypertrophy is fatal. In addition, PAH mice have up-regulation of genes that affect immune function and cell cycle, as well as cardiovascular disease. PAH and PHH have increased alternative splicing for these two categories of genes, but PAH mice tend to have greater levels than PHH. PHH mice, on the other hand down regulate genes that cause autoimmunity, promoting the healthy hypertrophy seen in mice. PHH mice also have more alternative splicing in these autoimmunity genes relative to PAH mice.
Gaining a better understanding of the biological pathways as well as genes implicated in PAH versus PHH can help narrow down targets for a potential therapy for PAH. It can also inform future studies trying to better understand the role in specific genes in hypertrophy and seeing how these genes interact on a systemic level.
Song, Hong Ki, et. al. 2012. Deep RNA Sequencing Reveals Novel Cardiac Transcriptomic Signatures for Physiological and Pathological Hypertrophy. PLOS One. 7: 1-13. Accessed 17 Feb 2013. <http://www.plosone.org/article/info%3Adoi%2F10.1371%2Fjournal.pone.0035552>