This web page was produced as an assignment for an undergraduate course at Davidson College
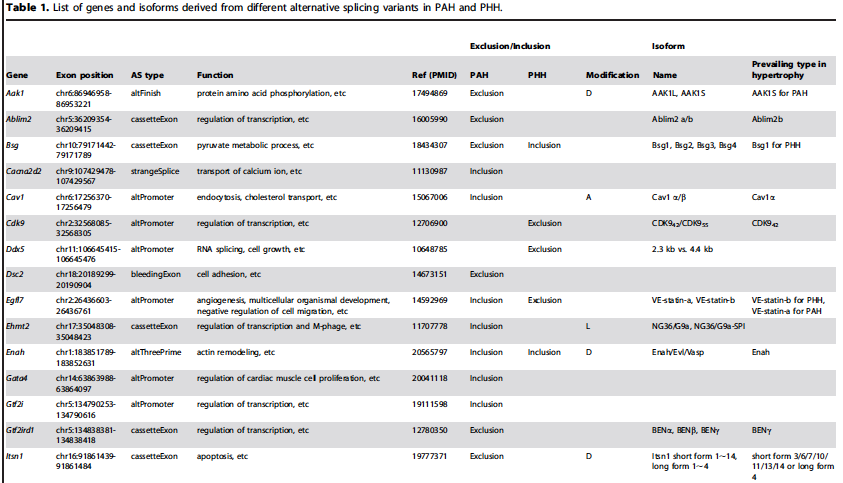
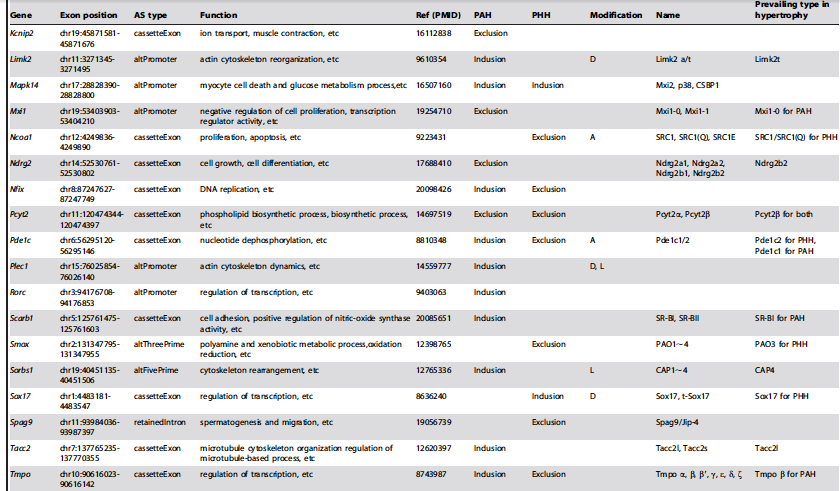
Song et al. Table 1
Table 1. Table lists the genes affected and corresponding isoforms observed in PAH and PHH conditions. Exon position indicates chromosomal location. AS type indicates how the isoforms splicing patterns differ (e.g. cassetteExon includes or excludes an exon between two other exons). Function indicates the cellular role(s) of the affected protein. Ref (PMID) gives the proteins identification number in PubMed. The inclusion/exclusion column give information about exon inclusion or exclusion in each hypertrophy type; e.g. in PAH Aak1 experiences AS which excludes the final exon (AS type altFinish). Modification indicates whether the new isoform experiences a gain or loss of domain (D), a change in activity (A), or a change in cellular localization (L). The isoform column names the possible isoforms for that gene product and identifies which is most prevalent in the hypertrophic condition specified in the Inclusion/Exclusion column.
Table reprinted under a Creative Commons license from Song et al. 2012