
This web page was produced as an assignment for an undergraduate course at Davidson College.
Review Paper 1
Summary:
In this study, Song et al. employ RNA sequencing (RNA-Seq) to quantify gene expression and alternative splicing levels in order to compare the transcriptomes of cardiac tissue under physiological hypertrophy (PHH) and pathological hypertrophy (PAH). The increased growth of cardiac tissue in PHH is the result of stress put on the heart by exercise, whereas in PAH tissue growth is a compensatory mechanism for pathologically increased pressure or volume load in the circulatory system. Though the two hypertrophies present similar morphological symptoms, the results of this work reveal that significant genetic differences exist between the developments of each. These differences are in the number of genes that are up-regulated, down-regulated, and alternatively spliced in each hypertrophy as compared to controls.
The researchers used RNA-Seq to quantify the degree to which >10,000 genes in cardiac tissue are expressed in mice under various conditions. RNA-Seq entails isolating mRNA from live tissue, creating cDNA, and sequencing and compiling read depth of compiled sequences. The number of reads obtained that correspond to a single gene is proportional to the relative number of copies of corresponding mRNA that were present in the original tissue, and thus can be used to quantify gene expression. The researchers reported individual gene expression using “reads per kilobase of exon model per million mapped reads (RPKM)”, essentially a ratio of the number aligned sequences for every 1000 base pairs in particular exons (because the source is mRNA) to the number of reads that align to any exons (in millions of reads). Those genes that are expressed more in cardiac tissue have higher RPKM values.
The researchers also sought to compare RNA-Seq to microarray analysis to demonstrate the higher accuracy and greater versatility of the former. RPKB values are used for these comparisons, in which the only difference is that reads per kilobase of exon model are compared to billions of total reads. Using exon-specific data and online pathway resources, the researchers determined differences in alternative splicing (AS) under PHH and PAH, as well as situated differently expressed genes (DEG’s) within critical pathways. Overall, they found that RNA-Seq identifies more DEG’s and allows for AS data to be collected. The researchers corroborated the results of the RNA-Seq technique with quantitative reverse transcriptase polymerase chain reaction (qRT-PCR). In doing so, they were able to correlate RNA-Seq, qRT-PCR, and microarray analysis. While RNA-Seq and qRT-PCR correlated closesly, microarray analysis deviated significantly, supporting the accuracy of the RNA-Seq technique.
The study succeeds in identifying hundreds of genes that are differentially expressed under the conditions of PHH and PAH. Some genes are up-regulated in PHH and/or PAH, while others are down-regulated. Using online resources, the researchers were able to select from the pool of differentially expressed genes to identify hubs for differential expression among many others, such as the transcription factors Foxm1 and MAZ. In addition, they were able to detect relative amounts of isoforms of alternatively spliced genes, demonstrating that certain isoforms are upregulated or downregulated in PHH and/or PAH. In their most powerful presentation of the data, DEGs and AS events in each of PHH and PAH were categorized by their general function. These data (fig 4) indicate that the positive strengthening of cardiac tissue due to exercise (PHH) is accompanied by suppression of autoimmune processes, whereas abnormal pressure and volume load (PAH) result in greater expression of genes related to the immune response. Such interpretations illustrate the great complexity of genetic responses to physiological changes, whether positive or related to disease. In general this technique provides not only a way to distinguish between similar clinical presentations of different anatomical phenomena, but also elucidates genetic mechanisms as potential avenues for disease treatment.
As with many examples of papers published in this field, the figures require a lot of time and concentration to interpret. The researchers use “sham” and “control”, and “swim” and “exercise” interchangeably throughout the paper and in Figure 3. Being consistent in that terminology would aid the reader’s comprehension. The text refers to particular sets of data within the figures, and offers an interpretation without much explanation, leaving the reader to have to scroll back and forth from the text to the figure to arrive at the same conclusion. This is especially cumbersome in their discussion of the “Top scoring network” in Figure 1, and the qRT-PCR data in Figure 3. On a similar note, the group used three external online sources for gene associations (Ingenuity Pathway Analysis, NEUMA, and KEGG), but hardly explained the function of these resources in establishing connections between genes. Further comments on the figures can be found in their synopses below. Overall this study is impressive in its scope. The data are relatively simple to collect, yet online resources have made powerful connections between the data and the unique transcriptomic signatures of PHH and PAH possible. These researchers were resourceful and insightful in this work.
Figure it out! Figure Summaries
Genomics Page
Biology Home Page
___________________________________________________________________________________________________________
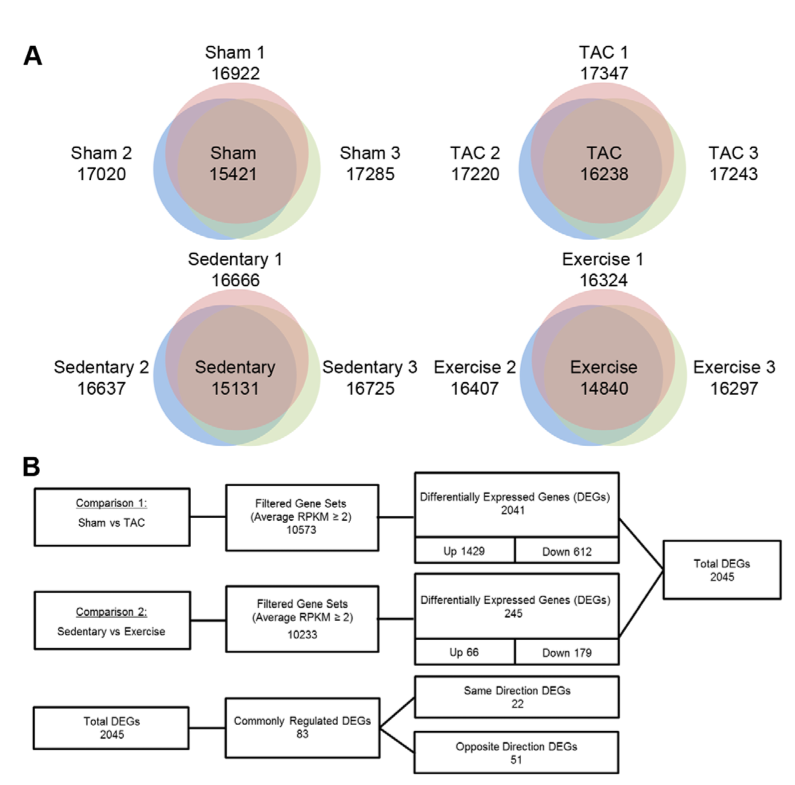
1. A: determining baseline gene expression in four mouse conditions. Ven diagrams illustrate gene expression unique to each mouse within each condition (non-overlapping) as well as genes expressed by two or all three mice within each category (overlap). B: flowcharts summarizing comaparisons between control mice, sham and sedentary, to experimental mice, trans-aortic constriction or TAC (model PAH) and mice with regular swim training (model PHH). First two rows: Column 1: mice used for comparison. Column 2: number of genes meeting read depth criteria for expresion comparison. Column 3: total number of differently expressed genes (DEG's) in comparison and subset of those that are up-regulated or down-regulated. Row 3: subset of total DEG's which are "commonly regulated". The authors make no explanation for this term, though presumably it means that the regulatory mechanisms for these genes are well described. "Same Direction" denotes that the genes in question are both up-regulated or both down-regulated in each hypertrophy. "Opposite Direction" denotes those that are either up-regulated or down-regulated, depending on the hypertrophy. More genes are up-regulated in the PAH simulartion than in the PHH simulation.
2. Increased expression of interrelated network of genes in TAC mice. A: computer generated web of interactions between genes with increased expression in TAC mice. Though red alone is described as indicating increased expression, some show lighter shades. These may be genes with increased expression in TAC mice that is not as extreme as those with darker red coloration. No heatmap is provided. B: Schematic depiction of three genes with increased expression in TAC mice. Taller black bars indicated greater expression. Bars are situated above exons in each gene (dark blue boxes). These data confirm that some genes in TAC are expressed to a greater degree than the same genes in any of the other four mice (sham, sedentary, and swim). C: MEME online algorithm shows relative frequency of specific bases at positions ~1000bp upstream of genes. Consensus sequences (above) show similarities to predicted motifs (below). Agreement shows that these genes that all show elevated expression in TAC are likely regulated by the same transcription factors. Consensus sequenes correspond to certain transcription factors (information catalogued in database). Heatmaps show expression of predicted transcription factor, with TAC showing highest expression. D: Expression of genes targeted by transcription factor FOXM1. Greater expression in TAC confirms accuracy of network in A and suggests key role for FOXM1 in response to PAH.
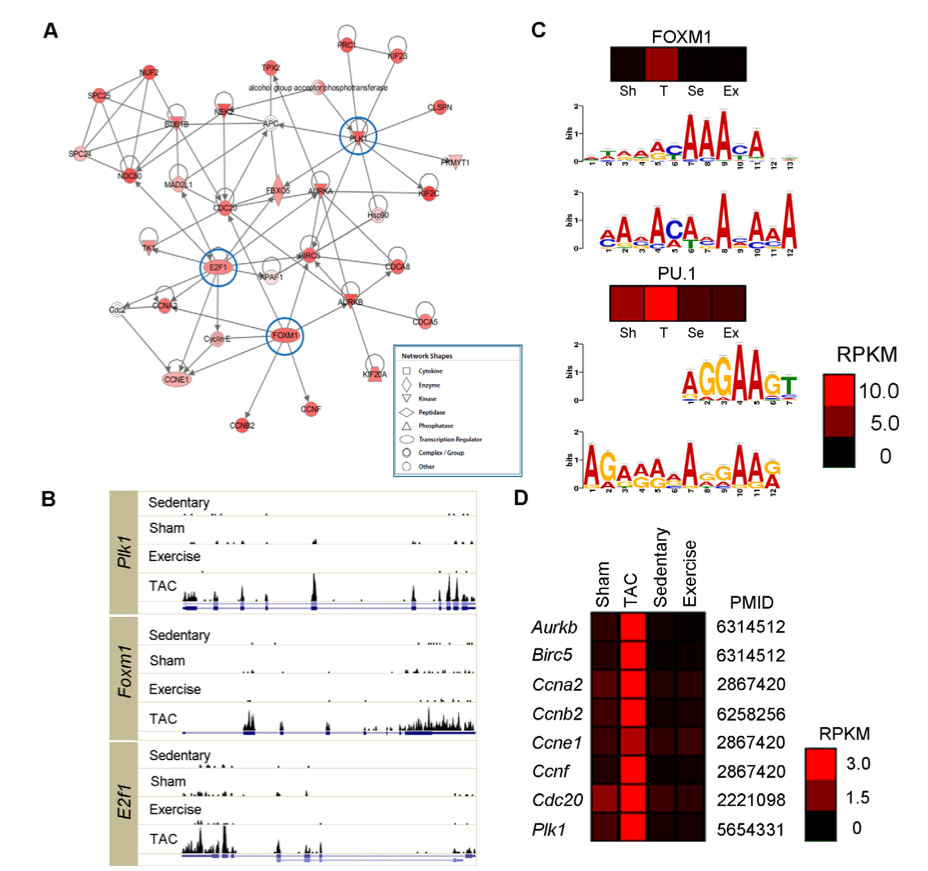
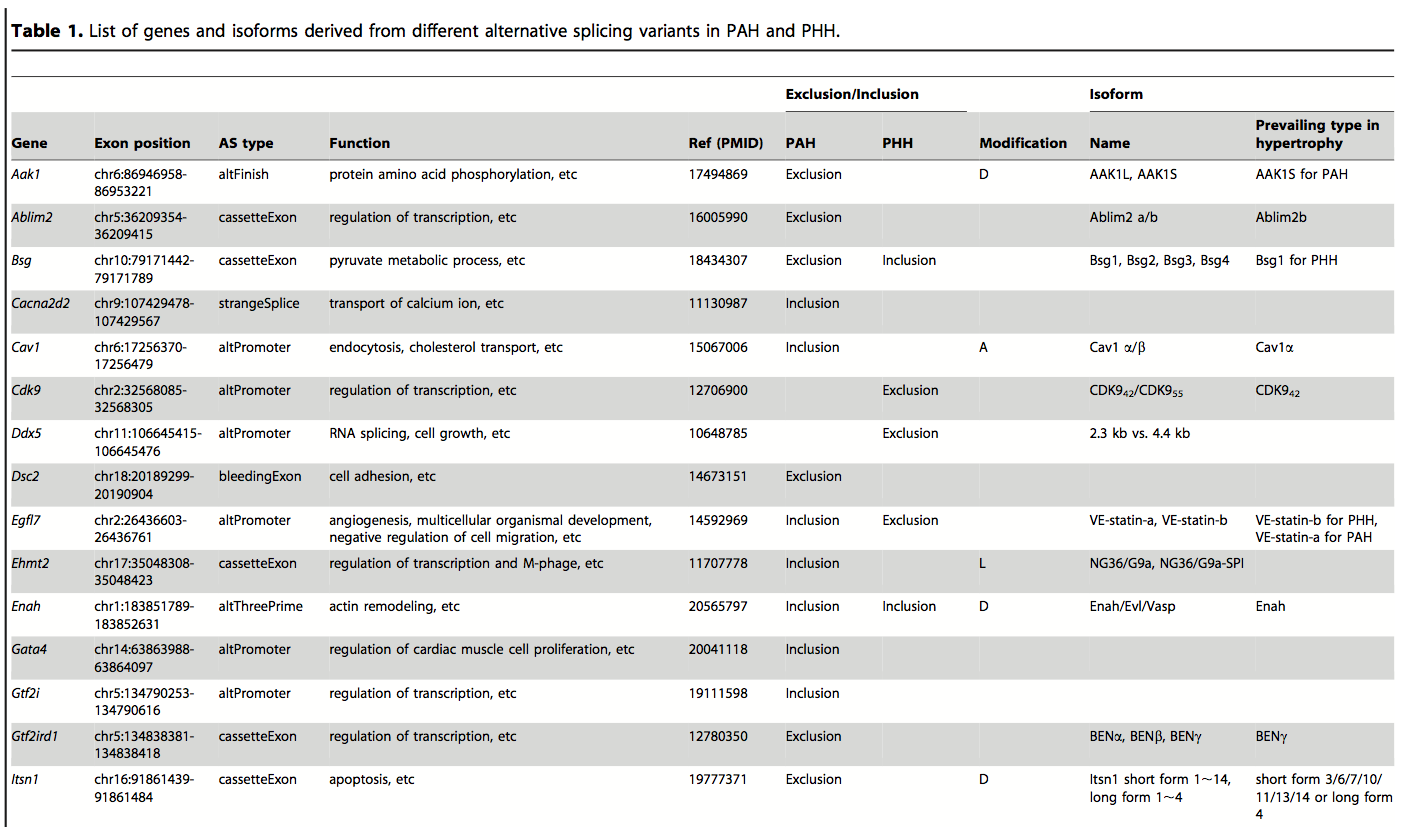
Table 1. A representative sample of the genes in PAH and PHH that show alternative splicing using RNA-Seq data to determine splice variant frequencies. A significant number of genes whose RNA is spliced differently between the two hypertrophies were identified, demonstrating the complexity of genetic responses to physiological pressures, as well as the sensitivity and power of RNA-Seq techniques. The functional differences in splice variants were compiled from online databases, illustrating how these resources can be used to enrich new findings.
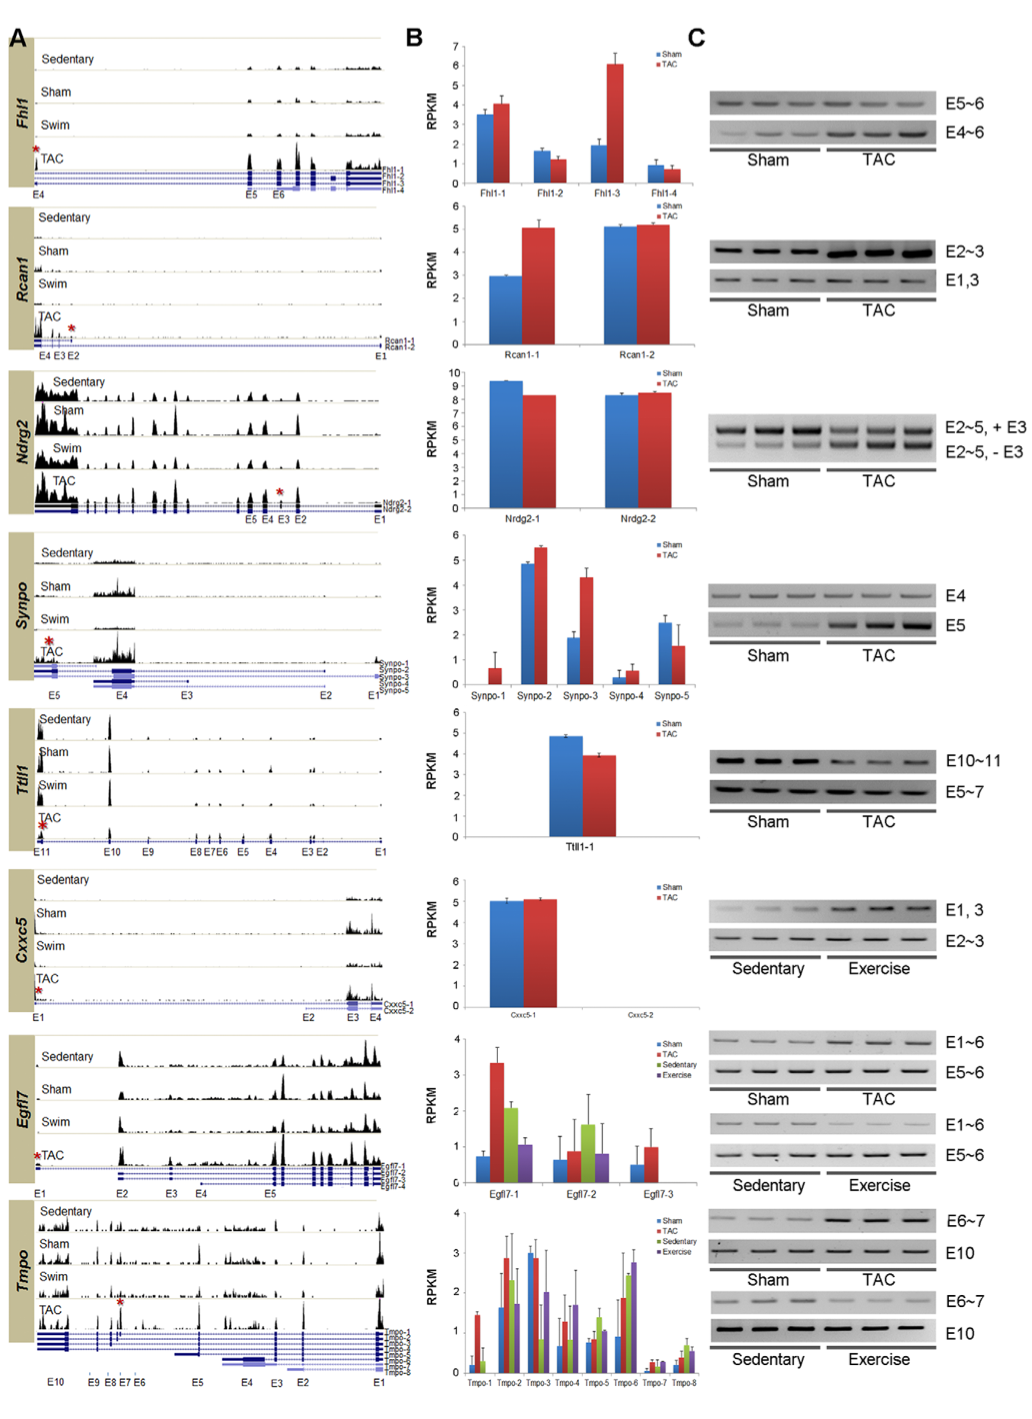
3. Summary of expression of key splice variants of genes for which qRT-PCR was performed to confirm RNA-Seq-derived results. A: Degree of expression of exons (same as in Figure 1) across four mouse conditions. Black bars above exons (blue boxes) show degree of expression. Each blue line under histograms represents a different isoform of the gene. B: RNA-Seq-derived data showing frequencies of each isoform for various mouse conditions. C: qRT-PCR results. Darker bands show greater degree of expression. The primers for amplification of PCR fragment within each isoform span the exons listed to the right of each set of bands. The results from the RNA-Seq data are corroborated by the qRT-PCR results, though interpreting the figure is tricky. Take for example the gene Rcan1: exons 2 and 3 are both on both isoforms, so TAC must express more of isoform 1 because it contains only exons 2, 3, and 4, and its bands are thicker (C). This data matches that of the histogram in B. Sham and TAC show similar band intensity for isoform 2 (containing exons 1 and 3), and therefore a similar degree of expression. This data also matches that found in the histogram.
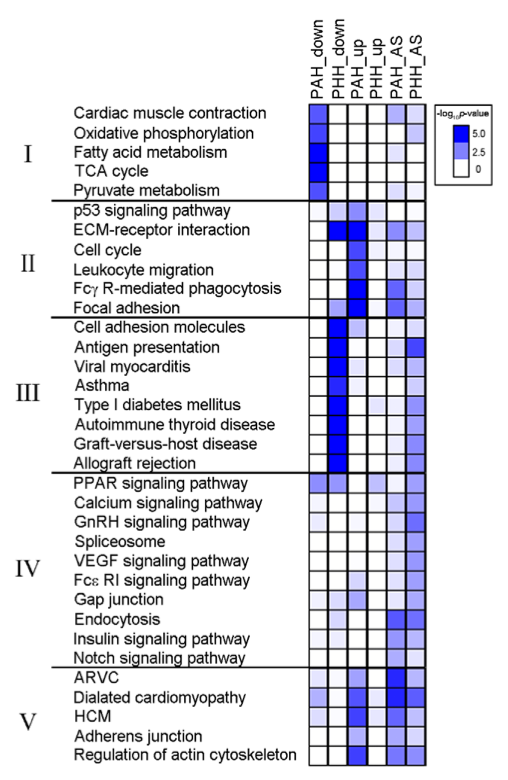
4. Cell function and production pathways as determined by KEGG analysis. Pathways with 5 or more alternatively spliced (AS) and/or DEG's are grouped into categories based on the overall process to which they contribute. PAH and PHH are characterized by starkly different pathway modifications. The two most striking are those related to immunity (II = immune and cell cycle and III = autoimmunity). In PAH, pathways related to immune response are up-regulated, potentially due to the body's attempt to fight of local infection leading to hypertrophy. In PHH, autoimmune pathways are down-regulated, potentially due to the advantage of leaving tissue produced by positive hypertrophy intact after exercise-induced growth. Assuming that the RNA-Seq results are reproducible, a simple readout such as this might serve as a useful diagnostic for differentiating between these two morphologically similar hypertrophies.
Genomics Page
Biology Home Page
© Copyright 2013 Department of Biology, Davidson College, Davidson, NC 28035