
This web page was produced as
an assignment for an undergraduate course at Davidson College.
Circulation of ctDNA in the blood stream. This image shows the site of angiogenesis in a tumor.
ctDNA circulates through the blood stream from the tumor and seeds potential metastases.
Image courtesy of Wikipedia
Background
Non-small-cell lung cancer (NSCLC) is a highly
aggressive form of lung cancer that cannot be cured by chemotherapy
alone. Studies have shown that post-operative chemotherapy results in
only a 5% increased survival rate with few other curative measures
physicians can take. Elucidating the evolution of NSCLC from
tumorigenesis to potential relapse and metastasis will inform
physicians treatment recommendations and improve NSCLC survival rates.
As tumors grow and undergo necrosis, ctDNA
(circulating-tumor DNA) fragments from the original site of the tumor
and enters the bloodstream. The presence of ctDNA in the bloodstream can
remain in plasma after surgery, seed distant metastatic sites and cause
post-operative relapse. Abosh et
al. profiled ctDNA samples from NSCLC patients in the TRACERx
tumor evolutionary study using multiplex-PCR next generation sequencing
to determine the likelihood of cancer relapse and resistance to
chemotherapy in early-stage NSCLC patients. The sequencing targeted
clonal and subclonal ctDNA single nucleotide variants (SNVs) with a
threshold of at least two SNVs to be classified as tumorigenic. They
found a correlation between variant allele frequency (VAF) load and
tumor volume, allowing them to develop a predictive model based on tumor
size. The researchers found that by characterizing the SNVs in ctDNA,
they can identify the subclone from which the ctDNA derived and map the
progression of disease.
Evaluation
Abosh et al. present
a
promising approach to characterizing and predicting cancer outcomes at the
onset of disease. Ideally, physicians can predict how a patient may
respond to adjuvant chemotherapy and the likelihood of relapse based on
the ctDNA phylogenetic profile. By retroactively tracking cancer
progression and developing phylogenetic trees based on single nucleotide
variants, the researchers highlight the heterogeneity of cancer cells and
elucidate the general progression of disease at the nucleotide level. This
information is crucial, as not every NSCLC patient will respond to
chemotherapeutics in the same way depending on the nature of their SNVs.
By characterizing the ctDNA at the onset of disease, physicians can
determine the appropriate treatment plan and improve overall disease
survival.
Though this approach is novel and provides a great
insight into the molecular progression of disease, I do not foresee this
method being applicable or accessible in a clinical setting. As the
authors mention, ctDNA profiling is a costly task on top of numerous other
expenses involved in cancer treatment. Furthermore, I imagine that
prospectively predicting ctDNA SNV changes at the onset of diagnosis could
be difficult to define. More studies need to be conducted using this
approach in different ways before it can truly be utilized in a clinical
setting.
Figures

Figure 1: Methodology
Figure 1 illustrates the methods
that the researchers took to develop ctDNA phylogenetic trees in order
to retroactively characterize the evolution of cancers. The researchers
took tumor samples from NSCLC tissue and resected them into multiple
samples. They sequenced the exomes of samples and then conducted bespoke
multiplex-PCR assay to identify clonal and subclonal SNVs to develop
phylogenetic trees. The next phase of the study involved assessing their
method efficacy by extracting cell-free DNA (cfDNA) from pre-operative
and post-operative plasma and determining whether or not the DNA derived
from tumor cells. They classified the cfDNA as ctDNA if there were more
than two SNVs in the sample. This method allowed the researchers to
predict potential relapse and adjuvant chemotherapy resistance.

Figure 2: Pathological predictors of ctDNA
Figure 2 examines the different
pathological characters of samples from lung squamous cell carcinomas
(LUSCs) and lung adenocarcinomas (LUADs). A majority of LUSCs exhibited
at least two SNVs, classifying them as ctDNA positive. About 97% of LUSC
samples were ctDNA-positive compared to only 19% of LUAD samples. Among
the classified ctDNA positive patients for both LUSC and LUAD samples,
the researchers examined SNVs within tumor clones and subclones
(metastatic sites). Clonal SNVs were detected in all patient samples and
94% of clonal SNVs were detected in the samples ctDNA. Subclonal SNVs
had a lower detection frequency of only 27 among all 46 samples.
However, in 40 samples subclonal SNVs were identified in the ctDNA
assessment assays.

Figure 3: Correlation between tumor volume and VAF
In Figure 3, the researchers
assess the correlation between clonal variant allele frequency (VAF)
detected in plasma and tumor size. They discovered a positive
correlation between mean clonal plasma VAF and tumor size. Based on this
correlation, the researchers predicted VAF based on tumor sizes
illustrated in Panel B. This predictive practice could be used
clinically to assess the underlying mutation burden and potential for
relapse in tumor samples. Next, they applied their predictive model to
subclonal plasma SNVs. The researchers controlled for potential
subclonal normal cell contamination by multiplying subclone volume with
the percentage of cancer cells found in a sample. Again, the team found
an association between subclone volume and subclone VAF burden; proving
the accuracy of their predictive method.

Figure 4: ctDNA SNV detection predicts relapse potential
In Figure 4, the researchers
shifted their methods to patient-specific samples. They took
pre-operative and post-operative ctDNA plasma samples blinded to whether
or not the patient had relapsed. They mapped the percentage of mutant
VAFs over the course of time before surgery, after surgery, and followed
through to either relapse or death (Panel F). The threshold of the
presence of at least two SNVs were detected in patients that ended up
relapsing after chemotherapy. This provides evidence regarding the
accuracy of their predictive methods in patients.
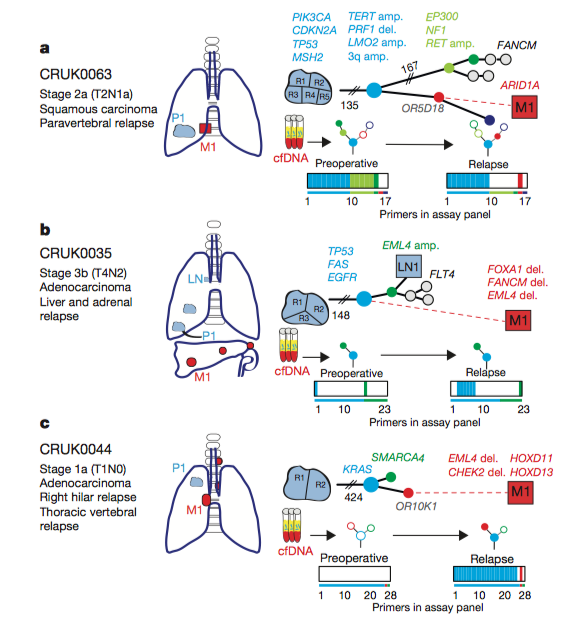
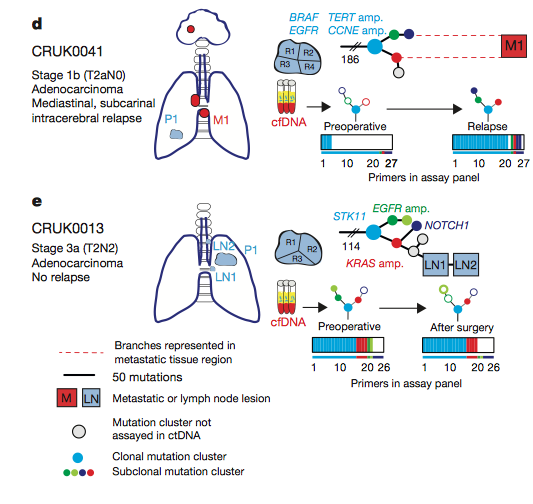
Figure 5: Phylogenetic tree illustrating the progression of disease
The researchers developed
phylogenetic trees based off of the relapse data from four patients,
with patient E not relapsing. The trees show the tumor resection point
and the site of metastasis (M1) highlighted in red. Abosh et al. developed phylogenetic trees preoperatively and at relapse
and highlighted the presence or absence of SNVs. In panel A, the ctDNA
assay revealed the same subclonal SNV four times (OR5D18), which traced
back to the original clone and primary tumor site. The researchers then
took a biopsy from the metastatic site and sequenced it and found the
same SNV from the primary tumor that gave rise to the metastatic
subclone. These results are consistent with their phylogenetic tracking
and provide a method for identifying the original tumor that a
metastatic site derives from. Phylogenetic trees were developed for all
patients, tracking the progression of disease and highlighting tumor
heterogeneity.

Figure 6: Post-mortem case showing phylogeny of subclonal ctDNA
Figure 6 illustrates the
phylogenetic tree from the same patient examined in Figure 4f, and 5a,
who was involved in the post-mortem (PEACE) study. The researchers
analyzed five metastatic biopsies after death and found that the tumor
sites all arose from a single subclone (node 12). The subclones shown in
the tree arose from the same primary tumor site, colored grey.
Highlighted regions of phylogenetic trees associated with particular
metastatic sites are shown in panel B, revealing the differential
evolution of metastasis derived from subclones. The researchers graph
the rise of subclones quantified by the mean mutation VAF and number of
SNVs over the progression of disease. These results show the development
of SNVs and subclones over the course of cancer development and
treatment. These data can inform physicians regarding post-operative
disease progression.
Reference
Abbosh, P, Birkbak, N, Wilson G, Jamal-Hanjani M, et
al., 2017. Phylogenetic ctDNA analysis depicts early-stage lung
cancer evolution 545:446-451. Available from Nature.
Email Questions or Comments: emuffman@davidson.edu
© Copyright 2018 Department of Biology, Davidson College, Davidson, NC 28035