Figure 1. General Diagram of Taste
Receptor Function (not to be confused with Fig 1 in the paper which will
be mentioned shortly)
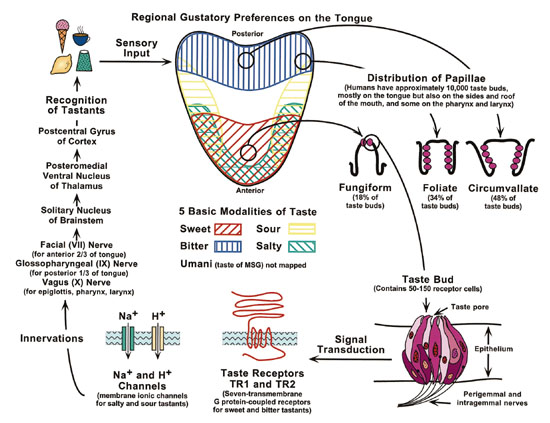 Fig. 1. Scheme of the regional gustatory preferences nested within the
10,000 taste buds distributed on the human tongue. This scheme also shows
the recent discovery of two taste receptor genesTR1 and TR2that appear
to facilitate sweet and bitter taste signals <http://www.nidcr.nih.gov/slavkin/slav1099.htm
accessed 2000 April 20>.
Fig. 1. Scheme of the regional gustatory preferences nested within the
10,000 taste buds distributed on the human tongue. This scheme also shows
the recent discovery of two taste receptor genesTR1 and TR2that appear
to facilitate sweet and bitter taste signals <http://www.nidcr.nih.gov/slavkin/slav1099.htm
accessed 2000 April 20>.
Background Physiology of Taste Perception
The sensation of taste is an extremely important
part of an animal's life. By using taste, animals can optimize their
foraging and maintain homeostasis. Mammals are thought to distinguish
between only 5 basic taste modalities: salty, sour, sweet, bitter, and
mono-sodium glutamate (termed umami). Mammalian taste cells are clustered
in buds on the tongue and palate and mediated by distinct transduction
pathways and expressed in subsets of receptor cells (See
Web Page Fig. 1). It appears that sour and salty tastants function
using specialize membrane channels, while sweet, bitter, and umami receptor
cells function using specialized membrane channels. These membrane
channels function using G protein-coupled receptors, which initiate signaling
cascades, ending in neurotransmitter release. An interesting aspect
of taste perception is that taste buds in different areas of the tongue
have different taste sensitivities. It is not known whether taste
receptors are tuned to specific or to many stimuli OR whether functionally
similar cells are innervated by common fibers.
Basic Questions that this paper will help answer:
1. What are a few receptors for sweet and bitter pathways?
2. How is tastant specificity and taste discrimination accomplished
3. What is the topographic organization of sweet and bitter responding
cells in the various taste buds and papillae?
What was done:
The experimenters in this paper took the following steps to answer
the above questions:
Genetic Studies
1. First, they isolated genes involved in taste signaling of two novel
G protein-coupled receptors (GPCR) which are called TR1 and TR2 (this was
done in a previous paper).
2. Next, to identify receptors expressed in cells, they searched for
GPCRs in genomic intervals linked to bitter taste perception using DNA
sequence analysis of representative human, rate, and mouse T2R genes (data
shown in Figure 1 of paper; *all figures hereafter will refer to figures
within the original paper).
3. Next, a cladogram was constructed of T2Rs of human, mouse and rat,
which showed that T2Rs are distantly related to a vomeronasal receptor
(V1R) (data shown in Figure 2).
4. To get estimates of the size of the T2R gene family, analysis of
the Genome Sequence Survey database and other data bases were carried out.
It was found that the T2R family consists of approximately 40-80 different
members (with an additional ~40 pseudogenes.
5. Since the genetics of taste has been extensively studied in mice,
the experimenters were able to look at several different loci for sweet
and bitter tasting. They found that the human 8 gene T2R cluster
contained three interspersed PRP genes, which was homologous with the mouse
chromosome 6 bitter cluster. From this, they used human T2Rs to screen
mouse genomic libraries and isolated 61 BAC clones containing 28 mouse
T2Rs. Radiation hybrid and recombinant inbred strain mapping studies
showed that the mouse genes were clustered at only a few genomic locations
(data shown in Figure 3)
Expression Patterns
6. Next, they created several different probes for various T2Rs to
determine if the receptor was actually in the taste receptor cells (see
Figure 4), and performed in situ hybridization to sections of various taste
papillae.
7. From these experiments they were able to quantify the amount of
T2R receptor in each taste bud. This was approximately 15% of the
cells (examples shown in Figure 5, 6, 7). Of these cells, they found
that each cell produced multiple T2R receptors.
8. The experimenters were also curious about the possible correlation
of gustducin receptor cells (a known bitterness receptor) and T2R gene
expression within those cells. To test this, they performed in
situ hybridizations with differentially labeled T2R and T2R probes.
They were able to detect a correlation between gustducin and T2R receptors.
Interpretation of Figures 1-7
Figure 1. T2Rs Define a Novel GPCR Gene Family
This figure shows the predicted amino
acid sequences of representative human, rat and mouse T2R genes, which
have been aligned to highlight areas of possible overlap between aligned
sequences. I see four large areas of overlap. The first is
the proposed receptor areas for TM1 and TM2. The second is the area
between TM3 and TM4. The third area lies between TM5 and TM6.
The last area of highly conserved amino acid sequence is beneath TM7.
The layout of the data is not as easy to read as I would have liked.
I think it would have been more helpful to group the species together.
This would have made it easier to determine inter species variance of the
T2R gene. Also, I would have preferred to see the data with just the exactly
aligned sequences instead of 1/2. I agree with their overall
interpretation of the predicted transmembrane segments as possible receptor
sites. It seems as though there is a lot of overlapping areas, but
it is difficult to tell because of the 1/2 aligned sequence shaded area.
Figure 2. T2Rs Are a Structurally Diverse Family of Receptors Distantly
Related to V1R Pheromone Receptors and Opsins
This cladogram of human, mouse and rat T2Rs,
opsin and V1R vomeronasal receptors show the possible linkages. I
did not find this figure particularly useful, and Adler et al. does not
really do anything with the figure or show that it is important.
I do not think this is useful, but one interesting thing is that all of
the rat and mouse receptors are shown to be closer related than either
the rat or mouse to a human. Again, this isn't surprising since rats
and mice are closer related to each other than to humans.
Figure 3. T2R Genes Map to Loci that Influence Bitter Taste.
This was definitely the most challenging figure of the
paper. Basically, the experimenters did an analysis of the Genome
Sequence Survey database to determine the size of this family of genes.
The figure shows a schematic view of several chromosomes of human, and
mice which contain T2R receptor loci. They note that the T2R receptors
are near the salivary proline rich protein (PRP) loci, as well as other
known bitter genes, which increases the likelihood that T2R is a bitter
receptor. I agree with them. It is one thing to be book ended
by the bitter genes, but to have them interspersed within the T2Rs genes
convinces me that T2R is involved in bitterness. However, this particular
figure does not prove that T2R is a receptor.
Figure 4. Functional Anatomy of the Rodent Oral Cavity.
This is simply a diagram of a rodent head highlighting
the regions containing taste buds. There isn't too much to interpret
here. It is nice of them to include this figure as it allows the
reader to get a mental picture of where the receptors are. It is
also helpful as a reference for the next three figures (5, 6, 7).
It also sparked my curiosity...who is E.A.?
Figure 5. Expression of T2Rs in Subsets of Taste Receptor Cells.
This figure shows in situ hybridizations with
single T2R digoxigenin-labeled antisense RNA probes of different subsets
of taste receptor cells. The dotted lines indicated an outline of
a sample taste bud. The experimenters used several different T2R
probes on tissue samples and demonstrated that these genes are in fact
being transcribed. HOWEVER, they do not prove that these genes are
translated into actual proteins. An alternative hypothesis might
be that the sites are translating the proteins and they are moving to different
cells. RNA probes do not mark the protein so it is dangerous to assume
that the protein is located where the RNA is. Even though there are
alternate hypotheses that can be made, I think that they have made the
correct assumption (given what we know about the taste sensation system
and its high degree of localization).
Figure 6. Many T2Rs Are Coexpressed in the Same Taste Receptor Cell.
The experimenters mean for this figure to be compared
to fig. 5. This figure differs from fig. 5 because they used multiple
T2R florescent probes to show that more than one T2R receptor RNA is present
in each tissue. The mixtures of (a) 2, (b) 5, or (c) 10 T2R probes hybridized
with taste buds. The tissue becomes brighter as more probes are used, which
is what we would expect to see if there were multiple T2R receptors in
a tissue. Figure 6D shows basically the same kind of support for
the experimenter's proposal for multiple T2Rs...actually, it is probably
one of those "Put me on the cover" florescent shots that are so popular
nowadays... I would like to actually see some controls (and this goes for
figure 5 also). They did use controls (mentioned in the Experimental
Procedures section of the paper pg. 701), but I would like to see them
next to the experimental tissue. If they want to convince me that
this is a taste receptor, I want to see the lack of RNA expression in other
areas of the mouse (like maybe the nasal cavity or some other receptor
laden area), but I will talk more about that in the concluding remarks.
As in figure 5, the dotted lines are sample taste buds.
Figure 7. T2Rs Are Expressed in Taste Receptor Cells that Contain Gustducin.
In this last figure, the experimenters
show double-label florescent in situ hybridizations to examine the expression
of T2Rs with gustducin and T2Rs. Gustducin is known to be involved
in bitter and sweet transduction because gustducin knockout mice show decreased
sensitivity to some sweet and bitter tastants. Gustducin can also
be stimulated in vitro by exposing the taste membranes with bitter compounds.
The figures show that T2Rs and Gustducin are expressed in the same subset
of taste receptor cells (fig. 7a, 7b, and 7c), but that T2Rs is not expressed
on the same subset of cells with T1Rs. The main point of figures
5-7 is to demonstrate that multiple T2Rs are present in taste cells, and
that T2Rs may possibly be linked with Gustducin. I think that they
accomplish this.
Concluding Remarks
I think that this paper is good for
several reasons. First, they did a great job of researching the T2Rs
gene and hypothesizing its role as a bitter receptor. I thought they
had a logical hypothesis, and went through the proper steps to test it.
However, I do think that they have come up a little short in proving that
T2R is a taste receptor because they did not do any kind of a functional
test. I think that this paper leaves a lot of room for future exploration
into the question of bitter taste perception. Controls need to be
more visible. For instance, I said earlier that I wanted to see the
lack of T2R expression in other areas of the mouse. In the methods
section it says, "T2Rs are not widely expressed outside taste tissue (data
not shown)." I want to see how widely expressed they are, and where
they are expressed. If it is not in a place that is relevant to taste,
then you would have to question the validity of their hypothesis.
Direction for Future Research
I thought they could have done a few important tests to really convince
the reader that T2Rs are actually receptor sites.
A functional test would really boost their proposal that T2R is a bitter
taste receptor. First, I would purify the T2R protein and create
florescent antibodies to it. Then I would look for binding of in
situ wild type tissue. If T2R really is a taste receptor, the mouth tissue
should light up, while other areas would be dormant. In my opinion,
they should have gone that extra step from mRNA to actual proteins. They
could also have performed behavioral tests with T2Rs knockout mice.
A test whether these knockout mice are desensitized to bitter and sweet
foods would be a great test. If the T2Rs knockout mice were less sensitive
to these flavors, then they would be able to say that not only does the
genetic evidence point to T2Rs as being a bitterness receptor, but functional
tests also support this hypothesis. I think it is amazing that we
still know very little about this area of physiology. In conclusion,
this paper is very compelling and hopefully, will spur further research
into the mysterious world of taste sensation.
Return to
Davidson College Biology Department Home Page
Return
To Biology Course Materials
© Copyright 2000 Department of Biology, Davidson College, Davidson,
NC 28036
Send comments, questions, and suggestions to:ankazama@davidson.edu
|