Table 1 (see paper for visual)
Depicts characteristics of the L bulgaricus ATCC11842 genome.
They found the genome to contain 1,864,998 base pairs.
The overall GC content was 49.7%.
The GC content for coding regions was 51.6%.
The GC content of coding sequences at codon position 3 (evolves more rapidly) was 65.0%.
The number of coding sequences was 1562 which makes up 73% of the genome.
598 of the coding sequences have an unknown function.
270 pseudogenes are present along with 9 rrn operons, and 95 tRNA genes.
Figure 1
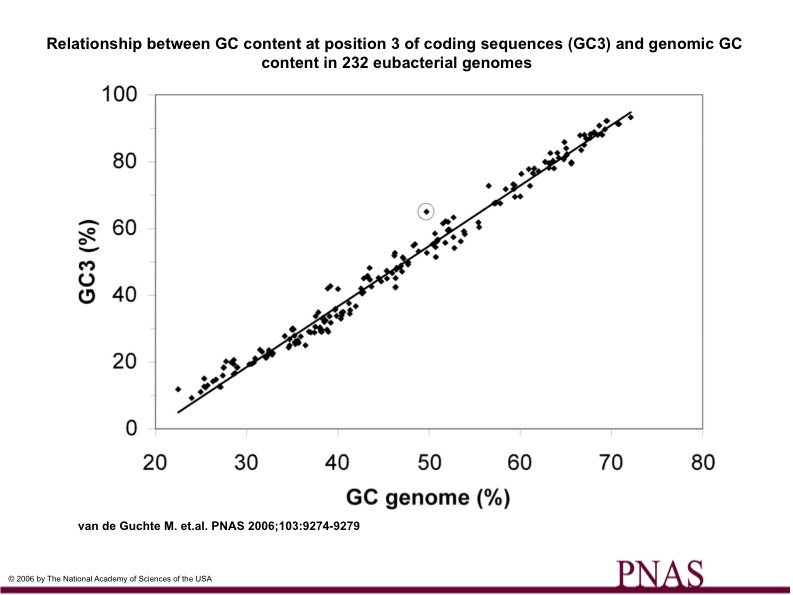
Figure 1.
The GC content of 232 eubacterial genomes and the GC content of codon position 3 for each genome is plotted. L. bulgaricus is circled.
L. bulgaricus ratio of GC content in the GC3 position to its GC content of its genome is noticeably high.
Figure 2
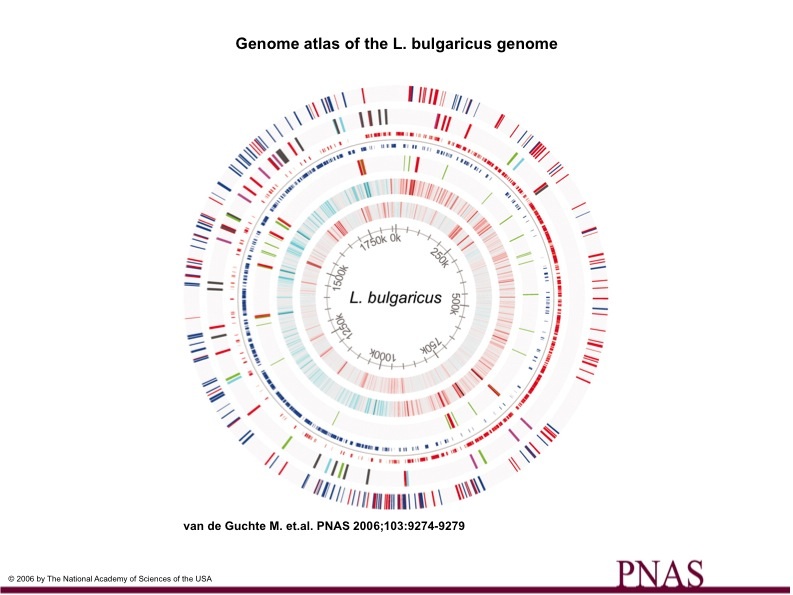
Figure 2. is a graphical description of the L. bulgaricus genome
Each circle represents the entire L. bulgaricus genome.
Circle 1. Red lines mark pseudogenes on positive strand, blue lines mark pseudogenes on negative strand.
Circle 2. Insertion Sequence (IS) elements (transposases and ISL4 related hypothetical genes). Gray= elements with four or fewer copies, Red (ISL7 >5 copies), Purple (ISL4> 5 copies), Blue (ISL5> 5 copies), Green (ISL4-5> copies).
Circle 3. Coding sequences (CDS), Red=positive strand, Blue= negative strand.
Circle 4. rRNA genes (red), tRNA genes (green)
Circle 5. GC (window size 2000) less than -0.1(cyan), more than +0.1 (red)
Circle 6. AT (window size 500) from <.3 (cyan) to >0.7 (red)
Circle 7. Position on the genome
Figure 3
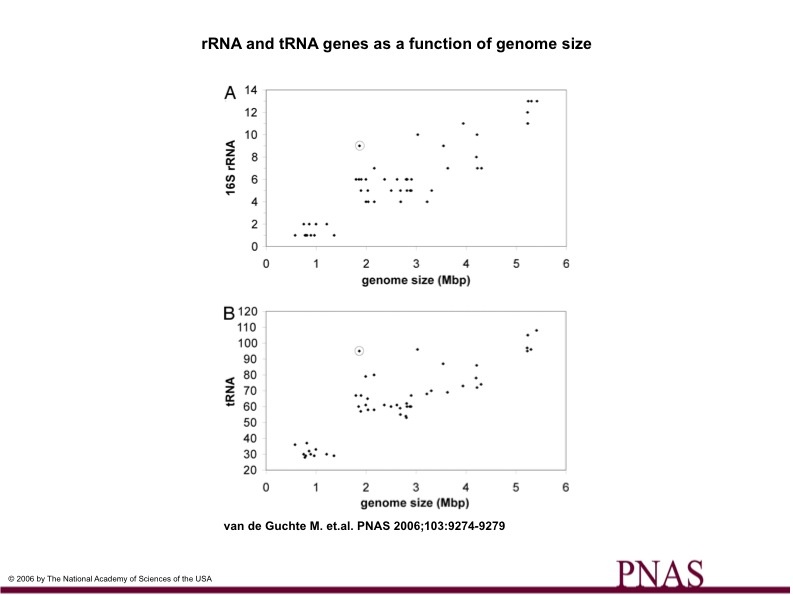
Figure 3.
Plots the number of rRNA and tRNA genes as a function of genome size
Chart A shows the number of 16S rRNA genes and genome size in 54 firmicutes genomes. L. bulgaricus genome is circled.
Chart B shows the number of tRNA genes an genome size in 54 firmicutes genomes. L. bulgaricus genome is circled.
The ratio of rRNA and tRNA genes to genome size is very high in L. bulgaricus compared to the rest of the firmicutes genomes.
L. bulgaricus appears to have approximately as many 16S rRNA genes as an organism with a 3.5-4.5 Mb genome (it has a 1.8 Mb genome.
Also L. bulgaricus appears to have approximately as many tRNA genes as an organism with 3.5-5.5 Mb genome (it has a 1.8 Mb genome).
The high ratio of rRNA and tRNA genes to genome size suggests a rapid decrease in genome size.
Figure 4
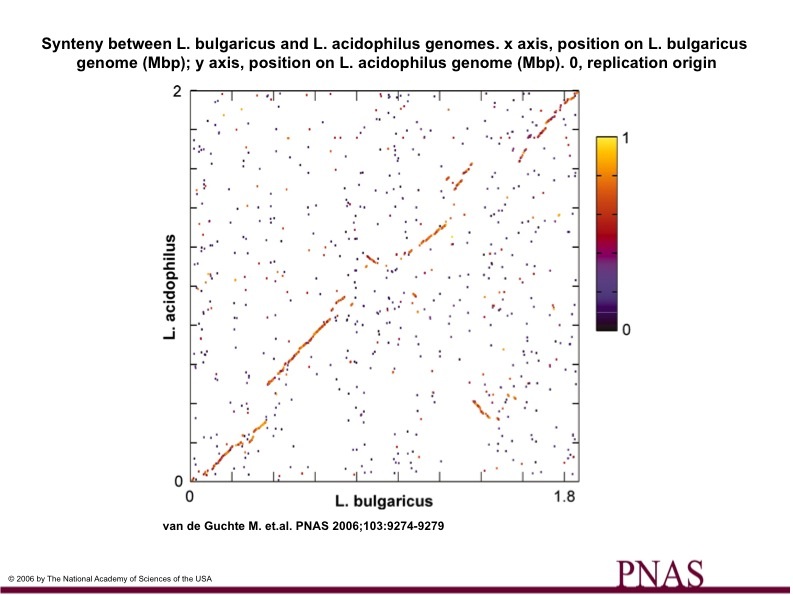
Figure 4.
Synteny between L. bulgaricus and L. acidophilus genomes.
Colors of dots indicate BLAST score ratios.
There is high sequence similiarity from appx. .1 Mb- .2Mb, .4 Mb-.7 Mb, 1.1 Mb- 1.3 Mb, 1.6 Mb-1.8 Mb.