*This webpage was produced as an assignment for an undergraduate course at Davidson College
Review: "PDZ Domain Binding Selectivity Is Optimized Across the Mouse Proteome"
Background:
PDZ (Postsynaptic density 95, PSD-85; Discs large, Dlg; Zonula occludens-1, ZO-1) domains are conserved structural domains within proteins that contain about 80-90 amino acid residues, and they are characterized by their structure, which, upon folding, creates a globular structure known as a ß-sandwich (Pawson Lab, 2011). This “sandwich” consists of 6 ß-strands and 2 α-helices. These domains have high sequence similarity among eachother, and there can be single or multiple copies on a protein. PDZ domains are one of the most frequently encountered regions within proteins, and they are found within a wide variety of organisms from bacteria to humans. They function as interaction modules that assemble protein complexes by “recognizing” short segments of specific sequence on the c-terminal of the target domain, which can be a peptide or lipid. The PDZ domain and its complexes have been found to facilitate signaling and aid in receptor localization. There are four different types of PDZ interactions. For additional information regarding the PDZ binding domain, visit The Pawson Lab.
This is an image of the third PDZ domain of the PSD-95 protein that has binded to its ligand. Image from PDB.
Paper Summary:
Previous research has placed PDZ domains into functional categories that are characterized by the domain's preference to bind to peptides of a certain sequence. These categories characterize the PDZ domains as Class I, Class II, and Class III domains. MacBeath et. al. wanted to analyze the binding selectivity of the PDZ domain, because domains in the same class would seem to have a functional overlap due to cross-reaction of the PDZ domain's target molecules. To study the selectivity of the PDZ domain, the researchers analyzed the PDZ domain-peptid interactions within the mouse genome. Doing this involved a combination of protein microarrays, quantitative fluorescence polarization, and bioinformatics. Initially, the researchers cloned, expressed, and purified 157 PDZ domains that are encoded in the mouse genome. Following the PDZ domain synthesis, the researchers synthesized and purified 217 fluorescently tagged peptides that were derived from 10 C-terminal residues on mouse proteins. They properly called this group of peptides the “training set.” Following this, they then performed protein microarrays to analyze the interactions between the PDZ domains and the fluorescent peptides. In using the microarrays, about 30 PDZ domains had no interactions, however this was overlooked, because the goal was develop a broad view of the binding selectivity. To eliminate and confirm some of the PDZ domain–peptid interactions that were found in the DNA microarray, quantitative fluorescence polarization was performed, and it was found that 85 PDZ domains bound to at least one peptide. Once this round of experimental data was gathered, a model, named the MDSM (multidomain selectivity model), was created and designed to determine which PDZ domains would bind to which peptides. The model was trained with the experimental data and refined multiple times until the model's predictions reached a proper agreement with the experimental results. The refined model was capable of replicating only 74 of the 85 PDZ domains that binded at least one peptide. The predictive model was then used to predict all the protein–PDZ domain interactions within the mouse proteome. In all, the model produced 493 new interactions and 3,059 noninteractions. Following this, the researchers used their predictive model to determine the physiochemical properties of each peptide binding position that characterized each PDZ domain's selective binding.
Figures:
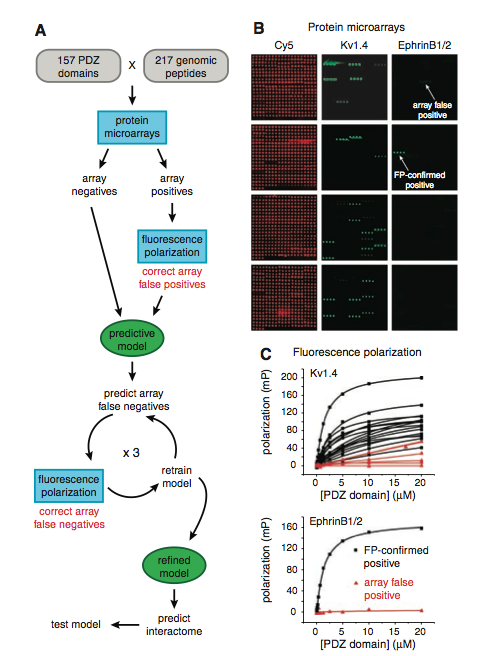
Figure 1: (A) This is a pictoral summary of the methods used by the researchers throughout the paper. First, the researchers cloned, expressed, and purified the majority of the PDZ domains that were encoded by the mouse genome. Following this, they synthesized and purified 217 fluorescently tagged peptides (the peptides were derived from the mouse proteins's C-terminal residues). The interactions between the peptides and PDZ domains were analyzed using protein microarrays. The resulting array positives were subjected to fluorescence polarization to correct for array false positives. All of these results were used to train the predictive model, and the model's accuracy was tested to predict other false negatives from the microarray data. The model’s predicted false negatives were then experimentally tested with fluorescence polarization, and the resulting information was used to “retrain” the model. This cycle of prediction, experimentation, and retraining was performed three times until the predictive model was refined. At which point, the refined model was used to predict the PDZ domain–protein interactions in the mouse proteome. (B) This is a representative protein microarray of the many that they performed. Each microarray was performed three times. The microarray was probed with peptides that were fluorescently tagged, and if the resulting interaction between the PDZ domain and peptide had three times the median fluorescence seen on the array, the interaction was classified as an array positive. An array negative was classified if it bound to at least one peptide (some fluorescence). An individual PDZ domain was horizontally spotted in quadruplicate, thus a line of four fluorescing spots was searched for to determine PDZ domain–peptide interaction. The red fluorescing microarray (far left) was simply stained with Cy5, a fluorescent dye, so that the location of each PDZ domain could be visualized. The middle image depicts a microarray that was probed with their fluorescently green tagged peptide derived from the mouse protein Kv1.4. The spots that are strongly fluorescing would be classified as array positives. The microarray on the far right depicts the the green fluorescently tagged peptide that was derived from ephrin B1/2. The arrows point to spots that were classified as array positives, but when tested with fluorescence polarization gave contrasting results. The first array positive (top arrow) was determined to be a false positive, while the second array positive (bottom, second arrow) was confirmed as an array positive. This figure demonstrates the necessity for the fluorescence polarization, because the designation of the interaction between the PDZ domain–peptide is somewhat subjective. (C) These are representative titration curves for the fluorescent polarization that was used in the study. The top graph is for the kv1.4 derived peptide and the bottom one is for the ephrinB1/2 derived peptide. Only the array positives were tested with fluorescence polarization. In each case, there are confirmed positives (black line with squares) and corrected array false positives (red line with triangles). Each symbol (triangle or square) represents a recorded measurement of peptide polarization to the PDZ domain when the domain was at the specificed concentration, each line represents a different PDZ domain that the peptide interacted with. If the interaction depicted saturated binding then the interaction was a confirmed positive. In all, there were 85 PDZ domains that bound at least one peptide, however only 74 were capable of being successfully modeled.
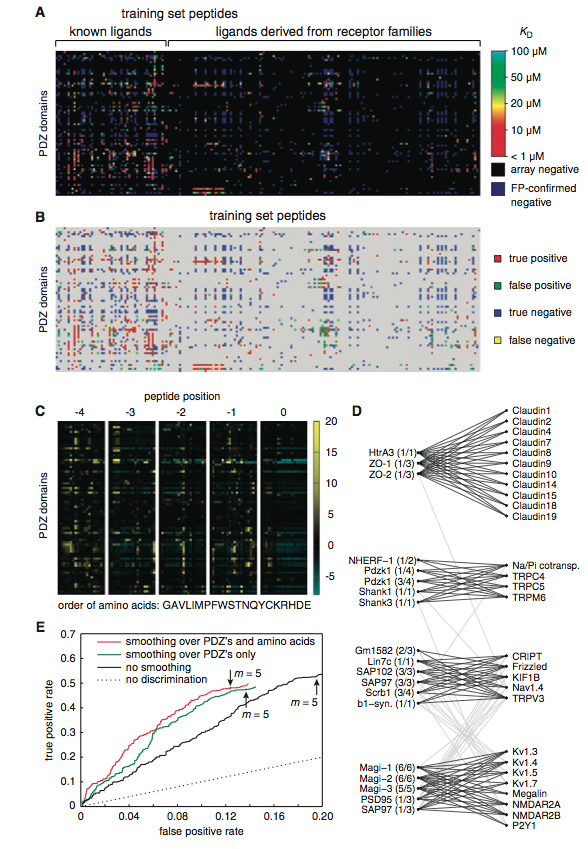
Figure 2:(A) This is a summary of the experimental interactions observed between the synthesized PDZ domains and the peptides. The PDZ domains are on the y-axis and the synthesized 217 fluorescent (training set peptides) are across the x-axis. The color gradient represents the dissociation constants (Kd) of the confirmed fluorescence polarized array positives. The array positive confirmations displayed different affinities for differing PDZ domaisn (high=red, low=light blue). The array negatives, determined by the protein microarray analysis, are depicted as black, and the false positives are shown as dark blue. It is important to note that many PDZ domains bind multiple peptides (ligands) and that the affinity to each peptide differs. (B) The refined model's predictions for PDZ domain–peptide interactions using the training set data. Like the picture above, the PDZ domains are on the y-axis and the peptides (training set peptides) are on the x-axis. The colored spots indicate the predicted protein microarray result after the model was updated and refined: red is a true positive, green a false positive, blue a true negative, and yellow a false negative. This figure is to be compared with figure 2(A). Notice that there is an extremely high degree of similarity between both figures: (A) as the experimental results and (B) as the predicted results. The refined model identified the PDZ domain–protein binding events extremely well: 96% of the fluorescence polarized confirmed positives. (C) This figure represents a heat map that depicts the parameters of the refined, predictive model. The y-axis is charted with the PDZ domains, and the x-axis is the order of amino acids when placed in each peptide position (amino acids are from left to right: GAVLIMPFWSTNQYCKRHDE). The color gradient chart to the right of the figure indicates the contribution of binding when a particular amino acid is in a particular peptide position. This color gradient is representative of the equation, θi,p,q (if the PDZ domain, i, prefers amino acid, q, at position, p, more than other PDZ domains, then θ is positive; it is negative if it prefers amino acid, q, at position, p, less than other PDZ domains, and 0 if the amino acid has no preference to the domains). Yellow to black indicates a positive contribution to the selective binding, while black to light blue signifies a negative contribution. Peptide position 0, for the most part, does not contribute to the PDZ domains binding selectivity, however, peptide position -4, -3, -2, -1 contribute substantially. (D) This figure is an interaction network that was designed from a modified Markov cluster equation. This was performed to reveal biophysical clusters that help visualize the data to a greater extent. There are 4 clusters, and the names on the left of each clusters are the PDZ domains and the names on the right are the peptides from the original training set. The figure attempts to characterize the PDZ domain by its ligand, however this functional categorization is diificult, because each cluster is capable of interacting, to some degree, with another cluster’s ligands, as represented by the light gray lines between the clusters.The dark, black lines indicate PDZ domain-peptide interactions between the clusters. (E) Represents ROC curves for the refined model’s predictive interactions for a group of previously untested proteins. The y-axis represents the true positive rate of prediction and the x-axis represents the false positive rate. In each of the three conditions m (pointed to with the arrow) was set to 5. This was done, because this number provided a relatively even balance between false positive and false negative predictions by the model. The data depicted is from a group of 48 different proteins from the mouse proteome that were not included in the data set, yet they had been predicted by the model to interact with PDZ domains. Thus, this group of proteins acted as a test for the model. To test the predictive accuracy of the model, the researchers fluorescent polarized the 48 test set proteins, and compared the model’s predictions with the experimental results. The model predicted 48% of the new interactions and 88% of the non interactions. The black line represents the predictive success of the model, when the data was not subjected to any changes. The red and green line represent the same data, however they have been subjected to some degree of smoothing (red depicts smoothing over the PDZs and amino acids and green represents smoothing over the PDZs only). The red line, which has smoothed over PDZs and amino acids, increased the accuracy of the model without changing the true-positive rate. Additionally, the smoothing effect increased the true positive/false positive ratio by about 40% without changing the true positive rate, indicating that the smoothing is beneficial to the accuracy of the model. The dashed line represents the probability that the model’s performance was due to chance.
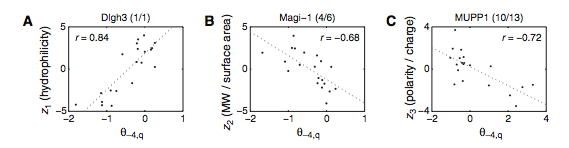
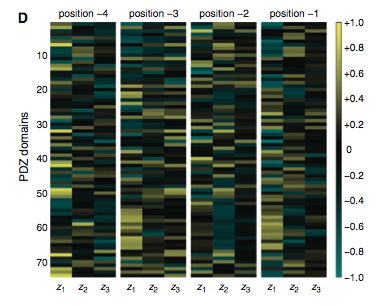
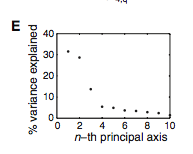
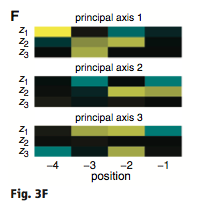
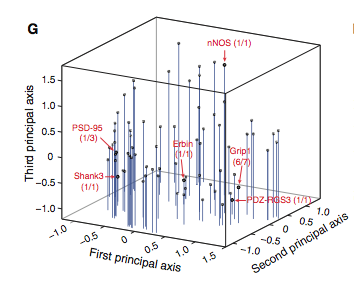
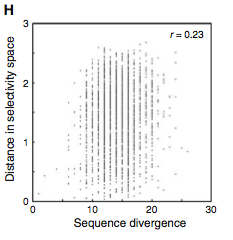
Figure 3: (A-C) These figures were created to show how the PDZ domain’s binding selectivity relates to peptides physicochemical properties. In each of these figures, extreme cases were displayed to see how the results were analyzed. The physicochemical properties are reported as “z scales,” where each z scale characterizes a certain chemical property: Z1 describes hydrophobicity, Z2 molecular weight/surface area, and Z3 polarity/charge. Figure A looks at hydrophobicity, B at molecular weight/surface area, and C at polarity/charge. The figures look at the correlations between the z scale and the model’s parameters, and the degree of correlation was determined from the r value (correlation coefficient). (A) The DLGH3 (1/1) domain’s selective binding is correlated with hydrophobicity, Z1, at position -4 (r=0.84). (B) Magi–1 (4/6) is correlated with MW/surface area, Z2, at position -4 (r= -0.68), and (C) MUPP1 (10/13) is correlated with polarity/charge, Z3, at position -4 (r= -0.72). (D) This is a correlation matrix that expresses similar data from the previous figures, but it correlates the physicochemical properties (z scales) of every PDZ domain tested in regard to the position of the peptide. It depicts this by displaying all of the PDZ domains and the four positions of amino acids that contribute to the domain's selective binding. The seperations indicate the amino acid position (separated figures, from left to right: -4, -3, -2, -1). The y-axis is numbered, and each number represents a particular PDZ domain. Across the x-axis is the z-scale (Z1 describes hydrophobicity, Z2 molecular weight and surface area, and Z3 polarity and charge). Position 0 was removed from the figure, because as determined from figure 2C, position 0 contributes weakly to the PDZ domain’s selectivity in binding. In the figure, it is noticed that a majority of the PDZ domains rely on all three z-scales to discriminatively bind to their ligand. (E) This graph represents the data from D that has been decomposed. This was done to comprehend the PDZ domain's peptide-binding selectivity at a larger scale. In doing this, the researchers found that there are 12 axes that explain the distribution of the PDZ domain binding preference. Each axes is marked on the x-axis, and the percent variance explained is on the y-axis. Analysis of the graph results in the conclusion that the peptide-binding selectivity of the PDZ binding domain can be primarily explained by three of the 12 axes: 1, 2, and 3. Axes 1 and 2 explain about 30 % of the variance, and axis 3 explains about 15%. (F) This depiction uses the same color scale as (D), and it represents the correlation between each amino acid position (from left to right -4, -3, -2, -1) and the z-scales in relation to the axes that explain the PDZ binding selectivity. The z-scales are along the y-axis, and the x-axis depicts the peptide position. Again, position 0 is not included, because this position does not contribute to the selective binding of the PDZ domain. The first principle axis (top of the three individual matrices) distinguishes class I PDZ domains as having a preference for peptides with hydrophilic residues (Z1) at position -2, where as Class II domains, prefer peptides with hydrophobic residues at (Z1) position -2. The third axis (last of the matrices) distinguishes class III PDZ domains from the other classes with a preference for a negatively charge residue (Z3) at position -2. Thus, the z scales (physiochemical properties) at each amino acid position define the selectivity of the PDZ domain. (G) This figure represents the 74 PDZ domains’s distribution throughout three principal axes, or selectivity space. The graph takes into effect the three main principal axes, and the 3-dimensionality allows one to see how the PDZ domains lie on a continuum of binding selectivity rather than within concrete functional classes. The labeled vertical lines represent PDZ domains that have been previously placed into functional classes (Class I, Class II, and Class III). The Class I PDZ domains (Shank3 (1/1) and PSD-95 (1/3)) lie at the negative end of the first principle axis, and the class II domains (Grip1 (6/7) and PDZ-RGS3 (1/1)) lie at the positive end. nNOS (1/1) represents a class III PDZ domain. Erbin (1/1) lies between both the positive and negative ends of the first principle axis. The majority of the PDZ domains do not categorize into one classification, because the PDZ domains are evenly distributed across the selectivity space. This indicates that the PDZ domains's selectivity results from the interactions throughout the domain's binding pocket, which is contrary to previous research. (H) This is a correlation between the PDZ domains’s distances within the selectivity space (three principal axes)(y-axis) and the their sequence divergence (x-axis). Based on this depiction there is a weak correlation coefficient, r=0.23, between these two variables. Thus, sequence similarity between PDZ domains does not predict PDZ domain function similarity.
Conclusions:
Overall, this paper expressed very good science, and it successfuly portrayed the promisng potential that is containe within the field of bioinformatics. MacBeath, et al. convincingly demonstrated the effectiveness of predictive modeling, and I believe that their approach is a strong argument for the continued use of predictive modeling. What makes the paper extremely interesting is that the researchers took a genomics approach involving the use of microarrays and fluorescence polarization to gain experimental data, and then created and refined a model from the original set of experimental data. This process of modeled prediction, experimentation, and model refinement appears to have significant promise, because it allows the reseachers to make more concise predictions about potential biological interactions.The authors mention that the accuracy of the model is due to its focus on a related family of domains, rather than a broad group of proteins. Thus, as evidenced in the paper, a systemic approach provides an accurate resolution of where to begin the actual experiments. It is important to take into effect the limitations of this work, however, because the predictive model, while helpful and trainable, is not fail-proof. In the paper, the model predicted about half of the protein-protein interactions that were found. Thus,while the model predicted these proteins to have some sort of interaction, it did not predict all of the capable interactions, and for this reason all predicted data should be experimentally determined as well.
References:
Stiffler MA, Chen JR, Grantcharova VP, Lei Y, Fuchs D, Allen JE, Zaslavskaia LA, Macbeath G. PDZ Domain Binding Selectivity is Optimized Across the Mouse Proteome. Science. 2007; 317: 364-369.