This web page was produced as an assignment for an undergraduate course at Davidson College.
Click to see the paper "The genomic complexity of primary human prostate cancer" (Berger et al., 2011)
All of the following summaries, opinions, ideas, and table/figures are based off of the paper (Berger et at., 2011).
____________________________
Paper Summary
This paper demonstrated to me how prostate cancer contains a wide spectrum of different genomic variations across different prostate cancer tumors. I learned that techniques like FISH, and detailed sequence analysis of different genes/regions of a tumor genome allows for further understanding of the types and locations of variations within one particular tumor. More importantly, such analysis will also show what variations are common between different tumors and what variations differentiate one tumor from another tumor. Some analysis of tumor characteristics was genetics-focused, which taught me how point mutations, indels and inversions could locally disrupt a single cancer-related gene. However, the paper also demonstrated how analysis of genomic aspects can show how rearrangements/fusions, as well as differential transcriptional regulation due to chromatin can disrupt several cancer-related genes at once.
I learned that cancer research, such as prostate cancer research in this paper, has not narrowed down the causes or definition of cancer. Instead, research has expanded the definition of prostate cancer by increasing knowledge about possible genomic variations/patterns are associated with prostate cancer. The multi-faceted aspect of prostate cancer may make it more difficult by complicating issues like individual treatments, since different tumors have different genomic variations that may require different treatment. Nevertheless, detailed knowledge about prostate cancer and its specific genomic patterns is also beneficial because it brings more avenues for further research. This increased knowledge also makes it possible to discern what genomic signs lead up to tumorigenesis, as well as discovering more effective diagnostic and potential therapeutic options for patients.
Paper Opinion
I had a generally great opinion of the paper, due to learning a lot of new material through the paper's descriptions, analysis, and figures. While some of the text was dense and required several readings, the general ideas were still sufficiently conveyed to me. The descriptions were backed up not only by the main figures, but also many supplementary figures, which were referenced in the text, but were located on a separate pdf file due to space constraints. The supplementary figures made me appreciate the paper more because it demonstrated how much data was collected/analyzed in addition to the already detailed main figures. The main figures like figure 1, 2 and 4 were clear in showing rearrangements and other variations in the tumor genome(s); because I had previously learned about and been exposed to the material displayed in these figures, it made it initially easier for me to understand. However, some figures like figure 3's usage of ChIP-seq peaks, and figure 4's usage of FISH required additional background knowledge that I was unfamiliar with, so it was initially difficult to understand and process the figure's main points. While table 1 was important in setting up the tumor information for the following text/figures, I though that there was not as much essential or insightful information in the table when compared to the later figures in the paper. From my perspective, this well done paper covers an area of much potential and direction for future advancement, and consists of one of many important steps towards a possibly more effective, personalized range of prostate cancer treatments.
____________________________
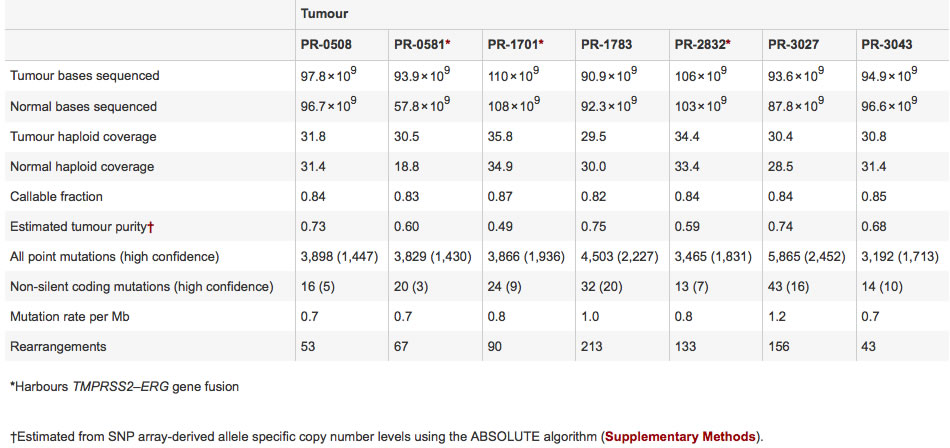
Table 1: Landscape of somatic alterations in primary human prostate cancers (Berger et at., 2011). Click on the image to see the original table.
Table 1 compares several aspects of prostate cancer tumor genomes and corresponding normal genomes taken from seven patients. Both the tumor and normal genomes from each patient had the same magnitude (10^9) of sequenced bases, and similar haploid coverage of around 30-fold. The callable fraction, how certain the researchers were of the bases they sequenced, ranges from values of 0.82 to 0.87. The tumor purity is an estimation of how much of the tumor genome sequence is different due to mutation from the normal genome sequence, and ranges from values of 0.49 to 0.75. The total number of point mutations in the tumors ranges from 3,192 to 5,865, while the high confidence values ranges from 1,430 to 2,452. The tumors’ non-silent coding mutations ranges from 13 to 43, while the high confidence values ranges from 3 to 20. The mutation rate per Mb ranges from 0.7 to 1.2 for all the tumors. The number of rearrangements in the tumors ranges from 43 to 213. A distinction is made with PR-0581, PR-1701, and PR-2832 tumor genomes having a TMPRSS2-ERG gene fusion, while the other four tumor genomes do not have a TMPRSS2-ERG gene fusion. TMPRSS2 is a “transmembrane protease, serine 2” and ERG is a transcription factor called “a v-ets erythroblastosis virus E26 oncogene homologue” (Berger et al., 2011). Overall, table 1 shows a quick overview of the tumors, explaining background information about sequencing and how many mutations and rearrangements occur in each tumor. One benefit of the table is that it displays information in a different fashion from the other paper figures. However, there are no immediate discernible patterns from looking at the numerical values of the table; for instance, the rows describing the number of rearrangements do not describe the patterns as seen in the other figures.
____________________________
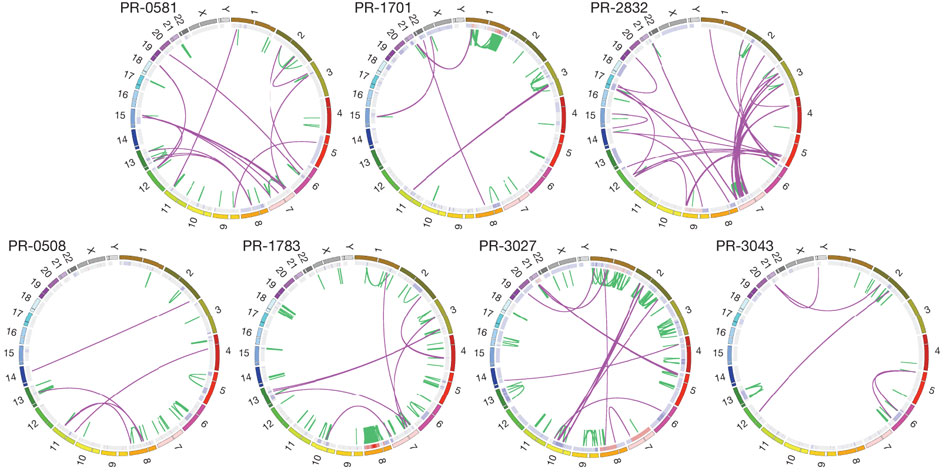
Figure 1 uses Circos plots to visually show deviations within each of the prostate cancer tumor genomes from seven patients. The three genomes on the top plot row (PR-0581, PR-1701, and PR-2832) contain the TMPRSS2-ERG gene fusion, while the four genomes on the bottom plot row (PR-0508, PR-1783, PR-3027, and PR-3043) do not contain TMPRSS2-ERG gene fusion. For each plot, each specific chromosome is designated by the outer number and a corresponding outermost colored ring. The second inner ring indicates the chromosomal copy number, with red representing copy gain and blue representing copy loss. One observation is some regions within some chromosomes that have copy gain (i.e. PR-1783 chromosome 8) and other regions that have copy loss (i.e. PR-3027 chromosome 13). Rearrangements within chromosomes are represented by interior green lines forming small arcs on each chromosome. One observation is different genomes have different amounts of intrachromosomal rearrangements, as illustrated by more green lines on chromosome 1 in PR-1701 compared to fewer green lines on chromosome 1 in PR-0508. Translocations between different chromosomes are represented by interior purple lines forming larger arcs between chromosomes. One observation is that interchromosomal translocations seem to have no clear similarities between the seven prostate cancer genomes. Figure 1 shows the benefits of using visual plots, compared to a table, in quickly discerning patterns like rearrangements between different genomes. Figure 1 most importantly summarizes how different prostate cancer genomes have differentiating, diverse genomic variations, and that no two tumor genomes are alike in terms of their genomic variations.
____________________________
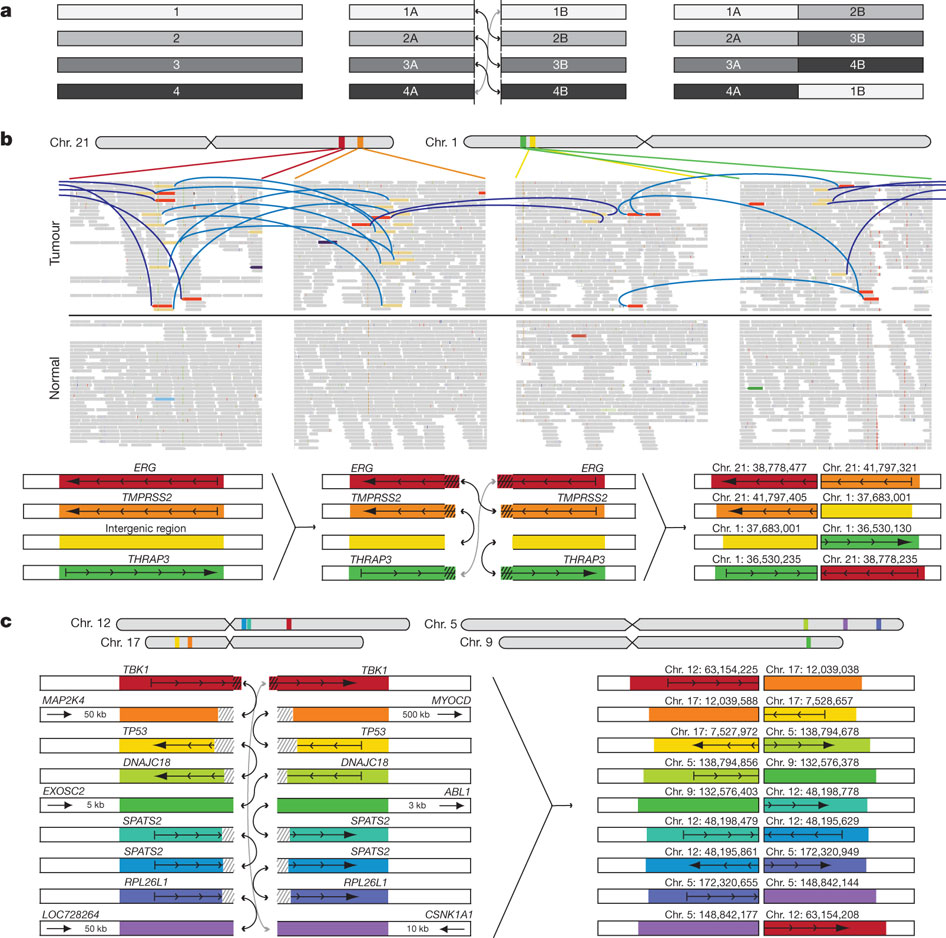
Figure 2: Complex structural rearrangements in prostate cancer (Berger et at., 2011). Click on the image to see the original figure.
Figure 2a is a theoretical representation of balanced chromosomal rearrangements between four chromosomes. The middle column shows the breakpoints present in the middle of each chromosome and the subsequent exchange and rejoining with another chromosome, resulting in "chimeric chromosomes" in the third column. This process is balanced because the translocations are copy neutral, meaning that no chromosomal material was lost in the breaking and rejoining of different chromosomes.
Figure 2b is an actual example of chromosomal translocation in the PR-1701 tumor genome, which has the TMPRSS2-ERG gene fusion often associated with prostate cancer. The top row shows chromosome 21 and chromosome 1, with four colored loci on the two chromosomes, which corresponds to the four columns below showing a expanded schematic of the genetic sequence. The schematic shows that the normal genome contains little rearrangements between both chromosomes 21 and 1. In contrast, the tumor genome has an abundance of chromosomal rearrangements within each chromosome and between chromosomes. A more specific depiction of four loci rearrangements between chromosomes 21, 37, 36 and 1 is shown in the last row of figure 2b, with hatching representing duplicated sequences after fusion of the rearranged sequences. For example, the TMPRSS2 and ERG genes in the normal genome were initially intact on different loci on chromosome 21. The tumor genome however had breakpoints within the ERG, TMPRSS2, intergenic region, and THRAP3 that resulted in balanced translocations. One rearrangement resulted in part of ERG joined with another part of TMPRSS2 at a single loci on chromosome 21. Other rearrangements resulted in the rest of ERG joined with part of THRAP3 ( from chromosome 36), and the rest of TMPRSS2 joined with part of the intergenic region ( from chromosome 37).
In addition to the gene fusion of TMPRSS2 and ERG, figure 2c shows rearrangements between nine other loci on chromosomes 12, 17, 5, and 9 in the PR-2832 tumor genome. Breakpoints are in intragenic or nearby intergenic regions, with hatching representing duplicated (colored) or deleted sequences (grey and white) after fusion. In particular, the "cancer genes or orthologues" TBK1, MAP2K4, TP53, and ABL1 are affected by these rearrangements. For example, one of the genes (MAP2K4) on chromosome 17 was 51 kb to the left of a breakpoint. After chromosomal breaking and rejoining, MAP2K4 was joined to an intragenic region of TBK1 from chromosome 12.
Overall, figure 2 demonstrated that just one tumor genome is characterized by many unique rearrangements both within and between chromosomes. These rearrangements disrupt sequences, thus also disrupting the functions of cancer-related genes and interactions between multiple genes.
____________________________
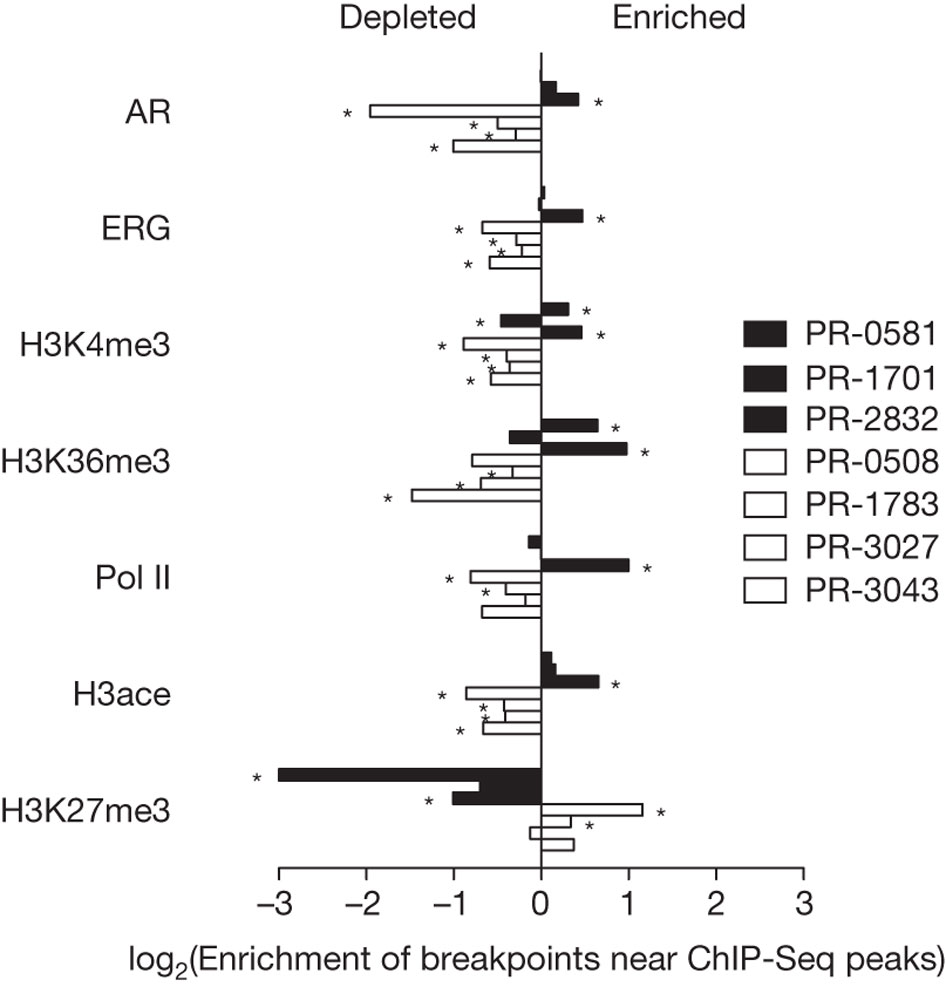
Figure 3 demonstrated the association between differential transcription of DNA (due to chromatin), and rearrangement breakpoint locations. Rearrangement breakpoint locations of the seven prostate cancer tumor genomes were compared with the chromatin immunoprecipitation (ChIP) data from the VCaP prostate cancer cell line. The three tumor genomes (black bars) on the key's top row (PR-0581, PR-1701, and PR-2832) are TMPRSS2-ERG fusion-positive, while the four tumor genomes (white bars) on the key's bottom row (PR-0508, PR-1783, PR-3027, and PR-3043) are TMPRSS2-ERG fusion-negative.
The reasoning for using ChIP data was to see where open and closed chromatin occurred; open chromatin indicates that a DNA sequence is not blocked by chromatin, allowing for transcription to occur, but closed chromatin blocks a DNA sequence from being transcribed (M. Campbell, personal communication, February 23, 2011). DNA-binding protein cannot bind to DNA if there is closed chromatin; however, if DNA-binding protein can bind to the DNA sequence, that allows for antibodies to bind to the DNA-binding protein, which further allows for immunoprecipitation of the sequence (M. Campbell, personal communication, February 23, 2011). This increase in precipitation results in ChIP-Seq peaks, which is depicted on the x-axis.
The three ETS fusion-positive tumors had enrichment of rearrangement breakpoints (with RNA polymerase II, histone H3K4 trimethylation, histone H3K36 trimethylation, histone H3 acetylation, androgen receptor (AR) and ERG binding sites) correlated with ChIP-Seq peaks (regions of open chromatin in VCaP), plus with AR and ERG. Out of the other fusion-positive tumors, PR-2832 had the most consistent significant correlation of breakpoint enrichment with ChIP-Seq peaks (open chromatin), as indicated by the asterisks. In contrast to the other sequences, H3K27me3 in the fusion-positive tumors had a depletion of breakpoints near ChIP peaks. Overall, the fusion-positive tumors had a positive relationship between breakpoint occurrence and ChIP-Seq peaks plus AR/ERG binding. The four ETS fusion-negative tumors had a depletion of rearrangement breakpoints (with RNA polymerase II, histone H3K4 trimethylation, histone H3K36 trimethylation, histone H3 acetylation, androgen receptor and ERG binding sites) correlated with ChIP-Seq peaks (open chromatin), plus with AR and ERG. In contrast to the other sequences, H3K27me3 in the fusion-negative tumors had enriched breakpoints at closed chromatin. Overall, the fusion-negative tumors had an inverse relationship between breakpoint occurrence and ChIP-Seq peaks plus AR/ERG binding.
Overall, figure 3 shows that genetic rearrangements are dependent on a higher level of epigenetic regulation via chromatin, which has an effect on whether rearrangement occurs for a particular sequence, receptor, or binding site. Depending on the particular tumor type, rearrangement may occur differently due to having either open or closed chromatin and thus, different cancer-related genes may be rearranged in different tumors. For example, TMPRSS2-ERG fusion-positive tumors appear to have more rearrangements when there is open chromatin, while fusion-negative tumors appear to have less rearrangements when there is open chromatin.
____________________________
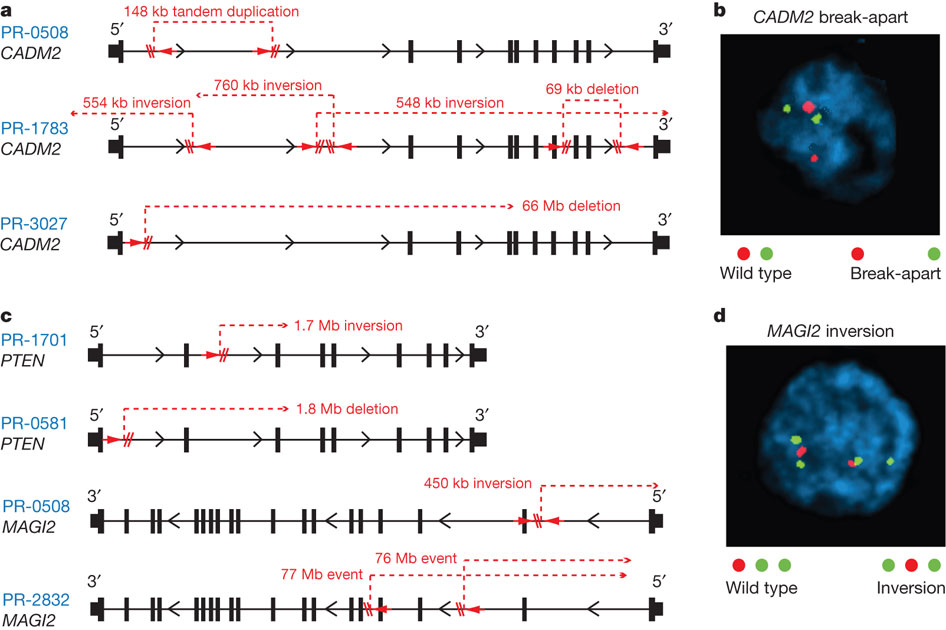
Both figure 4a and 4b depict CADM2 disruption in two different formats. The CADM2 protein is nectin-like, which is linked "tumour suppressor properties," so rearrangement of CADM2 would disrupt its function.
Figure 4a shows that in three prostate tumor genomes (PR-0508, PR-1783, PR-3027), the CADM2 disruption was caused by a variety of intragenic breakpoints unique to each tumor, leading to tandem duplication, inversions, and/or deletions.
Figure 4b shows the technique of break-apart FISH for detecting disruption in CADM2, which was used to find that CADM2 disruption is repeatedly found in some prostate cancers. Because of FISH limitations, the estimation rate of CADM2 disruption in tumors may be underreported. The wild type CADM2 is shown as a red and green dot located close to each other, while the break-apart CADM2 is shown as having the red and green dot located far apart.
Figure 4c shows disruptions for two other genes, PTEN (encodes tumor suppressor) and MAGI2 (encodes protein that interacts with PTEN). PTEN in PR-0508 and PR-1783 had different breakpoints resulting in either a deletion or inversion respectively, but both lead to PTEN disruption in the two tumors. MAGI2 in PR-0508 and PR-2832 was disrupted by different breakpoints that resulted in different inversions, but both lead to MAGI2 disruption in the two tumors. Figure 4d displays the results of FISH with inversion probes, which found that MAGI2 inversion occurred repeatedly in some prostate cancers. Because of FISH limitations, the estimation rate of CADM2 disruption in tumors may be underreported. As indicated by the key, the wild type MAGI2 has a red, green, green sequential pattern while MAGI2 inversion is shown by a green, red, green sequential pattern.
Overall, figure 4 gives examples of recurring disruption of specific cancer-related genes in different tumors. Even though different tumors have different indels and inversions, these rearrangements often lead to the same disruptions of particular genes like CAMD2. These gene-specific disruptions may serve as a indicator/marker for specific types of tumors, and help more quickly find/treat the prostate cancer tumor in a patient.
____________________________
Reference
Genomics Page
Biology Home Page
Davidson College Home Page
Email Questions or Comments to alsu@davidson.edu
© Copyright 2011 Department of Biology, Davidson College, Davidson, NC 28035