This web page was produced as an assignment for an undergraduate course at Davidson College.
This web page summarizes the paper by Song et al.: Deep RNA Sequencing Reveals Novel Cardiac Transcriptomic Signature for Physiological and Pathological Hypertrophy
Introduction:
Physiological hypertrophy (PHH) and pathological hypertrophy (PAH) of the heart have similar phenotypic outcomes; the heart is enlarged. However, only PAH can lead to heart failure and is therefore dangerous. Cardiac PHH is usually the healthy response to increased exercise. In this study, the researchers studied the transcriptomic differences between the two types of hypertrophy with comparisons to controls.
Previous studies on the genomic signatures of cardiac hypertrophy had been conducted using microarrays. However, the microarray method has limitations such as spatial bias, uneven probe properties, low sensitivity, and dependence on probes. In this study they utilized RNA sequencing (RNA-seq). This allows them to look at quantitative (up and down regulation) and qualitative (alternative splicing) transcriptomic differences in PHH and PAH. Initially they used both microarray and RNA-seq to evaluate the effectiveness of RNA-seq. They found RNA-seq to be more sensitive, accurate, and reproducible and therefore preferable to the microarray method.
Methods:
This study used mice models. In order to induce PHH, one group of mice was put through chronic exercise training. They swam in tanks of water for 4 weeks, with swim times increasing from 10 minutes twice a day to 90 minutes twice a day. The control for this group was sedentary mice.
In order to induce PAH, another group of mice underwent a trans-aortic constriction (TAC) operation. The control group underwent a sham operation, the same procedure minus the constriction.
These mice were then sacrificed and their hearts were removed for study.
Discussion:
When the transcriptomic data was analyzed, six important things were discovered
Summary of Figures:
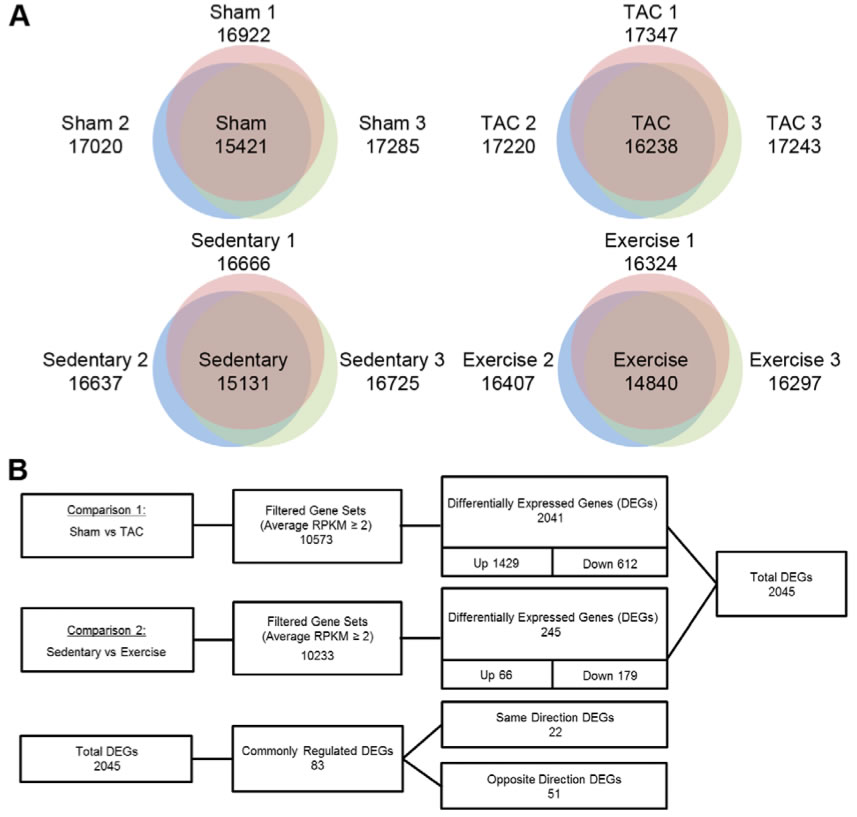
Figure 1: Summary of DEGs in PAH and PHH
A. These Venn diagrams show how many expressed genes were found in the replicates of each treatment: sham, TAC, sedentary and exercise-training mice. This shows that the many of the genes found in any of the three individuals were found in all, indicating that the RNA-Seq was accurate.
B. The expressed genes were then compared between the experimental groups and their respective control groups. The genes studies for differential expression were those expressed in both the experimental and respective control. When comparing genes in PAH vs. sham, 2041 genes were found to be differentially expressed, most of these were up-regulated (1429), but some down-regulated (612). Many fewer genes, only 245, were differentially expressed when comparing genes in PHH vs. sedentary and most of these were down regulated. Of the total number of DEGs (2045), 83 of these were regulated in both PAH and PHH. 22 of them were either up regulated or down regulated in both TAC and exercise mice while 51 of them were oppositely regulated in TAC and exercise mice.
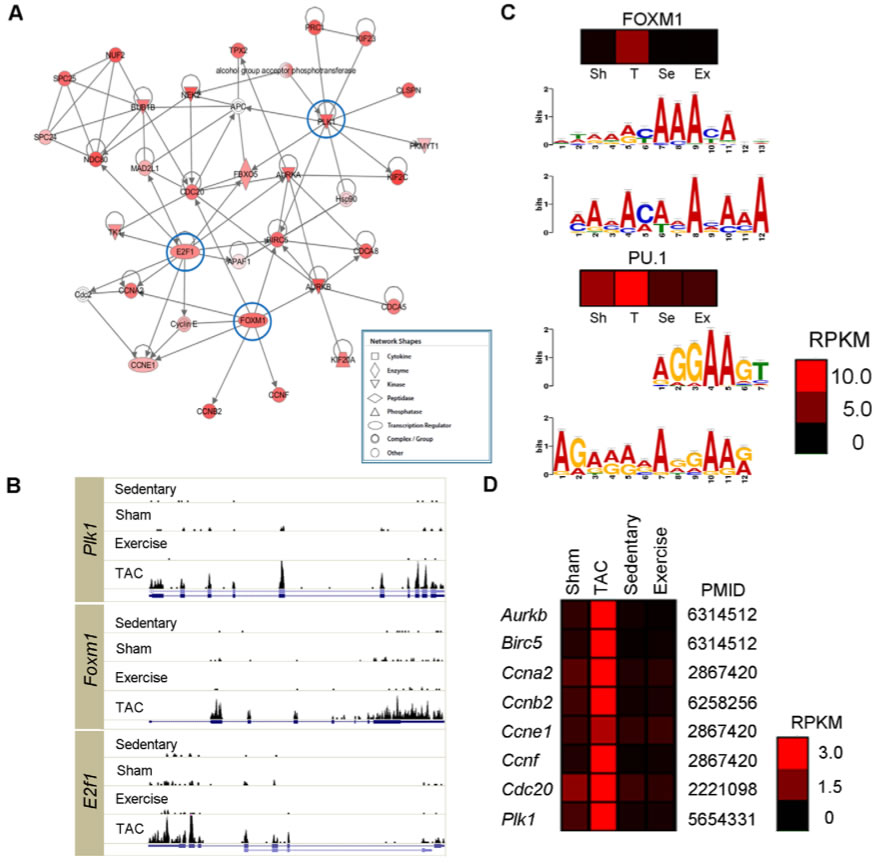
Figure 2. Network of the genes turned on in PAH
A. 417 genes that were hardly detectable in sedentary and sham hearts had a dramatically increased expression in PAH hearts. These genes were analyzed using Ingenuity Pathway Analysis which helps identify critical molecules and their functions. This analysis indicated that the most abundant genes E2F transcription factor 1 (E2f1), forkhead box M1 (Foxm1), and polo-like kinase 1 (Plk1) are cell cycle regulators.
B. These histograms show that the expression of Plk1, Foxm1, and E2f1 is only dominate in TAC mice. Expression for each is minimal for each of the other mice, even the exercise mice with PHH cardiac function. This indicates that they play a role in the pathogenesis of PaH
C. These are possible binding motif for the transcription factors. For both the FOXM1 and PU.1, the top chromatograms show known motifs from these two transcription factors. The bottom chromatogram shows the known motif predicted by MEME when the 1000 bp upstream of the 417 genes sequences were analyzed. Comparing the two graphs for each transcription factor shows that the motif binding sites are similar to known motifs. The heat maps show the expression of the two transcription factors. These indicate that FOXM1, has a much greater expression in PAH than PHH, sham or sedentary. These data indicate that especially FOXM1 and possibly PU.1 play a role in the pathogenesis of PAH.
D. The genes listed on the left are known targets of FOXM1. The heatmap shows that these genes are preferentially turned on in PAH hearts.
Overall, the data shown in this figure indicates that there are certain TFs, especially FOXM1, that likely play a role in the pathogenesis of PAH.
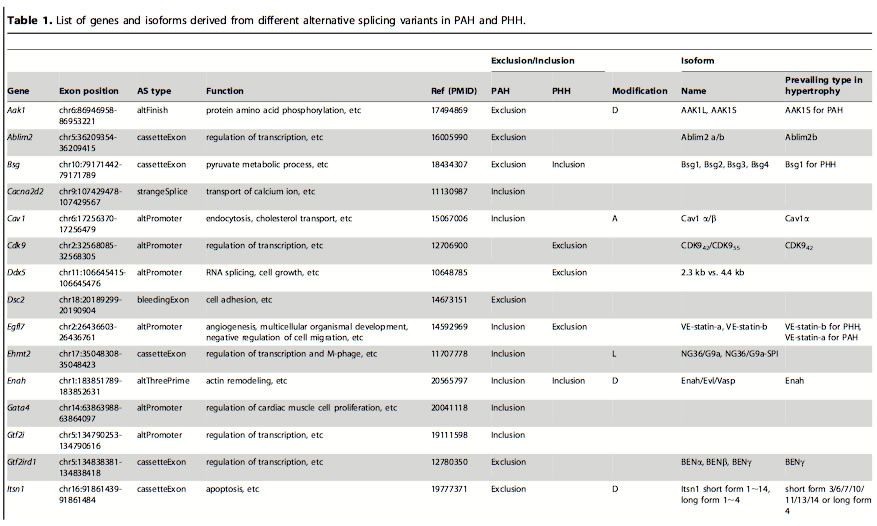

Table 1: List of genes and isoforms derived from different alternative splicing variants in PAH and PHH. After finding which genes had alternative splicing events in the PAH and PHH mice, they looked at previous in-depth studies of exon variations to classify the types of AS. The classification was based on the biological functions altered: domain gain or loss, activity change and localization change. The most frequent of these functional alterations is the gain or loss of domains. Certain domains variations were seen in PAH and others in PHH.
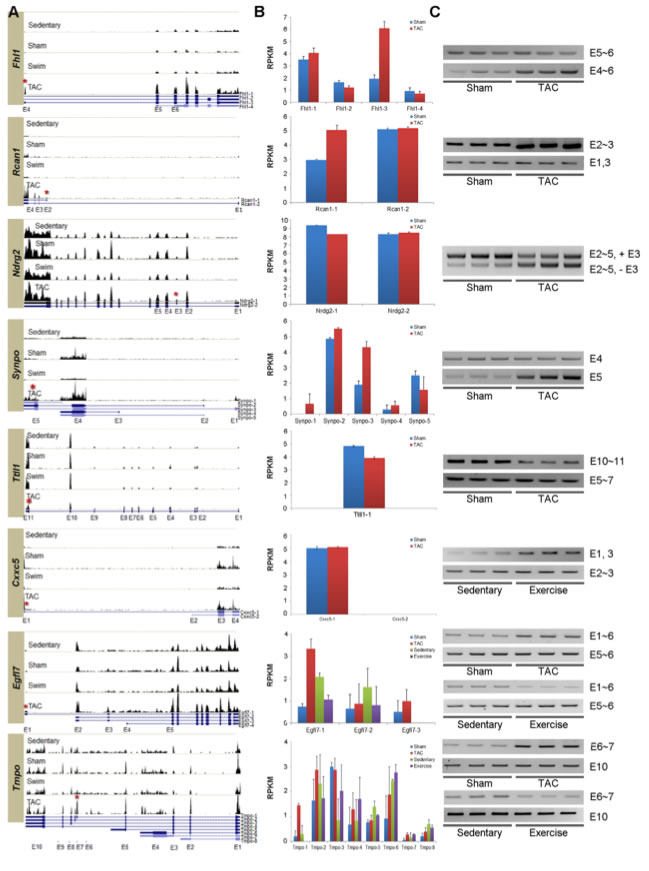
Figure 3: Experimentally verified isoforms alternatively spliced in PAH and PHH.
In order to validate certain alternative splicing events, RT-PCR assays were designed for eight genes.
A. These histograms show the expression of the eight genes in the hearts of each treatment of mice. At the bottom of each histogram are UCSC isoforms of the genes showing different exons. The red asterisk indicates the exon alternatively spliced in hypertrophic hearts. These histograms show the quantitative change of expression of the genes at particular points between the different treatments. For example, the expression of the Fhl1 gene, especially the Fhl1-3 isoform increases 3.5 fold during PAH.
B. These graphs show the distribution of the different UCSC isoforms of each gene between different models. These show qualitative changes in expression, namely one isoform being expressed more often in hypertrophic hearts than normal hearts. For example, the isoform Fhl1-3, an isoform of Fhl1, is more abundant in PAH than in the sham models, but the other isoforms are not significantly different from the sham models.
C. Experimental evidence using RT-PCR assays was used to confirm the alternative splicing. The gels confirm splicing in Fhl1, Rcan1, Ndrg2, Synpo, and Ttll1 in PAH and Cxxc5 I PHH. Opposite splicing patterns for PAH and PHH was confirmed for Egfl7 and Tmpo.
These data suggest that the hypertrophic signals are regulating the isoforms of these genes both quantitatively and qualitatively.
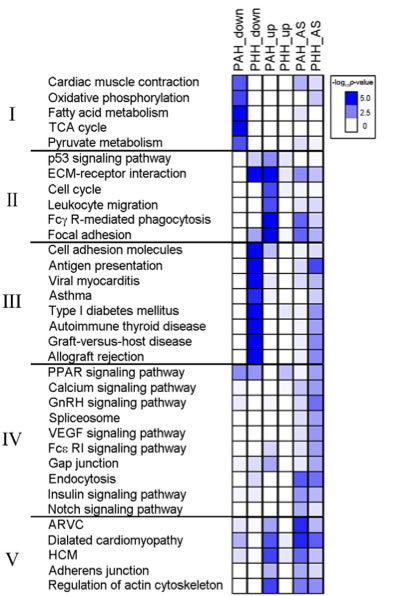
Figure 4: Critical pathway associated with DEG and exon variants changed in PAH or PHH. Pathways associated with the DEGs and genes with alternative splicing were analyzed using KEGG pathways. This heatmap shows enriched (both up- or down-regulated) pathways for both PAH and PHH and groups the pathways into five groups according to their biological significance. The heatmap shows that DEGs in Group I, pathways involved in muscle contraction and metabolism, are significantly down-regulated in PAH models with no down-regulation in PHH models and little up-regulation or alternative splicing in either PAH or PHH models. DEGs in Group II, pathways involved in the immune system and cell cycling, are up-regulated in PHH models. Interestingly, DEGs in Group III, pathways involved in autoimmunity, were down-regulated and showed signs of alternative splicing in PHH models. These changes were not seen in PAH models (the paper says they were not seen in PHH, but appears to be a typo). Few broad patterns are seen in DEGs in Group IV, pathways involved in cell signaling. However, alternative splicing was seen in both PAH and PHH for the endocytosis pathway. The DEGs in Group V, pathways for cardiac diseases show alternative splicing events for both PAH and PHH and up-regulation for PAH.
The clustering of some DEG data into groups based on biological significance indicate that certain functions in heart cells are regulated differentially in PAH and PHH.
Conclusion:
This study shows that vast amount of information that can be gleaned from transcriptomic information discovered using RNA-seq. It also shows some of the methods that can be used to analyze the data and organize it. This paper introduces this new method in a convincing way by first comparing it to an accepted method of probing transcriptomic data, the microarray, and then by showing all the different kinds of information that can be discovered, both quantitative and qualitative. By looking at hearts with physiological and pathological hypertrophy, they were able to discern many of the transciptomic differences which may be able to elucidate the molecular differences in these two phenomena.
References:
Song HK, Hong SE, Kim T, Kim DH. (2012) Deep RNA Sequencing Reveal Novel Cardiac Transcriptomic Signatures for Physiological and Pathological Hypertrophy. PLoS ONE 7: e35552.
Genomics Page
Biology Home Page
Email Questions or Comments to Becca Evans.
© Copyright 2013 Department of Biology, Davidson College, Davidson, NC 28035