
This web page was produced as an assignment for an undergraduate course at Davidson College.
This page reviews the 2012 Science article "In Situ Evolutionary Rate Measurments Show Ecological Success of Recently Emerged Bacterial Hybrids" (Denef et al., 2012). The discussion includes a summary of the presented processes, results, and conclusions. Furthermore, summaries of the paper's figures provide a clearer identification of the data collected and analysis conducted. This review concludes with my response to the article as a whole.
In this article, Denef et al. focused on identifying the rate at which free-living microorganisms evolve. Specifically, Denef et al. studied the geochemical microbial Leptospirillum group II, which is responsible for iron oxidation leading to the formation of acid mine drainage in the Richmond Mine found in California. Eventhough mutation rate estimates already existed, the accuracy of these estimates had yet to be verified for these geochemical environments. Furthermore, most of the research conducted up until this point have focused on different microorganisms -- mainly pathogens and endosymbionts. In order to collect evolutionary data for Leptospirillum, the researchers followed various steps including: identification of location with ideal experimental conditions, collection and sequencing of spatially and time series resolved biofilms, identification of nucleotide substitution rate, and read sequence allignment from various sample sites. After completion of these steps, Denef et al. drew conlcusions about Leptospirillum group II and how it evolves.
Denef et al.selected the study location carefully in order to attain reliable results. The homogeneous communities of Leptospirillum and the consistent formation of these communities over time in the Richmond Mine made it ideal for this study. Furthermore, input from other microbe populations was neglibible due to few total species in the environment resulting from the inhospitable conditions. Without such conditions this study would not have been possible. The availability of many samples of the same genotype allowed for statistically powerful identification of SNPs (single-nucleotide polymorphisms), which appear to play a critical role in the varying fitnesses of the species' various hybrid genotypes.
Samples were collected from various sites (air-solution interface of standing pools) and times (2002-2010) within the Richmond Mine. Different sites contained distinct populations of Leptospirillum (Figure 1). Samples were sequenced through the use of Illumina sequencing technology. In total, ~63 billion base pairs were sequenced in the study's 24 samples. Since each sample provided 1.7 million - 8 million sequencing reads, high-frequency SNPs were resolvable with conifidence.
The nucleotide substitution rate was identified through the type III genome. Leptospirillum type III was chosen as a reference genome because one site (C75) was suspected (by previous proteomics data) to contain almost exclusively type III (Figure 1). The site was shown to be a consistent source of homogenous samples because almost all of the samples collected from C75 over the time span from 2006 to 2010 were >99% type III cells. Since the mutation rates being identified relied on very precise SNP identifications, any significant variation based on spacial sampling could result in an inaccurate mutation rate calculation. To assure that spatial variation was insignifiicant within C75, Denef et al. sampled 3 sites 1 meter apart in 2008. The variations between the resulting type III genomes was very small, supporting the idea that C75 was an ideal location for identifying substitution rate. After identifying the SNPs (compared to a 2005 reference genome obtained from C75) prevalent in more than 90% of the reads for chronological samples, a trend showed that the number of high-frequency SNPs increased over time. From the emerging SNPs identifed over time, the mutation rate was calculated as 1.4 * 10^-9 substitutions per nucleotide per generation -- a result consistent with previous reports.
The reads of samples from all 24 sites provided data regarding the genomic diversity of the species. In total, 6 types of Leptospirillum group II were identified (I, III, IV, IVa, V, VI). Types III, IV, IVa, and V were all formed from recombination events between I and VI. Because these 4 types have the same recombination points (from I-like to VI-like or vise-versa), it appeared that the recomibination occurred in one cell, and then that cell line rose to fixation (indicating the first branch in Figure 1 C). From comparing the locations of specific variations in each genotype to the reference type III genome, a phylogenetic tree was formed illustrating the time frame for coalescence of each genome to a common ancenstor. This time frame ranged from 2-44 years for the various hybrids.
After completing the study, Denef et al.drew several conclusions.
A. This figure identifies the time (based on date) and spatial locations of the various samples collected for the study. It provides a diagram that emphasizes the different regions of the mine. Furthermore, the predominant Leptospirillum genotypes collected from each sample are illustrated in a pie chart format. This figure illustrates that the C75 site is very homogenous over time and, therefore, ideal for the rate of nucleotide substitution analysis. Furthermore, this figure demonstrates that various hybrid genotypes (not just the type III) are capable of dominating their environment.
B. This figure identifies the acid flow rate (entrance of tunnel) and species % composition (from in situ fluorescence hybridization) as functions of time in an attempt to identify clear correlations between flow rate spikes and microorganism evolution. Regardless of the time, the composition seems to be dominated by either archaea (yellow) or types II through VI (blue). A trend linking specific flow rate spikes and % composition change is difficult to identify based on the collected data. However, it is possible that these types of spikes are naturally occuring environmental purturbations to the system resulting in selection pressures towards hybrid phenotypes with only a few SNPs different from their siblings.
C. This figure expands the time scale from B (shaded region) and does not include the % composition data. By identifying a larger time period, the recent consistency of the flow rate spikes becomes clear. Based on the rapidity with which these hybrids have been found to evolve and attain fixation, this consistent environmental purturbation could be considered a likely factor accentuating the slightest selective differences in a short period of time.
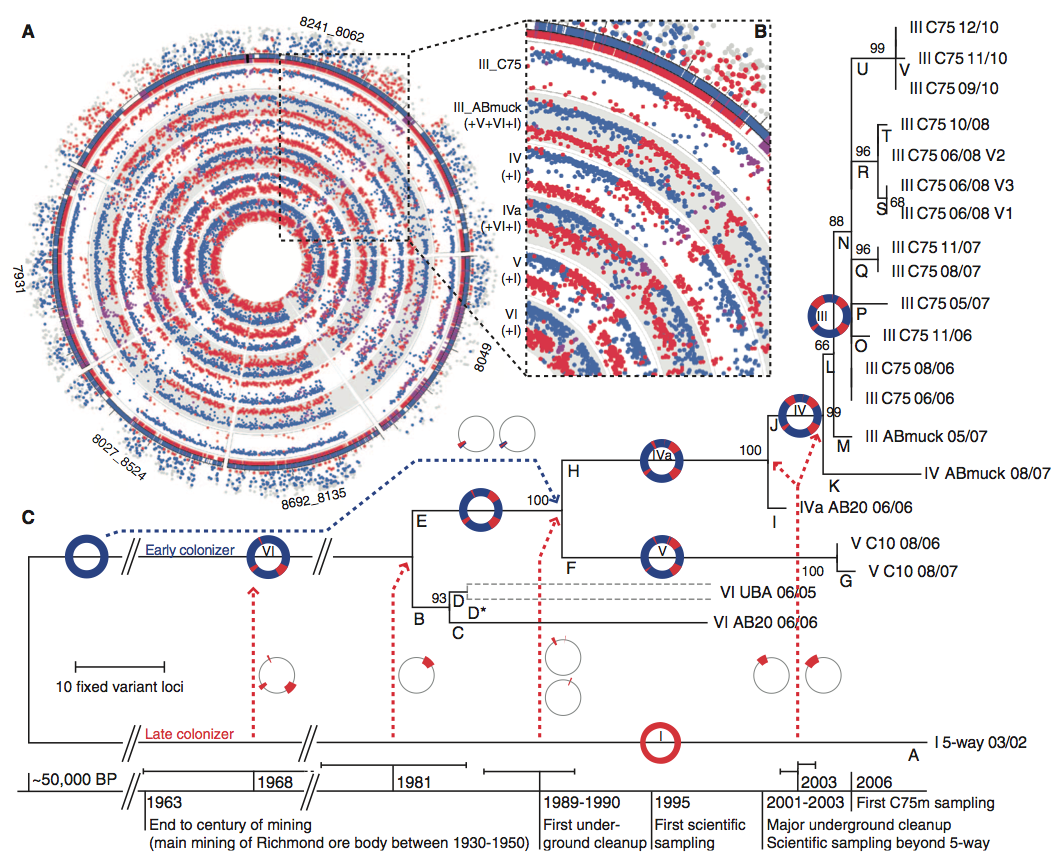
A. This figure shows the Illumina sequencing data for the 6 different recombinant types identified in the study (inside of the circle). The outside ring of dots represent proteomics-inferred genotyping (PIGT) data for types I (red) and VI (blue) on the type III reference genome. This color pattern continues to apply to the sequence data on the inside rings. Ultimately, this figure illustrates the recombinant results associated with each hybrid genotype through the variations in type I inclusion. Furthermore, it helps demonstrate a chronological order of recombination events. For example, type III was the final recombinant to branch, and therefore is the only hybrid type with the large type I recombination illustrated from 10-11 o'clock on the circle (others have much small type 1 regions at the same location). (Identification of concentric circle type can be found in B)
B. The key to this figure is the same as for A. This figure accentuates the common recombination observed by all 4 hybrid genotypes (III-V). This suggests that these all come from a common ancestor (VI) and this site resulted the first time VI recombined with I.
C. This figure is a phylogenetic tree obtained through the maximum parsimony method depicting the recombination events resulting in the various hybrid genotypes. It provides a time frame illustrating the rapidity with which this species has evolved and demonstrates that coalescence of the various types ranges from 2-44 years ago. This tree also correlates the recombination events and resulting hybrid fixations with potential human induced perturbations to the environment. Perhaps these perturbations placed selective pressure upon the system. Finally, this figure demonstrates that there is no lack of Leptospirillum diversity in this system (branches K-V).
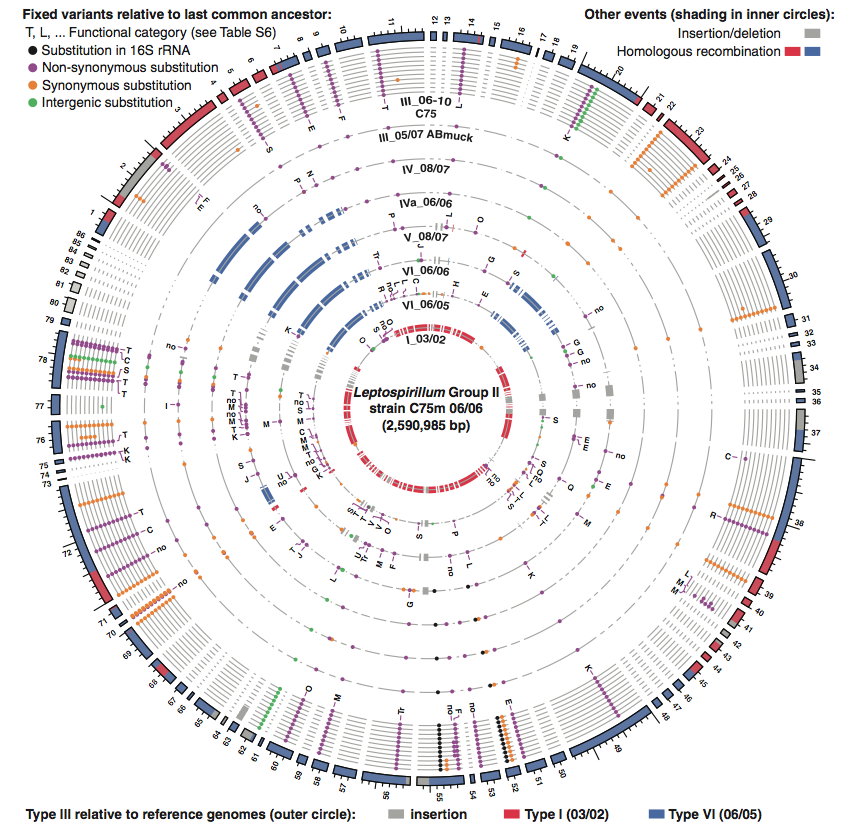
This figure again shows the information provided in Figure 2A and is based on read recruitment to the type III reference genome established in 2006 from the C75 site. This figure also identifies the specific high frequency SNPs (dots) that diverge from the previous common ancestor. The circles are organized with the most recent hybrid (type III) on the outside and group I in the center. Dot color represents the varation divergence with respect to the previous common ancestor. The functional categories of SNP substitutions are provided by the letters next to certain dots. Variation can be found both between types and also within type III. Some of these variations can be associated with potential selection pressures. For instance, the relatively high degree of T and K SNPs (signal transduction gene and transcriptional regulation genes) are associated with directional selection and not simply random evolution.
Overall, I found this paper very informative regarding microorganism evolution. The rationale behind the various stages of the study were well explained and compelling. However, each stage was not necessarily presented chronologically, disallowing for simple organization of the entire process. Much of this lack of organization appears most obviously in the figures. For instance, the phylogenetic tree in Figure 2C illustrates results only obtained through the read recruitment data presented in Figure 3. Unfortunately, in part due to this unclear chronology of the stages, the exact reasonings behind certain conclusions were difficult to identify as a reader. Perhaps this issue would be resolved if distinct sections were apparent in the paper. If conclusions only emerged at the end (as opposed to mixing them throughout), clearer big picture ideas could be presented refering to all of the results.
I also noticed certain problems with the papers content. Most importantly, the paper failed to mentionn certain limitations to the method. First is the fact that the sampling location of the study was very unique due to the low species diversity and high population homology. Denef et al. discuss how results from this type of mutation rate study are more representive of natural environments, but fail to address the possibility that the location uniqueness required for such studies could affect the obtained results. Also, the paper fails to sufficiently address the possibility of gene contamination within the gaps (Figure 3). If the gaps contain genes from undocumented gene transfers, perhaps the evolutionary selection towards these hybrids is not simply due to a few SNPs.
After reading and re-reading to finally grasp the depth of the process, I found the evidence presented by Denef et al compelling. While the exact events influencing the selection for hybrids still remain somewhat unclear, certainly more is now understood about the evolution of at least this single species. Ultimately, this study illustrates the potential of time based genomics studies for identifying and characterizing evolutionary trends.
© Copyright 2013 Department of Biology, Davidson College, Davidson, NC 28036
Send comments, questions, and suggestions to: johimes@davidson.edu