This web page was produced as an assignment for an undergraduate course at Davidson College.
Single-Cell RNA-Seq Reveals Dynamic, Random Monoalleclic Gene Expression in Mammalian Cells
Summary
This study demonstrated that diploid cells exhibit stochastic and dynamic monoallelic gene expression, rather than transcribing the autosomal genes from both parental alleles. Using single-cell RNA-seq, researchers generated the transcriptome profile of 269 invividual cells undergoing early development. Single nucleotide polymorphisms (SNPs) that were specific for two genetically distinct strains of mice were utilized to differentiate between maternal and paternal chromosomes. A comparison of biallelic expression to a coordinated and independent allele activation model concluded that alleles were independently transcribed. Differences in percent of monoallelic expression between individual cells and embryos showed that monoallelic expression was random. In addition, researchers used RNA-seq to demonstrate that the paternal X chromosome experienced de novo inactivation.
Figures
Figure 1
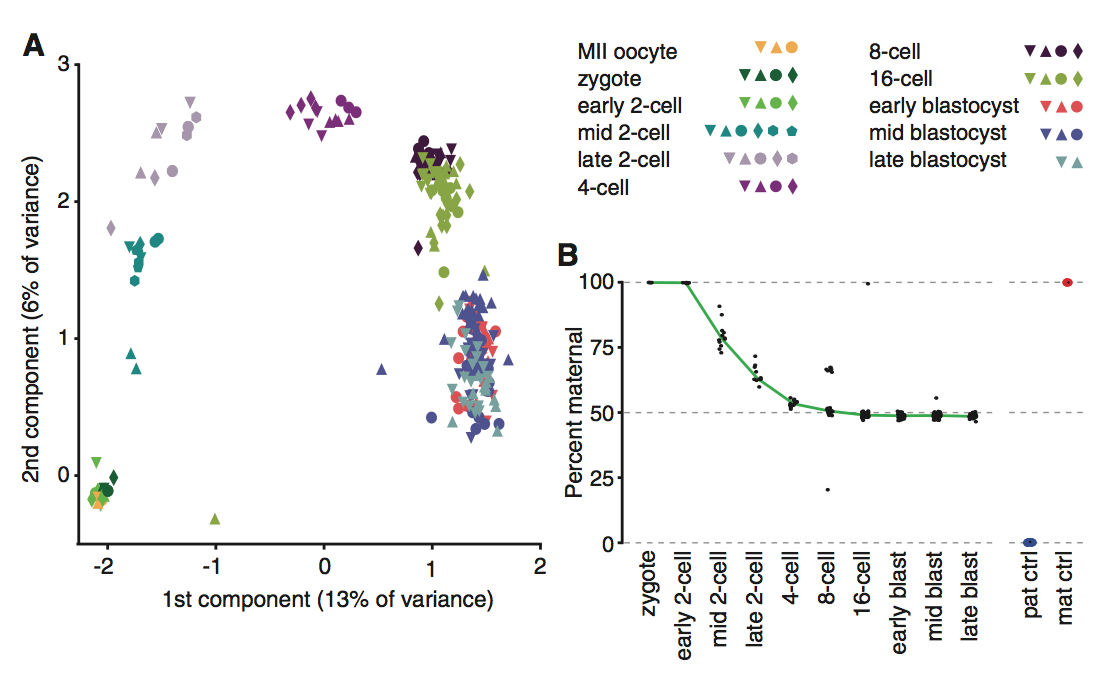
Panel B serves to demonstrate the decrease in maternal RNA transcripts as developmental stages progressed and to validate the study’s methods. In early stages of development, cells were found to be primarily composed of maternal RNA, as is expected in a recently fused zygote due to lingering maternal mRNA. However, once the cell reaches the mid 2-cell stage paternal transcripts are detected. By the 4-cell stage, the abundance of maternal transcripts equals maternal transcripts. C57 and CAST cells were used a controls, and it was found that 99% of the reads were correctly classified. The significance of the controls was that they validated the RNA-seq method’s ability to map reads on the paternal and maternal chromosomes.
Figure 2
This figure shows the de novo inactivation of the parental X chromosome (Xp). This was accomplished by determining the fraction of parental and maternal expression of autosomal and X-chromosome genes in individual cells. The study found that Xp in female cells was transcriptionally active from the mid 2-cell stage to the 4-cell stage, as represented by the red line on the top of panel A. However, at the 16-cell and early blastula stages, the expression of X chromosome genes decreased and was significantly lower then the autosomal gene expression. The bottom of the panel supports the conclusion that X-chromosome inactivation is paternally biased. The graph shows that Xist transcription, a gene that initiates X chromosome inactivation and occurs only in female cells, begins to increase at the 4-cell stage for Xp. This observation supports the conclusion that the decrease in paternal/maternal expression of the X-chromosome was due to Xp inactivation. Since the Xp inactivation began at the 4-cell stage and was not inherited, it is said to be de novo.
Panel B demonstrates that Xp inactivation does not spread due to proximity to the locus for Xist, known as the X-inactivation center, Xic. At the inactivation center, represented by the vertical dotted line at 100 Mb, the fraction of maternal gene expression ranges from 0.4 to 0.6 for the three different developmental stages studied. There is no apparent trend of an increase in the fraction of maternal gene expression, signifying that Xp inactivation was not due to distance from Xic. However, the graph does demonstrate an increase in the fraction of maternal gene expression as cells progress to later stages, meaning an inactivation gradient resulting from developmental stage.
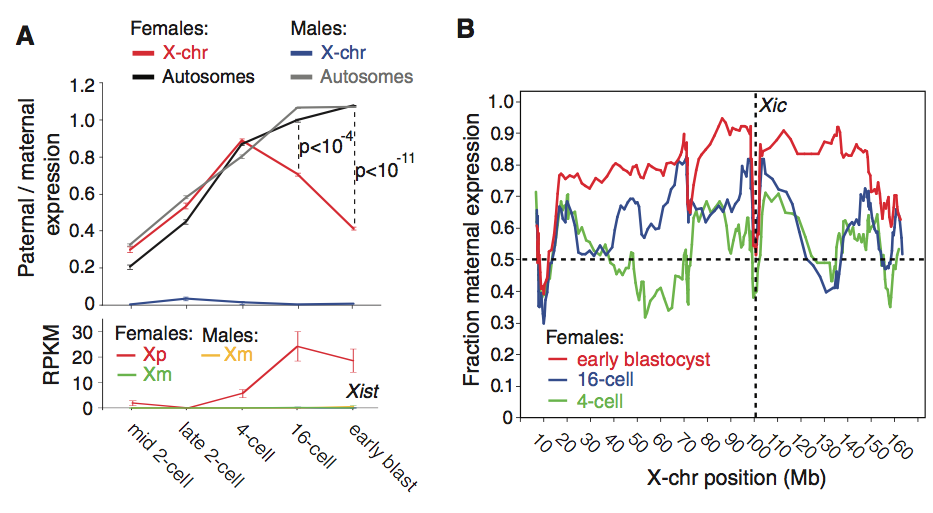
Figure 3
The researchers in this study were aware that single-cell transcriptome methods experienced losses of RNA species, distorting the fraction of genes undergoing monoallelic expression. To determine stochastic effects on monoallelic expression, cells were lysed and split into equal volume fractions and independently sequenced. These two equal volume fractions were then compared. Panel A shows that 60% of the polyA RNA molecules were lost in the Smart-seq2 protocol. Panel B and C show that the split-cell analysis allowed for researchers to infer a mean of 17% of genes that exhibited monoallelic expression.
With the knowledge of the influence of RNA-seq on observed monoallelic expression, a focus was placed on transcripts with adequate expression levels to minimize the effects of random sampling. Panel D demonstrates that 12 to 24% of gene expression over the four cell stage to the late blastocyst stage window was monoallelic. Yet, when cells were pooled by embryo (panel E), the monoallelic expression previously observed in this window was no longer present. Together, these two panels signify that monoallelic expression is random and cell-specific, since no monoallelic expression was observed in the embryo.
Panel F demonstrates that the expression of two alleles in a genome are independent of one another. The study supports this conclusion by modeling the relationship between biallelic expression and no gene expression if these cells were to experience coordinated (yellow dotted line) or independent (dotted red line) allelic expression. The allelic expression data from the cells was found to support the independent allelic expression model. The study then demonstrated that biallelic gene expression had twice the amount of RNA transcripts than monoallelic expression, which further supports independent allelic expression (panel G).
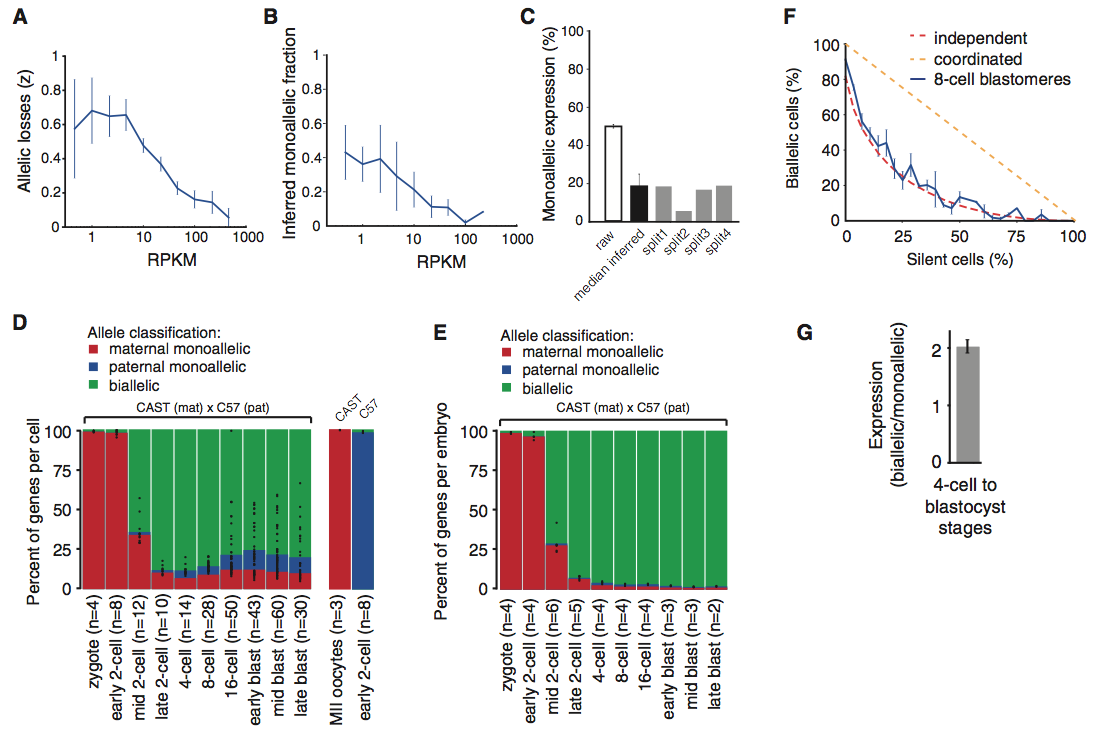
Figure 4
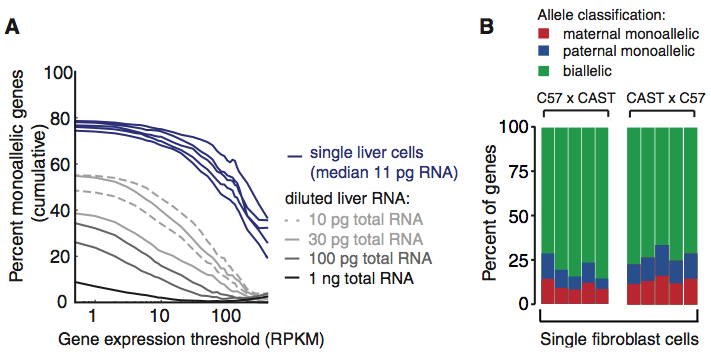
The allelic expression data used in this study came from embryonic cells that are undifferentiated. So, researchers asked if they would observe the same random monoallelic expression in mature cells. The transcriptome of liver cells were sequenced as well as a control dilution series of RNA attained from liver tissue. Panel A shows that mature liver cells had a higher percentage of monoallelic genes than the control dilutions and this percentage increased with expression threshold. In panel B the study observed the monoallelic expression of mouse fibroblasts to be on average 24% of the genes expressed, similar to the findings in the mouse preimplantation embryo cells. Both panels in this figure support that random monoallelic expression is a frequent occurrence in both embryonic and mature cells.
Opinion
This paper does a thorough job of considering the implications the methods have on the results. This is primarily seen when they performed the split-pair experiment in order to determine the degree of random losses of RNA species. The researchers were aware that their methods had inflated the observed monoallelic gene expression. However by modeling the random losses in RNA species, they were able to more accurately predict the degree of monoallelic expression. Such an experiment only strengthens the conclusions of the study because it eliminates systematic sources of error. Another way the researchers were keeping their methods in check is when they analyzed individual cells of pure C57 or CAST background. The result was that greater than 99% of the reads were correctly classified, meaning the accuracy in alignment and SNP annotation used in Smart-Seq and Smart-Seq2 was a reliable method.
However, the paper has one particular weakness that stood out: the sample size used in various experiments. One such experiment was the one that demonstrated that Xp experienced de novo inactivation. The figure legend informs us that the sample size for each developmental stage ranges from 3 to 28 cells. Having only 3 cells at any developmental stage adds a considerable amount of uncertainty in our data. It is difficult to establish a particular trend with such few cells. In particular, if the sample size for the 16-cell stage or early blastocyst were 3 cells, this would be of concern since these were stages where the data significantly varied from other genomic conditions. Another experiment where the sample size was concerning was in panel E of Figure 3, where they demonstrated that when cells were grouped by embryo, the percent of monoallelic expression drastically fell. All these developmental stages have a sample size of 4 or less. Such a small sample size would make it hard to come to the conclusion that embryos showed little to no monoallelic expression. Moreover, this small sample size makes us questions how definitively the researchers could conclude that randomness in monoallelic expressions was only cell-specific. This conclusion, based off a small sample size, was an integral piece of the paper. The conclusion could be strengthened with a greater sample size in order to further validate the trend they observed.
References
Email Questions or Comments to gacambronero@davidson.edu
© Copyright 2014 Department of Biology, Davidson College, Davidson, NC 28035