This web page was produced as an assignment for an undergraduate course at Davidson College.
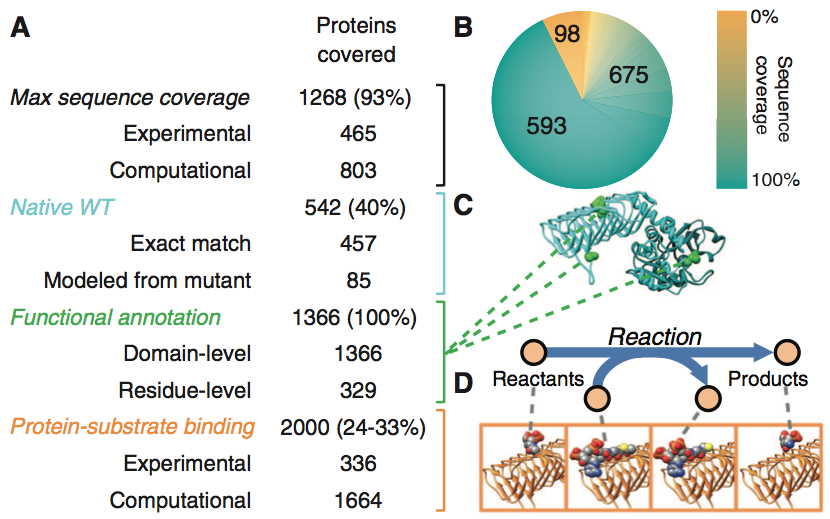
Figure 1 visualizes the GEM-PRO metabolic model which includes protein structural properties as a parameter. The model was achieved by identifying proteins according to amino acid sequence and structures first. Then, amino acid functional annotations which represent metabolic reactions were paired with their corresponding enzyme structural data.
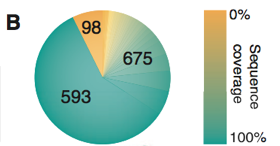
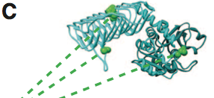
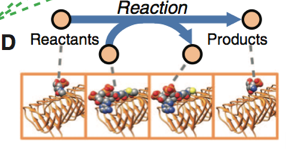
Panel A gives us the number of proteins analyzed in each category and sub-category. Structures determined from previous wet-lab experiments and computational modeling were used to analyze proteins of interest for maximal amino acid sequence coverage, wild-type protein structure and protein-substrate binding. Out of 1366 proteins, there is a 93% coverage for the maximal sequence coverage by structure (Panel B) and 40% for native wild-type (WT) protein structures (Panel C). All 1366 proteins were functionally annotated. Out of between 6144 and 8448 binding pairs, protein-substrate binding conformation (Panel D) achieved a coverage between 24 and 33%.
Panel B displays the number of proteins with a range of maximal sequence coverage by structure. 98 proteins have 0% coverage and 593 proteins have 100% coverage, while 675 proteins have partial sequence coverage with the color gradient representing the varying percent of coverage.
Panel C shows us an example of a wild-type protein structure. Green areas represents amino acid functional annotations with known metabolic reactions.
Panel D shows us a diagram of a protein-substrate binding and the changes in the structures as the protein interact with the reactant to result in the product of the catalyzed metabolic reaction.
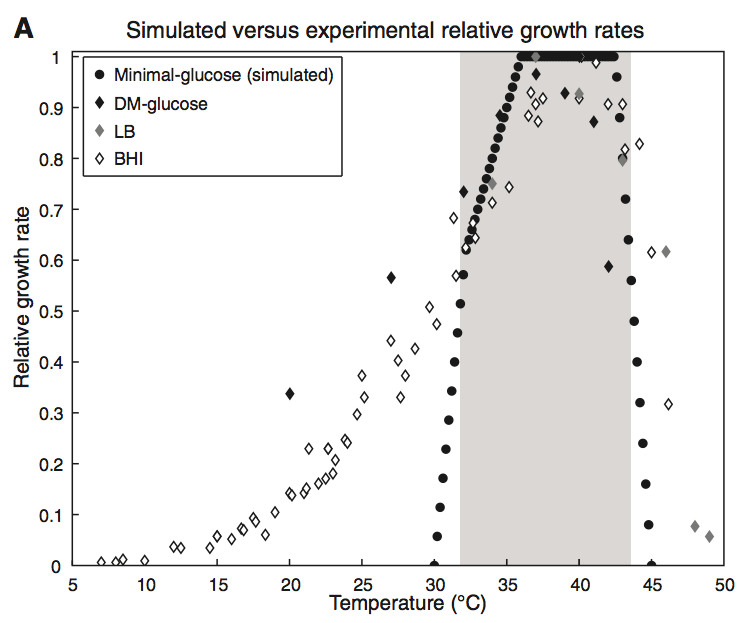
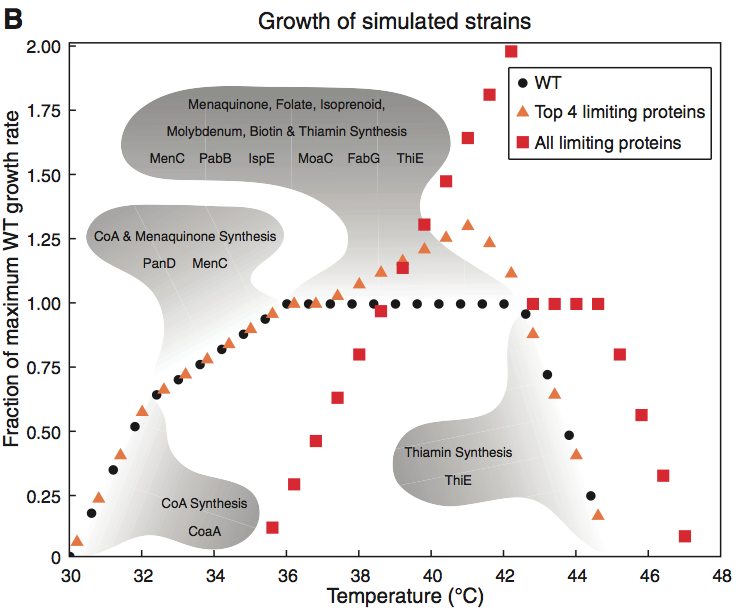
Figure 2 contain two graphs of simulated and experimental growth rate versus temperature.
Panel A compares the relative growth rate to maximum growth rate (marked as 1) of E. coli in four conditions: model simulation in minimal glucose medium (circles) and three other wet-lab experiments with different mediums of Davis minimal medium (DM) with glucose, lysogeny broth (LB) and brain heart infusion (BHI) broth (diamonds). The simulation has the steepest slope as relative growth rate increases over the shortest range of temperatures. The model prediction for growth rate works best for the temperature range in the shaded region where the four conditions display similar relative growth rates within the range. Thus, we can infer that the range of 32 – 43 C represent the optimal temperature where thermostability of protein is achieved.
Panel B compares simulated growth rates obtained from the model to maximum wild type growth rate (marked as 1). In particular, the study focuses on proteins in the network which limit E. coli growth rate at higher temperatures, termed as “growth-limiting”.
Figure 3 summarizes predicted mechanisms and gene mutations for thermotolerance in E. coli mutants. Previous adaptive laboratory evolution experiments provided 119 heat-adapted strains with 610 mutated genes (salmon-colored ellipse). Two subsets for mechanisms confering to thermotolerance were categorized: regulatory mutations in 118 out of 119 strains (light pink) and metabolic gene mutation in 114 out of 119 strains (orange). The model simulated that 7 metabolic genes contribute to thermosensitivity and 5 regulators act on metabolic genes down the pathway (circles in the yellow area) to activate transcription in wild-type strains during heat exposure. By estimating metabolic genes for thermotolerance, the study predicted growth factor proteins which were heat-limited due to decreased protein activity (shown on the right column).
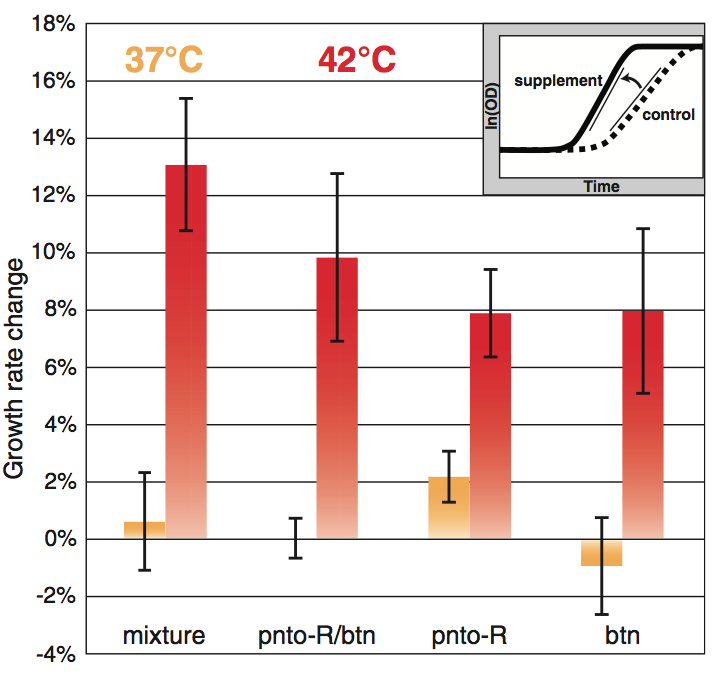
Figure 4 measures changes in E. coli growth rate when various supplementations were added at 37 C and 42 C. The growth rate changes were calculated by comparing the maximum rate of the added condition over that of the control. The purpose of the experiment was to examine whether heat-limited proteins could further compensate their thermosusceptibility through additional nutrients when exposed to heat stress. The proteins of interest were growth-limiting at 42 C but in the range of optimal enzymatic temperatures for E. coli at 37 C. The researchers found the nutrient compounds by inspecting known supplemental metabolic products downstream of the heat-limited growth factors in Figure 3. The results show that supplemental conditions contributed to an increased change in growth rate at the higher temperature but showed no benefit at 37 C. A mixture of all six compounds exhibited the greatest disparity in growth rate (13%). Two metabolites, pantothenate and biotin, produced the highest changes individually, but a combination of the two resulted in a lower change than the mixture of all six supplemental compounds which seemed to benefit E. coli the most.
Reference:
Genomics Page
Biology Home Page
© Copyright 2014 Department of Biology, Davidson College, Davidson, NC 28035