PABA standardization and PABA and glycine ethyl ester column formation
I assessed the concentration of the ligand before and after coupling. The standard curve allowed me to quantify unknown ligand concentration. The PABA optical density (OD) standardization curve (Fig. 3) was taken at 258 nm.
Once I had completed the standard curve I proceeded with the coupling procedure. The column itself required no analysis, but the washing that came off it did. The original PABA solution volume was 25 ml and was subsequently diluted to 138 ml in the coupling procedure. After the coupling reaction a 100 ul portion of that diluted PABA sample was put into 27.07 ml water. This sample was used for OD258 analysis and produced a reading of 1.175. Using this OD value in equation 1 (Fig. 3),
(1) Y = (12727)(X) + (0.0219)
where Y is the OD value and X is the molar concentration of the sample, yields a molarity of 90.6 µM. The molarity of the PABA solution before coupling was 0.15 M; tenfold the reactive site concentration (15 mM). Using equation 2,
(2) (M1)(V1) = (M2)(V2)
where M1 and V1 are the molarity and volume of a solution and M2 and V2 are the molarity and volume of that original solution after either concentration or dilution, the theoretical molarity, if coupling had been 100 percent, would be 0.1358 M, a 10 percent reduction.
Using the value generated from the observed OD reading processed in equation 1 (90.6 µM) with the sample volume from which it came (27.17 ml), and the amount used in the dilution (100 µl) in equation 2 yields a diluted sample of 24.6 mM. Using this value with the sample volume from which it came (138 ml) and the original PABA volume (25 ml) yields a value of 0.1358 M. This value is identical to the value predicted by a 10 percent reduction, indicating a 100 percent coupling efficiency.
The glycine ethyl ester column washings were not quantified. Column washings were monitored until OD280 analysis indicated reactant absence. This coupling quantification method was followed as described in the BioRad Affi-Gel 10 blocking procedure.
Affinity Chromatography
Step Gradient Elution
Protein Set A; Gel Set 1
After column completion and protein homogenization, protein samples (~ 4.0 ml) were added to experimental and control columns. Before using the linear gradient elution protocol, I used a step gradient to elute proteins. The gradient consisted of a 20 ml buffer B flow through wash, a 20 ml 0.5 M aqueous sodium chloride wash, and a 20 ml 1.0 M sodium chloride wash. The experimental and control columns yielded three 20 ml fractions for each of the respective washes. The flow through wash was designed to elute all proteins that had no ionic interactions with the respective matrices. The 0.5 M sodium chloride wash was designed to elute proteins that had weak ionic interactions with the respective matrices. The 1.0 M sodium chloride wash was designed to elute all remaining bound proteins, those with strong ionic interactions. The Lowry protein quantification method indicated that some of the fractions indeed had protein (Table 1).
After the unsuccessful primary trial, I prepared another homogenate for affinity chromatography. I again used a step gradient elution, though I modified it slightly. Instead of using non-buffered sodium chloride solutions, I used buffered sodium chloride washes to ensure a consistent pH throughout the elution process. I also collected 10 ml as opposed to 20 ml fractions. The PABA and control columns both produced six 10 ml fractions: 2 (A and B) buffer B flow through fractions, 2 (A and B) 0.5 M sodium chloride fractions, and 2 (A and B) 1.0 M sodium chloride fractions. I used buffered solutions for the sodium chloride. I quantified the respective protein using the Lowry method protein quantification method (Table 3). I concentrated those fractions that registered protein levels below 1 µg/µl. To determine the concentration of the concentrated samples, I measured the quantity of volume lost and recalculated the protein concentration using Lowry data and with the new volume.
Protein Set B; Gel Set 3
To correct for the faint protein staining witnessed in the previous gels I ran another set of gels using greater protein quantities. I loaded maximal amounts of protein to two prefabricated 10% acrylamide gels. The wells of the PABA and control gels contained the protein contents and quantities outlined in Figures 6 and 7 respectively. After staining the banding was evident but still not the extent that allowed for firm qualitative analysis.
I decided to use nondiamine silver staining as an alternative to coomassie staining because of its sensitivity to small quantities of protein (Deutscher, 1990). Due to its insensitivity Coomassie blue stains hundreds of tightly packed, distinct proteins, as a continuous protein smear. However, silver staining, because it stains proteins through the interaction between individual silver grains and proteins, can resolve a protein smear into distinct protein bands. As a trial, I repeated the PABA gel (Fig. 6) from above but stained it using a silver method. Though I over developed the image (Fig. 8), the silver staining proved extremely effective. One drawback to this method, however, is its extreme sensitivity to any extraneous protein, such as that from a fingertip. Such extraneous proteins can and will be apparent upon development.
Protein Set C; Gel Set 4
I ran another set of columns to get a fresh set of proteins. Instead of a step gradient I used a linear sodium chloride gradient to elute the proteins from the columns. I did this in large part because a step gradient required more manual addition of the eachof the different washes. The PABA and the control columns both produced five 12 ml fractions that were collected over a 60 ml buffer B gradient ranging from 0.0 M sodium chloride to 1.0 M sodium chloride. I quantified the respective protein fractions using the Lowry protein quantification method (Table 5). Since some of the protein fractions did not register detectable protein quantities I concentrated them further. I quantified the concentrated protein fractions using the Lowry method (Table 6).
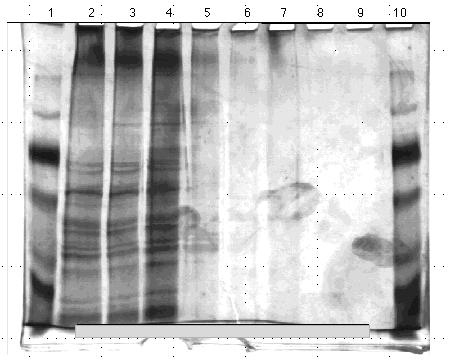
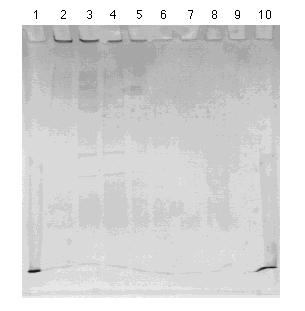
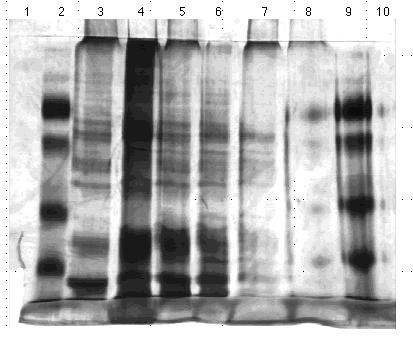
Figure 9. 10% acrylamide SDS gel displaying affinity chromatography frcations from control column with eluted with 0.0 M to 1.0 M NaCl linear gradient. (Lane) 1) 5 µg molecular weight standard; 2) 5 µg crude homogenate; 3) 5 µg control gradient fraction A; 4) 5 µg control gradient fraction B; 5) 5 µg control gradient fraction C; 6) 5 µg control gradient fraction D; 7) 5 µg control gradient fraction E. 8) empty; 9) empty; and 10) 5 µg low molecular weight fraction. The molecular weight standard contained the following protein markers: phosphorylase B (103 kDa); bovine serum albumin (76 kDa); ovalbumin (49 kDa); carbonic anhydrase (33 kDa); soybean trypsin inhibitor (28 kDa); and lysozyme (19 kDa). Gel stained with nondiamine silver stain.
To reduce background interference incurred using prefabricated gels, I poured my own gels and repeated the gels from above (Fig. 11 and 12). These gels did reduce the background, however, the combs did not work properly, in that they were too narrow for the spacers used. Consequently, the stacking gel solidified on four sides instead of two making the wells unable to accommodate the required 30 µl of sample.
Protein Set C; Gel Set 6
Qualitative assessment of the gels revealed that equal amounts of protein were not loaded onto the gels. Qualitatively certain lanes had significantly more protein than others, though the Lowry data indicated that the portions loaded were in fact the same. To resolve this, I used the Lowry method to assess the protein levels of the samples relative to one another. The sample concentrations indeed proved inconsistent, and furthermore the triplicate data generated were scattered. To correct for the latter problem I used a new, recently calibrated set of pipettors.
I ran another set of gels using these same proteins, based on relative Lowry data and qualitative assessments of the previous gel sets. I loaded two 10% acrylamide gels with the protein contents and quantities outlined Figures 13 and 14. I stained these gels using the silver method and photographed them. Again, the protein quantities did not appear consistent. Furthermore the protein aggregations at the bottoms of some lanes indicated the proteins had degraded to the point that they could no longer be resolved by size on a gel.
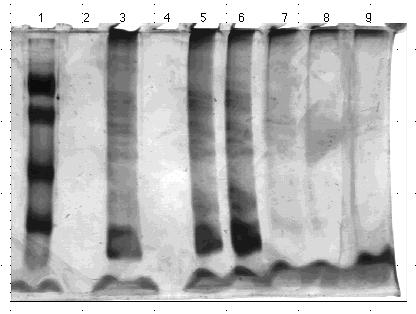
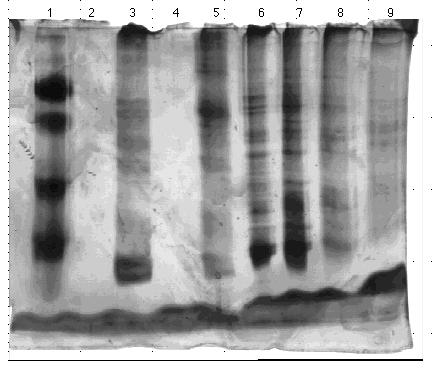
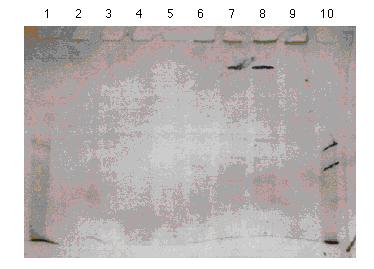
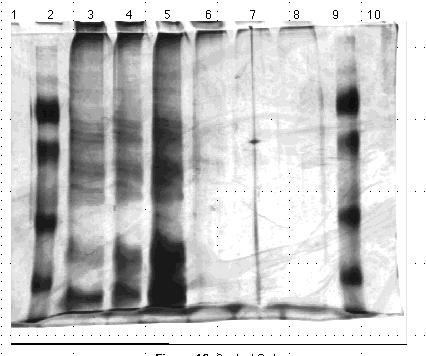
Figure 14. 10% acrylamide SDS gel displaying
affinity chromatography fractions from PABA column eluted with 0.0 M to
1.0 M NaCl linear gradient. (Lane)1) 5 µg low molecular weight standard;
2) empty; 3) 0.5 µl crude homogenate; 4) empty; 5) 5.3 µl PABA
gradient fraction A; 6) 3.8 µl PABA gradient fraction B; 7) 6 µl
PABA gradient fraction C; 8) 20 µl PABA gradient fraction; and 9)
20 µl PABA gradient fraction E. The molecular weight standard
contained the following protein markers: phosphorylase B (103 kDa); bovine
serum albumin (76 kDa); ovalbumin (49 kDa); carbonic anhydrase (33 kDa);
soybean trypsin inhibitor (28 kDa); and lysozyme (19 kDa). Gel stained
with nondiamine silver stain.
Protein Set D; Gel Set 7
I ran columns again to get fresh proteins. Instead of using only the linear gradient to elute proteins off the column I added a flow through wash. The control column produced one 10 ml flow through fraction and six 10 ml 0.0 M ó 1.0 M sodium chloride gradient fractions. The experimental column produced the same number of gradient fractions and an additional flow through fraction (the bed volume of the experimental column was twice that of the control column). Initial Lowry results indicated that all twelve gradient fractions needed further concentrating. After concentrating the fractions with Eppendorf concentrator tubes, I quantified the fractions using the Lowry protein quantification method (Table 7).
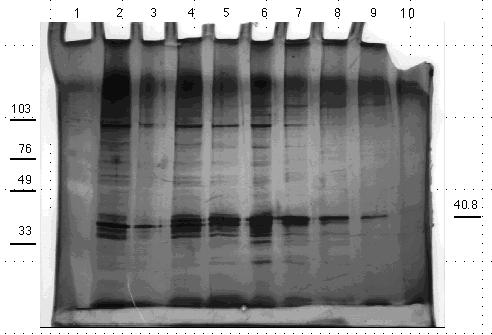
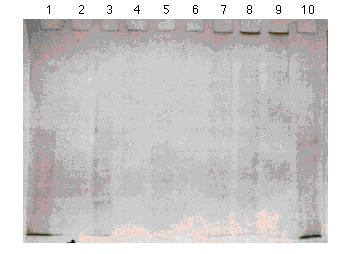
Figure 15. 10% acrylamide SDS gel displaying affinity chromatography fractions from control column eluted with 0.0 M to 1.0 M NaCl linear gradient. (Lane) 1) 5 µg low molecular weight standard; 2) 5 µg crude homogenate; 3) empty; 4) 5 µg control flow through fraction; 5) 5 µg control gradient fraction A; 6) 20 µl control gradient fraction B; 7) 20 µl control gradient fraction C; 8) 20 µl control gradient fraction D; 9) 20 µl control gradient fraction E; 10) 20 µl control gradient fraction F. The molecular weight standard contained the following protein markers: phosphorylase B (103 kDa); bovine serum albumin (76 kDa); ovalbumin (49 kDa); carbonic anhydrase (33 kDa); soybean trypsin inhibitor (28 kDa); and lysozyme (19 kDa). Gel stained with nondiamine silver stain.

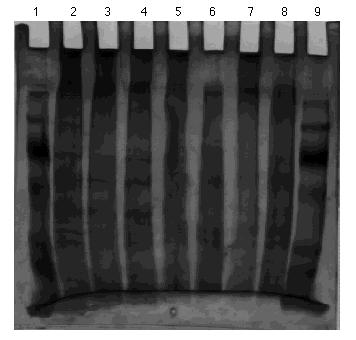
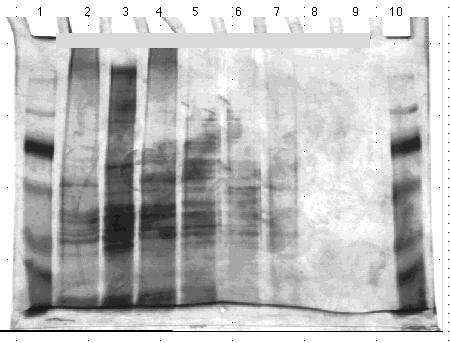
Figure 16. 10% acrylamide SDS gel displaying
affinity chromatography fractions from PABA column eluted with 0.0
M to 1.0 M NaCl linear gradient. (Lane) 1) 5 µg low molecular weight
standard; 2) 5 µg crude homogenate; 3) 5 µg PABA flow through
fraction A; 4) 5 µg PABA flow through fraction B; 5) 20 µl
PABA gradient fraction A; 6) 20 µl PABA gradient fraction B; 7) 20
µl PABA gradient fraction C; 8) 20 µl PABA gradient fraction
D; 9) 20 µl PABA gradient fraction E; 10) 20 µl PABA gradient
fraction F. The molecular weight standard contained the following
protein markers: phosphorylase B (103 kDa); bovine serum albumin (76 kDa);
ovalbumin (49 kDa); carbonic anhydrase (33 kDa); soybean trypsin inhibitor
(28 kDa); and lysozyme (19 kDa). Gel stained with nondiamine silver
stain.
The standards did not stain properly and careful examination was required to determine the correct banding pattern of the molecular weight standards. To calculate the molecular weights of individual bands, I plotted the natural log of the molecular weight standards versus the distance the bands traveled relative to one another for both experimental and control gels (Fig. 17 and 18).
The PABA gel produced comparable protein banding in the crude and flow
through fractions. The early gradient washes, however, produced fewer bands
than the control gel. The later PABA gradient fractions did result in protein
bands unseen in the later control gradient fractions. Three bands, 38 kDa,
44 kDa, and 51 kDa were evident in the final lane of the gel. The 44 kDa
band appeared in prior fractions and remained a consistent intensity throughout
the gel. This consistency of the 44 kDa protein band suggests that it may
also be keratin contamination, whereas the 38 kDa and 51 kDa bands were
not evident in the early gradient fractions but gradually emerged as the
salt concentration increased. This increasing band intensity with the increasing
salt gradient is to be expected of proteins binding selectively to the
ligand. The emergence and localization to the high salt wash of the 38
kDa and 51 kDa bands suggests that these proteins bind PABA in a specific
fashion.